NEPA Noise and the FA18 EF Dan Cecchini


 made available for")


 and 1 Fleet Replacement Squadron")


 noise contours • Different resources")

")

 and Estimated Population within Projected Noise Zones at NAS Oceana and")
 – Flight Operations • 31, 652")


 • Sound exposure represents both intensity and duration of a")
 for Aircraft on Approach,")


- Slides: 30
NEPA, Noise and the F/A-18 E/F Dan Cecchini Head, COMLANTFLT NEPA Support Atlantic Division, Naval Facilities Engineering Command 7 April 2004
The Super Hornet • Latest version of the Hornet aircraft with state of the art mission capability • West Coast Super Hornets are stationed in California at NAS Lemoore
History of Super Hornet 1995 • Congress approved initial test production 1998 • West Coast introduction begun 2000 • Congress authorized full production (to include the Atlantic Fleet) • East Coast EIS Scoping Meetings
History of Super Hornet - continued 2002 • Draft EIS (DEIS) made available for public review • DEIS Comment Period and Public Hearings July • Final EIS (FEIS) released 2003 Sept • Record of Decision 2003 Jan • Lawsuits filed 2004
Proposed Action • Provide facilities and functions to support the homebasing and operation of 10 Super Hornet fleet squadrons (120 aircraft) and the Fleet Replacement Squadron (24 aircraft) – Replace Tomcat and earlier model Hornet aircraft – Construction of support facilities: • • • Aircraft support (hangars, runways, refueling, etc. ) Maintenance Training Personnel support (medical, dental, etc. ) Housing
Basing Alternatives Considered • ALT 1: All 10 fleet squadrons and the FRS at NAS Oceana • ALT 2: All 10 fleet squadrons and the FRS at MCAS Cherry Point • ALT 3: All 10 fleet squadrons and the FRS at MCAS Beaufort (Existing USMC assets move to MCAS Cherry Point) • ALT 4 A: 6 fleet squadrons and the FRS at NAS Oceana, 4 fleet squadrons at MCAS Cherry Point • ALT 4 B: 6 fleet squadrons and the FRS at NAS Oceana, 4 fleet squadrons at MCAS Beaufort • ALT 5 A: 6 fleet squadrons and the FRS at MCAS Cherry Point, 4 fleet squadrons at NAS Oceana • ALT 5 B: 6 fleet squadrons and the FRS at MCAS Cherry Point, 4 fleet squadrons at MCAS Beaufort • ALT 6: 8 fleet squadrons and the FRS at NAS Oceana, 2 fleet squadrons at MCAS Cherry Point
The Decision • 8 Super Hornet squadrons (96 aircraft) and 1 Fleet Replacement Squadron (24 aircraft) at Naval Air Station Oceana in Virginia Beach, Va. • 2 squadrons (24 aircraft) at Marine Corps Air Station Cherry Point in North Carolina. • Construction of an OLF in North Carolina
The Decision ALT 6 NAS Oceana MCAS Cherry Point • Majority of fleet aircraft based at NAS Oceana – Optimizes readiness – Achieves economics of scale • Provides some noise and air quality mitigation
Proposed OLF in Washington County • 8, 000’ Runway • LAND Acquisition • 3000 acre core area • Total of about 30, 000 acres within 60 db noise contours • 30, 000 Field Carrier Landing Practices (FCLPs) Per Year • Rural County of 13, 700 people
Candidate OLF Sites Location Legend: Washington Site A: Perquimans County, NC Site B: Bertie County, NC Site C: Washington County, NC Site D: Hyde County, NC Site E: Craven County, NC Site F: Burke County , GA A B C D E F
Washington County NC OLF Site – Easily accessible from NAS Oceana and MCAS Cherry Point – Operationally ideal – Low population density – Compatible land use – Lack of encroachment pressure – Projected 32, 000 annual operations – Operational temp will be cyclic – Wildlife refuge 5 miles away
Field Carrier Landing Practice - FCLP • Trains pilots for landing on aircraft carriers • FCLP operations are conducted on a runway that simulates the aircraft carrier deck
How to Present Noise Impacts? • Day-night average (DNL) noise contours • Different resources impacted – Sometimes DNL is just not enough • Augmented DNL with: – – Noise equivalent sound level (Leq) for school days Specific DNL for locations of interest Sound Exposure Level (SEL) data Onset-Rate Adjusted Monthly DNL (or Ldnmr)
Day-Night Average • Presents 24 -hour average noise metric – Takes into account frequency of operations, loudness of aircraft, duration of noise event and location of operations – 10 d. B penalty for nighttime operations – Presented as a series of noise contours – usually to 65 d. B – Measure of annoyance • Most common noise metric used in EISs • Criticized by many – “Not what I hear!!!!”
Oceana/Fentress Alt 6 Noise Contours (w/ OLF)
Noise Impacts • NAS Oceana - Increases population within the 65+ DNL contour by: – 10, 031 (11% increase from 2000 baseline) • MCAS Cherry Point - Increases population within the 65+ DNL contour by: – 202 (2% increase from 2000 baseline)
Off-Station Area (Acres) and Estimated Population within Projected Noise Zones at NAS Oceana and NALF Fentress under Dual-Siting Alternatives 4 A and 4 B Table 4 -9 Existing ALT 4 A without OLF ALT 4 A with OLF ALT 4 B without OLF Area Pop. ALT 4 B with OLF Area Pop. 65 to 70 d. B 13, 076 37, 428 14, 950 37, 216 14, 185 34, 391 15, 411 38, 887 14, 729 35, 571 70 to 75 d. B 9, 151 26, 752 9, 980 29, 035 9, 698 28, 899 10, 192 29, 396 9, 809 29, 435 12, 462 23, 349 15, 916 32, 863 10, 212 31, 552 16, 331 33, 987 11, 158 32, 917 34, 689 87, 529 40, 846 99, 114 34, 095 94, 842 41, 934 102, 270 35, 696 97, 923 Net Change 6, 157 11, 585 (594) 7, 313 7, 245 14, 741 1, 007 10, 394 Percent Net Change 18% 13% (2%) 8% 21% 17% 3% 12% 75 d. B or greater Total Source: Wyle Laboratories, Inc. , 2003. Area Pop.
Noise Zones – Site C (Washington County, NC) – Flight Operations • 31, 652 ops/year – Noise Zones • 24, 000 acres – Population • 141 people
Population Within the 60 DNL Contour at the OLF Sites
Site Analysis - Noise Impacts Increase or decrease in percentage of population within 65 DNL contour
Site Specific DNL • Locations of interest – Worked with local community to help identify – All public schools were included if in noise contours • Presented DNL value for each location • Most people lived near a site chosen – Able to get a good feel for how loud at their house • Criticism – “Still using average!!!”
Table 4 -18 Average Noise Levels Projected at Representative Other Locations of Interest Near NAS Oceana and NALF Fentress under Dual-Siting Alternatives 5 A and 6 a Existing Identification Numberb/Name DNL (d. B) ALT 5 A Leq (d. B) DNL (d. B) ALT 6 without OLF Leq (d. B) DNL (d. B) Leq (d. B) ALT 6 with OLF DNL (d. B) Leq (d. B) Virginia Beach VB 1 Virginia Beach Sentara Hospital 65 65 63 63 66 66 VB 2 Virginia Beach Pavilion 76 76 75 74 79 78 VB 3 Verizon/Virginia Beach Amphitheater 59 57 57 56 61 59 60 58 VB 4 Lynnhaven Mall Shopping Center 79 77 79 76 82 80 VB 5 Cavalier Hotel 63 63 61 62 64 64 65 64
Sound Exposure Level (SEL) • Sound exposure represents both intensity and duration of a sound – Net impact of an entire acoustic event • Better represents what people will actually hear • EIS provided SEL data for generic events and for top five events at each location of interest • Criticisms – Very few
Table 4 -19 Comparison of Representative SEL Values (d. B) for Aircraft on Approach, Departure, and in the FCLP or Touch-and-Go Pattern Altitude (ft AGL) F 14 A Approach 1, 000 93 87 Departure 1, 000 110 108 Operation FCLPa F 14 B/D F/A-18 C/D F/A-18 E/F AV-8 B EA-6 B 109 114 103 107 117 113 114
Summary – Lessons Learned • DNL is a good metric and should be used • Should consider augmenting DNL with other metrics such as Leq and SEL – Reader friendly – Go the extra mile • Use good maps! • Keep it simple
The Way Ahead 2004 • 2005 • 2007 • 2010 • FRS Standup Construction of OLF begins OLF complete Homebasing complete
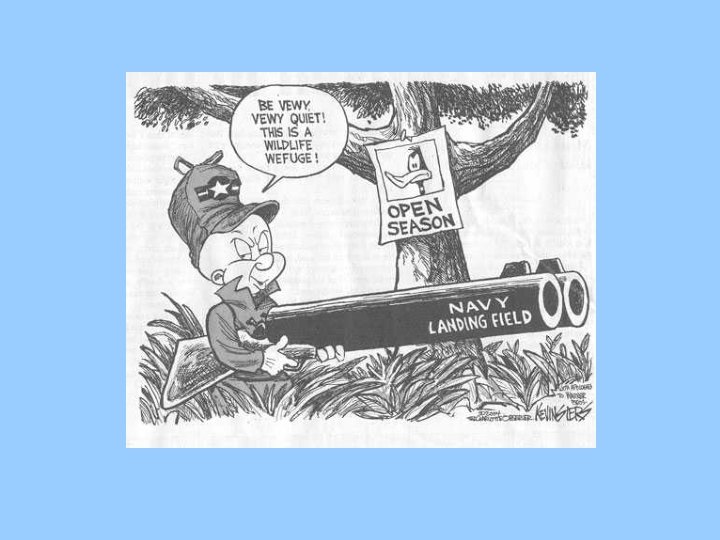
Opponents
Opponents
The Grim Reaper