Nematode Thresholds and Damage Levels for California Crops


z(Pi-T) • • • Y=relative yield m=minimum yield Z=regression")
olerance Z m SJ 2 loamy sand")

olerance Z m Bell Pepper 65 0.")


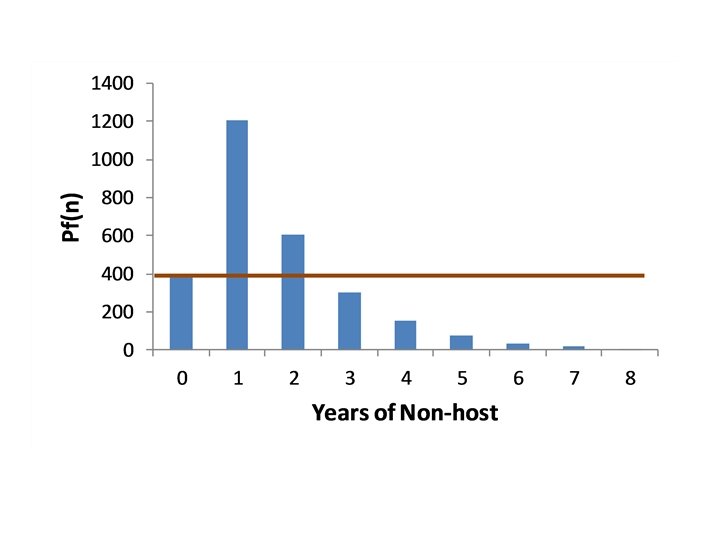
 1200 1000 800 600 400 200 0 0 1 2 3")


- Slides: 24
Nematode Thresholds and Damage Levels for California Crops Howard Ferris
Some of those involved…. • • Dan Ball Larry Duncan Pete Goodell Joe Noling Diane Alston Sally Schneider Lance Beem
The Economic Threshold amended That initial population at which the difference in crop value with and without management is equal to the cost of the management Premises: • • Most nematode management decisions made before planting Pest population already present Pest population measurable Growing conditions are stable – temperature, moisture – time of planting Nematode population dynamics should be stable Damage should be predictable
Thresholds by field plot South Coast Field Station USDA Shafter Tulelake
Thresholds by transect Imperial and Coachella Valleys Ventura County Tulare County
Economic Threshold – Discrete Costs Model
Optimization – Continuous Costs Model
Seinhorst Damage Function • Y=m+(1 -m)z(Pi-T) • • • Y=relative yield m=minimum yield Z=regression parameter Pi=population level T=tolerance level • Based on preplant population levels – measured or predicted from overwinter survival rates
Case Study on Cotton Cultivar Soil Location (T)olerance Z m SJ 2 loamy sand south SJV 65 0. 998 0. 55 Deltapine loamy sand imperial 50 0. 9972 0. 65 SJ 2, SJ 5, SJ-C 1 l. sand/s. loam south SJV 55 0. 999 0. 48 average (all) ----------- 57 0. 998 0. 56 average (SJV) ----------- 60 0. 9985 0. 52 SJ 2(-FOV) sandy loam south SJV 55 0. 9966 0. 54 SJ 2(+FOV) sandy loam south SJV 55 0. 9847 0. 38
Case Study on Cotton Meloidogyne incognita, J 2/250 cc soil Expected % yield loss at different preplant nematode densities Cultivar Soil Location Threshold 20 50 100 200 500 SJ 2 loamy sand south SJV 25 0 5 15 27 41 Deltapine loamy sand imperial 19 0 7 16 26 34 SJ 2, SJ 5, SJ-C 1 l. sand/s. loam south SJV 21 0 4 10 19 37 average (all) ----------- 22 0 6 15 27 40 average (SJV) ----------- 23 0 5 12 24 41 SJ 2(-FOV) sandy loam south SJV 21 0 10 23 37 45 SJ 2(+FOV) sandy loam south SJV 21 0 42 59 62 62
Damage Function Parameters for Selected Crops Crop (T)olerance Z m Bell Pepper 65 0. 9978 0. 87 Cantaloupe 10 0. 9972 0. 40 Carrot 0 0. 99 0. 6 Chile Pepper 39 0. 9934 0. 70 57. 5 0. 9976 0. 6 Cowpea 22 0. 9816 0. 96 Potato 18 0. 99 0. 49 Snapbean 14 0. 9978 0. 57 Squash 0 0. 9898 0 Sugarbeet 0 0. 9955 0. 89 Sweetpotato 0 0. 99375 0. 47 41. 8 0. 99934 0. 47 Cotton Tomato
Thresholds and Expected Yield Loss Meloidogyne incognita, J 2/250 cc soil; adjusted for extraction efficiency Expected % yield loss at different preplant nematode densities Crop Threshold 1 2 5 10 20 50 100 200 Bell Pepper 25 0 0 0 2 5 8 Cantaloupe 4 0 0 1 3 7 17 30 46 Carrot 0 1 2 5 9 16 29 37 40 Chile Pepper 15 0 0 3 14 24 30 Cotton 22 0 0 0 6 15 27 Cowpea 52 0 0 0 6 8 Potato 7 0 0 0 4 15 34 47 51 Snapbean 5 0 0 0 1 3 10 18 29 Squash 0 3 5 12 23 41 74 93 100 Sugarbeet 0 0 0 1 1 2 5 8 10 Sweetpotato 0 1 2 4 8 15 30 43 51 Tomato 16 0 0 0 3 7 14
Expected Damage Meloidogyne chitwoodi; summer crop potato; Klamath Basin Fall population levels; adjusted for extraction efficiency Expected % tuber blemish at different fall nematode densities J 2/250 cc 1 2 5 10 20 50 100 200 500 % Blemish 3 4 5 7 8 12 15 18 25
temporal avoidance
Thresholds and Expected Yield Loss Heterodera schachtii, eggs/100 g soil Sugarbeets Cultivar Soil Location (T)olerance Z m US-H 9 clay Imperial 100 0. 99886 0 US-H 9 loam SJV/Idaho 300 0. 99976 0 Expected % yield loss at different preplant nematode densities Cultivar Soil Location Threshold 50 100 200 500 1000 US-H 9 clay Imperial 100 0 0 11 37 64 US-H 9 loam SJV/Idaho 300 0 5 15 Data from P. A. Roberts
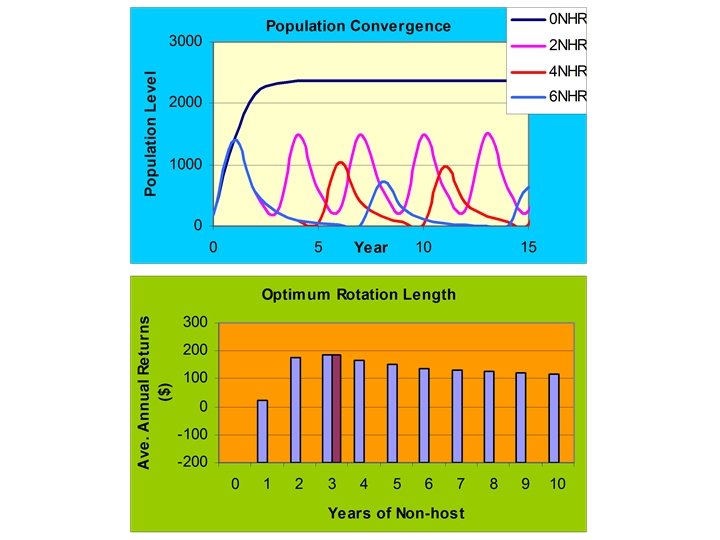
Optimized Discrete Model
1600 1400 Pi(t+x) 1200 1000 800 600 400 200 0 0 1 2 3 4 5 6 7 Years After Planting Host Crop 8
Perennial Crop Considerations
Year 1 Year 2 AUC 80 60 LU 40 LT 20 NU 0 NT 0 1000 DD 2000 3000 AUC LU LT NU NT 0 1000 DD 2000 3000 LU LT NU NT 0 Year 3 30000 25000 20000 15000 10000 5000 0 12000 10000 8000 6000 4000 2000 0 AUC 1000 DD 2000 3000
Some References Benedict, J. H. , K. M. El-Zik, L. R. Oliver, P. A. Roberts, and L. T. Wilson. 1989. Economic injury levels for cotton pests. Chapter 6. In: Integrated Pest Management Systems and Cotton Production. R. E. Frisbie, K. M. El-Zik, and L. T. Wilson (eds. ). John Wiley and Sons, New York. Pp. 121 -153. Cooke, D. A. , and I. J. Thomason. 1979. The relationship between population density of Heterodera schachtii, soil temperature, and sugarbeet yields. Journal of Nematology 11: 124 -128. Duncan, L. W. and H. Ferris. 1983. Effects of Meloidogyne incognita on cotton and cowpeas in rotation. Proceedings of the Beltwide Cotton Production Research Conference: 22 -26. Ferris, H. 1984. Probability range in damage predictions as related to sampling decisions. Journal of Nematology 16: 246 -251. Ferris, H. 1985. Population assessment and management strategies for plant-parasitic nematodes. Agricultural, Ecosystems and Environment 12(1984/85): 285 -299. Ferris, H. , D. A. Ball, L. W. Beem and L. A. Gudmundson. 1986. Using nematode count data in crop management decisions. California Agriculture 40: 12 -14. Ferris, H. L. Carlson and B. B. Westerdahl. 1994. Nematode population changes under crop rotation sequences: consequences for potato production. Agronomy Journal 86: 340 -348. Ferris, H. , P. B. Goodell and M. V. Mc. Kenry. 1981. Sampling for nematodes. California Agriculture 35: 13 -15. Goodell, P. B. , M. A. Mc. Clure, P. A. Roberts, and S. H. Thomas 1997. Nematodes. In: Integrated Pest Management for Cotton in the Western Region of the United States. 2 nd edition. Univ. of California Publ. No. 3305. Pp. 103 -110. Roberts, P. A. and G. D. Griffin. 1994. The economic feasibility of management alternatives. In: Quantifying Nematode Control. G. D. Griffin and P. A. Roberts (eds. ). Western Regional Research Publication #149, Utah State University Press, Logan, UT. Pp. 23 -49. Roberts, P. A. and I. J. Thomason. 1981. Sugarbeet Pest Management: Nematodes. Univ. of California Special Publ. No. 3272. 32 pages.