
NECSI Summer School 2008 Week 3 Methods for


- Slides: 58
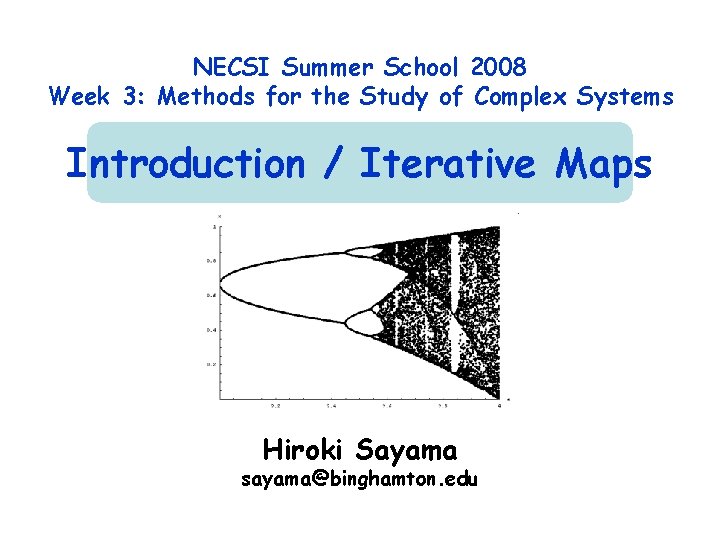
NECSI Summer School 2008 Week 3: Methods for the Study of Complex Systems Introduction / Iterative Maps Hiroki Sayama sayama@binghamton. edu
Introduction 2
Course objective • To provide an introduction to a variety of mathematical concepts and tools for analysis of complex systems – Textbook: Bar-Yam, Y. “Dynamics of Complex Systems” (Perseus Books/Westview Press, 1997) 3
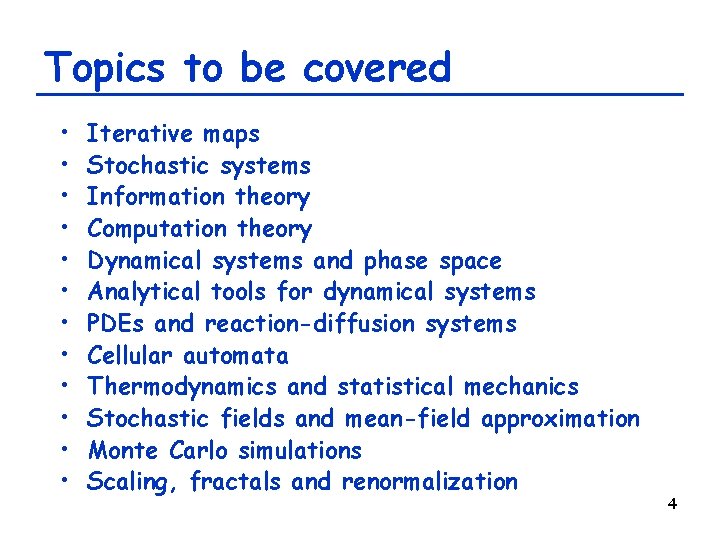
Topics to be covered • • • Iterative maps Stochastic systems Information theory Computation theory Dynamical systems and phase space Analytical tools for dynamical systems PDEs and reaction-diffusion systems Cellular automata Thermodynamics and statistical mechanics Stochastic fields and mean-field approximation Monte Carlo simulations Scaling, fractals and renormalization 4
Online resource • Course slides for the first two days are available at: http: //coco. binghamton. edu/NECSI/ Login name: necsi Password: com 3 sys. B 5
Course structure • Monday ~ Thursday – 9: 00 am~5: 00 pm: Lectures, discussions – 6: 00 pm~8: 00 pm: Group projects • Friday – 9: 00 am~12: 00 pm: Presentations (+ optional final exam) 6
Group projects • Presentation (~15 min. ) + 5 -page paper • Option 1: Original research – Conduct mathematical analysis of a model of complex systems (either existing or original) and report your findings • Option 2: Teaching analytical methods – Select some analytical method that is not covered in the classes, prepare teaching materials (including illustrative examples and questions) and deliver a lecture • Option 3: Problem sets (for individuals) – Go through several problems selected from different sections in textbook, write out your work and hand it in (presentation waived in this case) 7
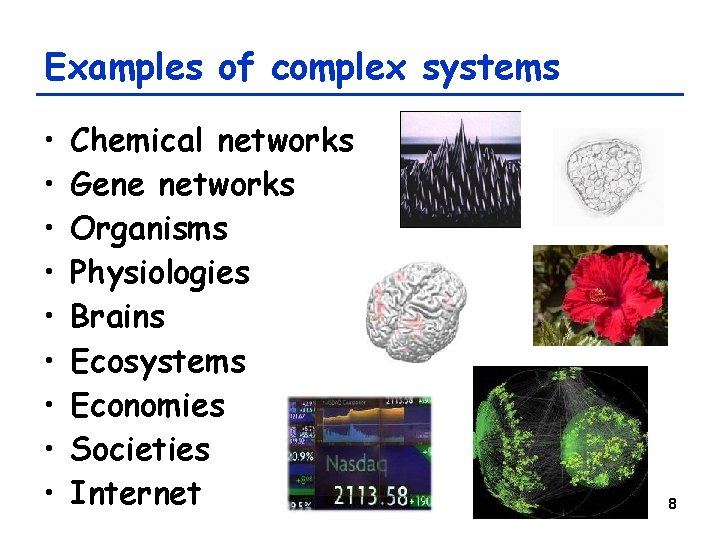
Examples of complex systems • • • Chemical networks Gene networks Organisms Physiologies Brains Ecosystems Economies Societies Internet 8
Several characteristics of complex systems • Networks of many components • Nonlinear interactions • Self-organization • Structure/behavior that is neither regular nor random • Emergent behavior 9
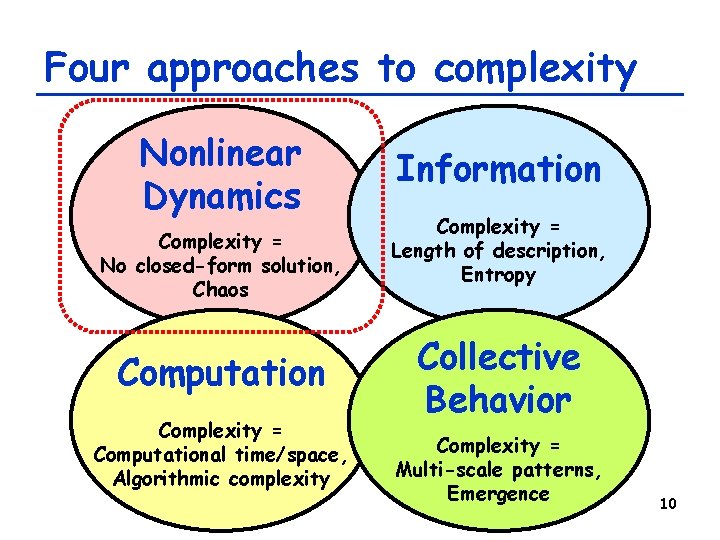
Four approaches to complexity Nonlinear Dynamics Complexity = No closed-form solution, Chaos Computation Complexity = Computational time/space, Algorithmic complexity Information Complexity = Length of description, Entropy Collective Behavior Complexity = Multi-scale patterns, Emergence 10
Dynamical Systems 11
Dynamical systems theory • Considers how systems autonomously change along time – Ranges from Newtonian mechanics to modern nonlinear dynamics theories – Thinks about underlying dynamical mechanisms, not just static properties of observations – Forms theoretical basis for most of complex systems studies 12
What is a dynamical system? • A system whose state is uniquely specified by a finite set of variables and whose behavior is uniquely determined by predetermined rules – – Simple population growth Simple pendulum swinging Motion of celestial bodies Behavior of two “rational” agents in a negotiation game 13
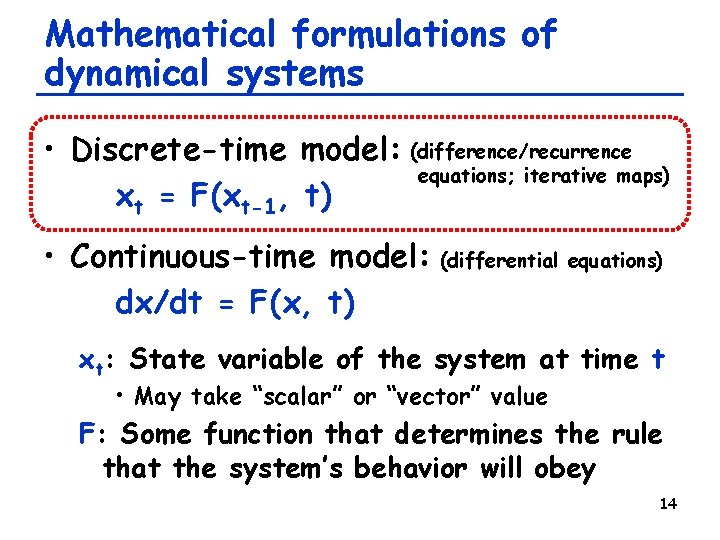
Mathematical formulations of dynamical systems • Discrete-time model: (difference/recurrence equations; iterative maps) xt = F(xt-1, t) • Continuous-time model: (differential equations) dx/dt = F(x, t) xt: State variable of the system at time t • May take “scalar” or “vector” value F: Some function that determines the rule that the system’s behavior will obey 14
Review of Difference Equations 15
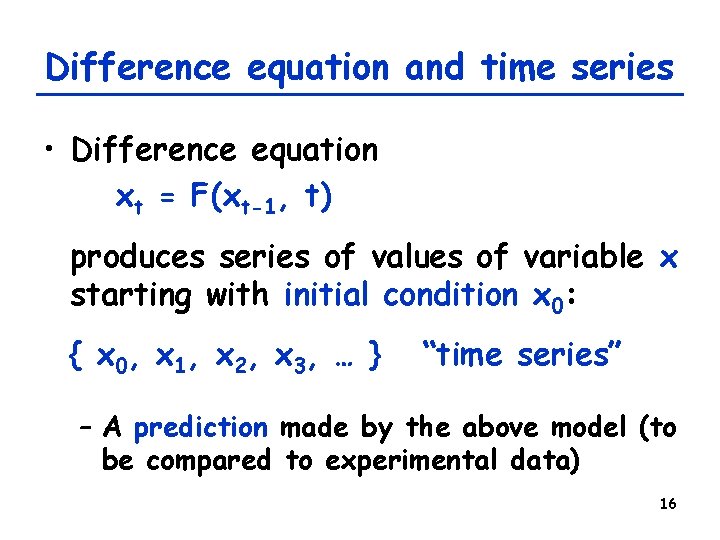
Difference equation and time series • Difference equation xt = F(xt-1, t) produces series of values of variable x starting with initial condition x 0: { x 0, x 1, x 2, x 3, … } “time series” – A prediction made by the above model (to be compared to experimental data) 16
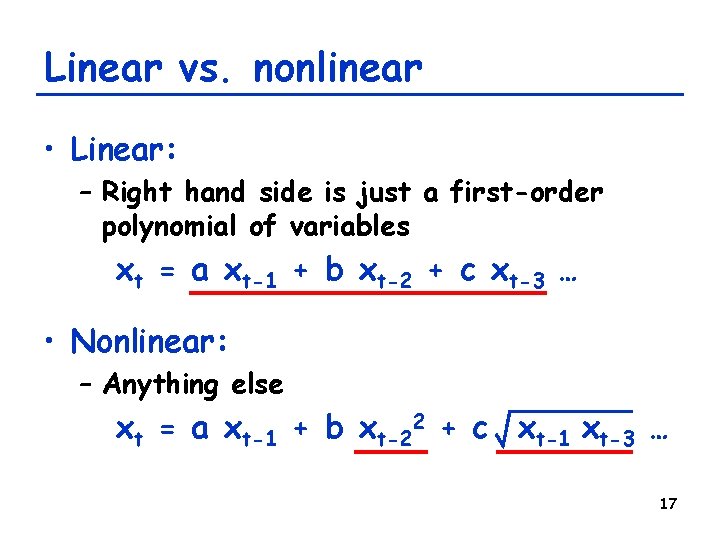
Linear vs. nonlinear • Linear: – Right hand side is just a first-order polynomial of variables xt = a xt-1 + b xt-2 + c xt-3 … • Nonlinear: – Anything else xt = a xt-1 + b xt-22 + c xt-1 xt-3 … 17
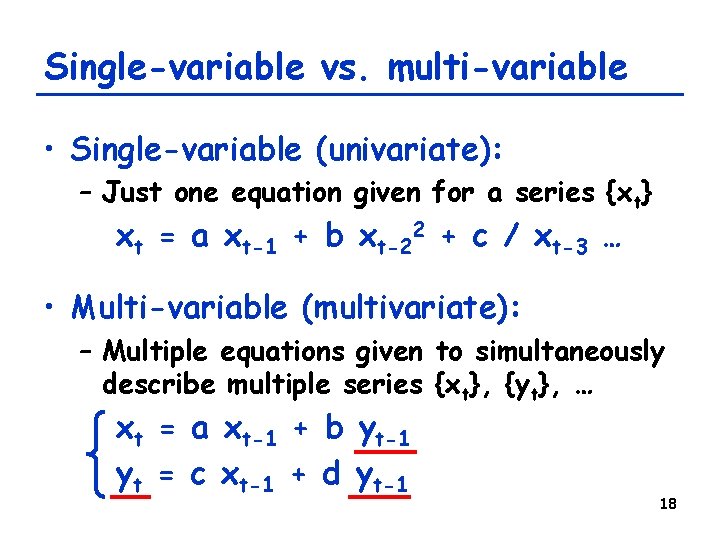
Single-variable vs. multi-variable • Single-variable (univariate): – Just one equation given for a series {xt} xt = a xt-1 + b xt-22 + c / xt-3 … • Multi-variable (multivariate): – Multiple equations given to simultaneously describe multiple series {xt}, {yt}, … xt = a xt-1 + b yt-1 yt = c xt-1 + d yt-1 18
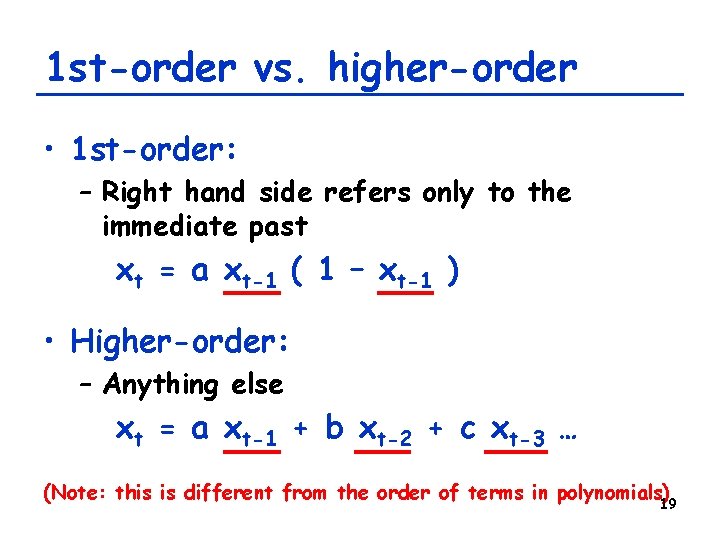
1 st-order vs. higher-order • 1 st-order: – Right hand side refers only to the immediate past xt = a xt-1 ( 1 – xt-1 ) • Higher-order: – Anything else xt = a xt-1 + b xt-2 + c xt-3 … (Note: this is different from the order of terms in polynomials) 19
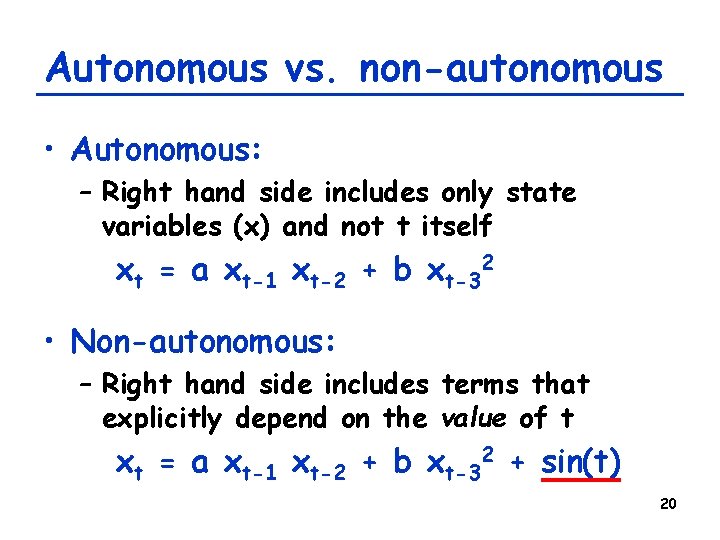
Autonomous vs. non-autonomous • Autonomous: – Right hand side includes only state variables (x) and not t itself xt = a xt-1 xt-2 + b xt-32 • Non-autonomous: – Right hand side includes terms that explicitly depend on the value of t xt = a xt-1 xt-2 + b xt-32 + sin(t) 20
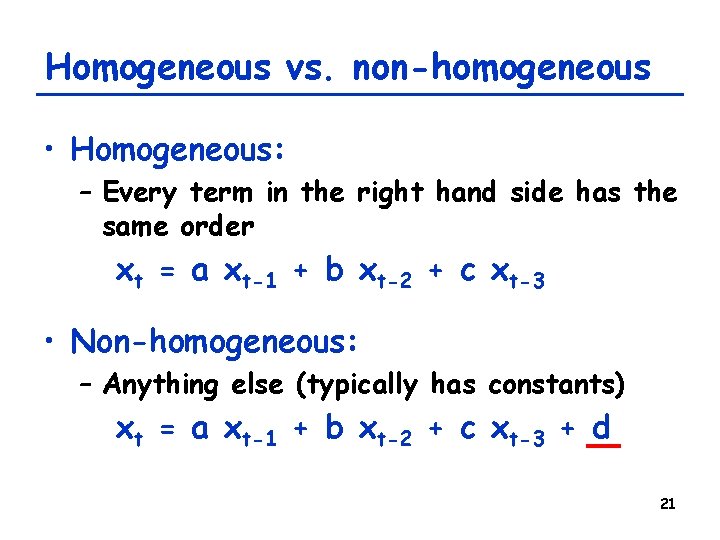
Homogeneous vs. non-homogeneous • Homogeneous: – Every term in the right hand side has the same order xt = a xt-1 + b xt-2 + c xt-3 • Non-homogeneous: – Anything else (typically has constants) xt = a xt-1 + b xt-2 + c xt-3 + d 21
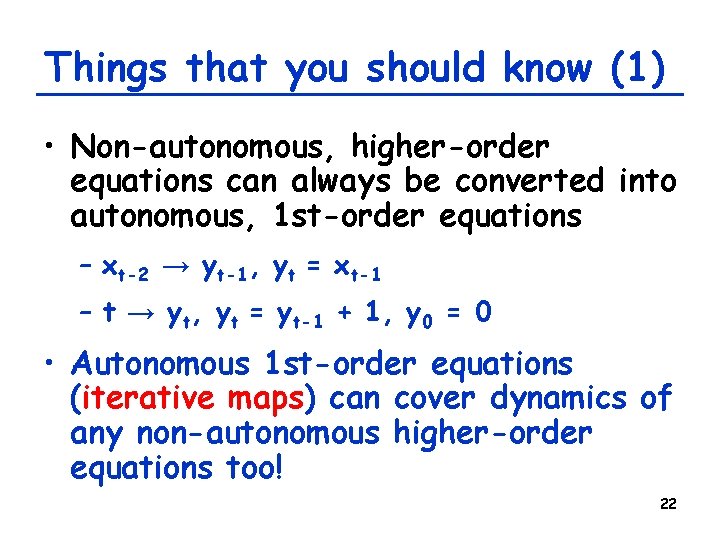
Things that you should know (1) • Non-autonomous, higher-order equations can always be converted into autonomous, 1 st-order equations – xt-2 → yt-1, yt = xt-1 – t → yt, yt = yt-1 + 1, y 0 = 0 • Autonomous 1 st-order equations (iterative maps) can cover dynamics of any non-autonomous higher-order equations too! 22
Things that you should know (2) • Linear equations – are analytically solvable – show either equilibrium, exponential growth/decay, periodic oscillation (with >1 variables), or their combination • Nonlinear equations – may show more complex behaviors – do not have analytical solutions in general 23
Iterative Maps 24
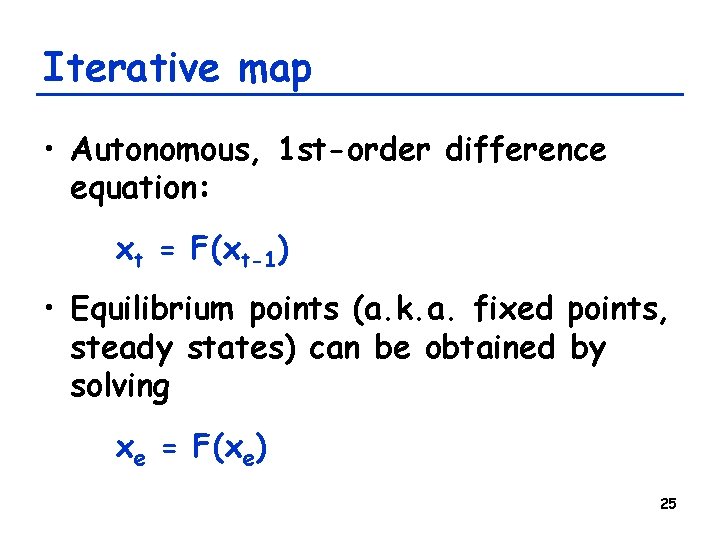
Iterative map • Autonomous, 1 st-order difference equation: xt = F(xt-1) • Equilibrium points (a. k. a. fixed points, steady states) can be obtained by solving xe = F(xe) 25
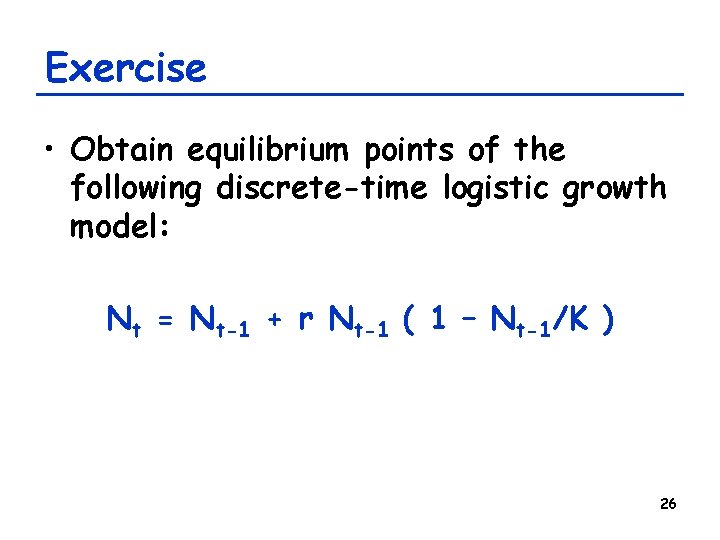
Exercise • Obtain equilibrium points of the following discrete-time logistic growth model: Nt = Nt-1 + r Nt-1 ( 1 – Nt-1/K ) 26
Cobweb plot • A visual tool to study the behavior of 1 -D iterative maps • Take xt-1 and xt for two axes • Draw the map of interest (xt=F(xt-1)) and the “xt=xt-1” reference line – They will intersect at equilibrium points • Trace how time series develop from an initial value by jumping between these two curves 27
Exercise • Draw a cobweb plot for each of the following models: xt = xt-1 + 0. 1, x 0 = 0. 1 xt = 1. 1 xt-1 , x 0 = 0. 1 28
Exercise • Draw a cobweb plot of the logistic growth model with r=1, K=1, N 0=0. 1: Nt = Nt-1 + r Nt-1 ( 1 – Nt-1/K ) 29
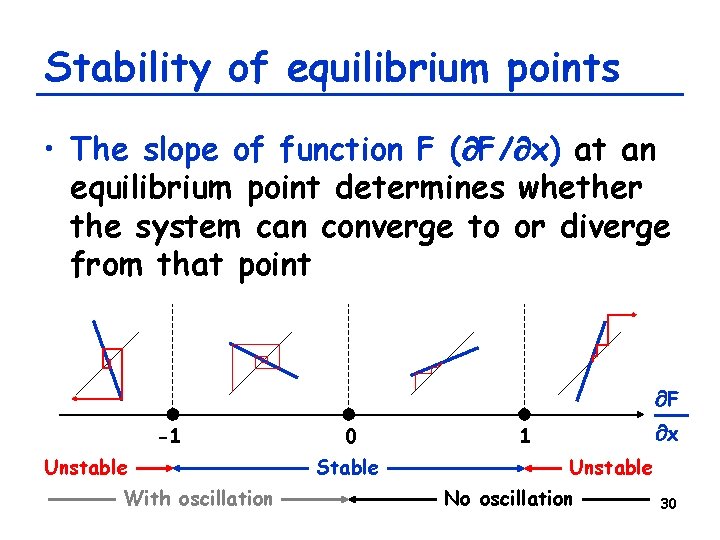
Stability of equilibrium points • The slope of function F ( F/ x) at an equilibrium point determines whether the system can converge to or diverge from that point -1 Unstable With oscillation 0 Stable F x 1 Unstable No oscillation 30
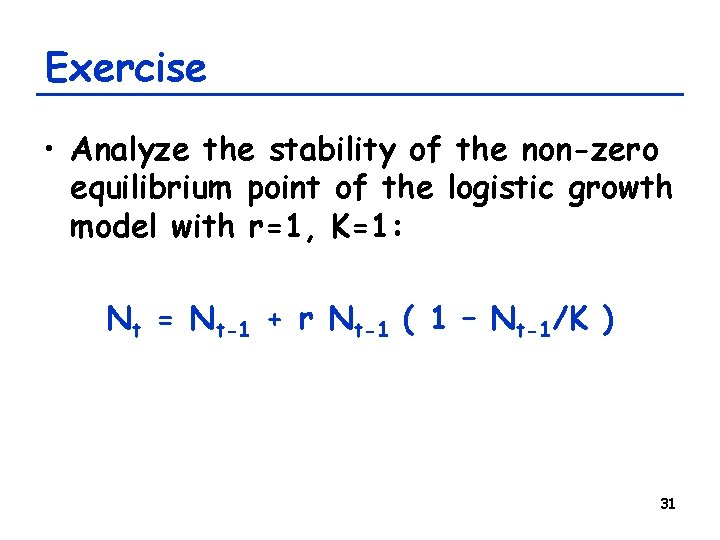
Exercise • Analyze the stability of the non-zero equilibrium point of the logistic growth model with r=1, K=1: Nt = Nt-1 + r Nt-1 ( 1 – Nt-1/K ) 31
Logistic Map and Chaos 32
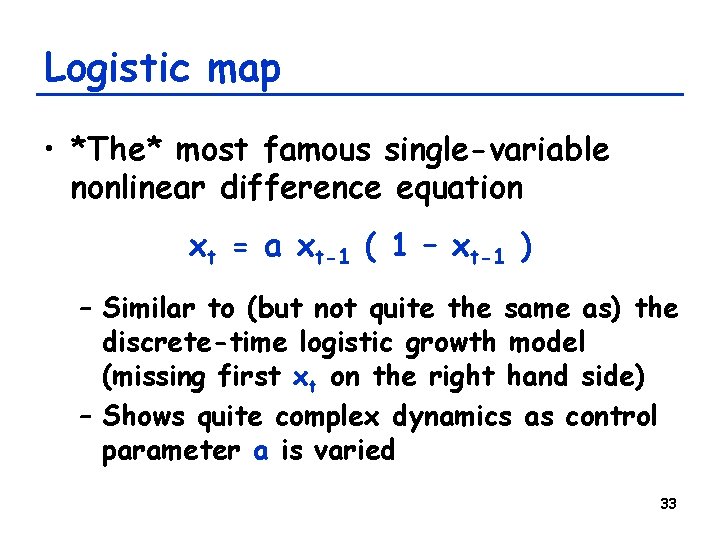
Logistic map • *The* most famous single-variable nonlinear difference equation xt = a xt-1 ( 1 – xt-1 ) – Similar to (but not quite the same as) the discrete-time logistic growth model (missing first xt on the right hand side) – Shows quite complex dynamics as control parameter a is varied 33
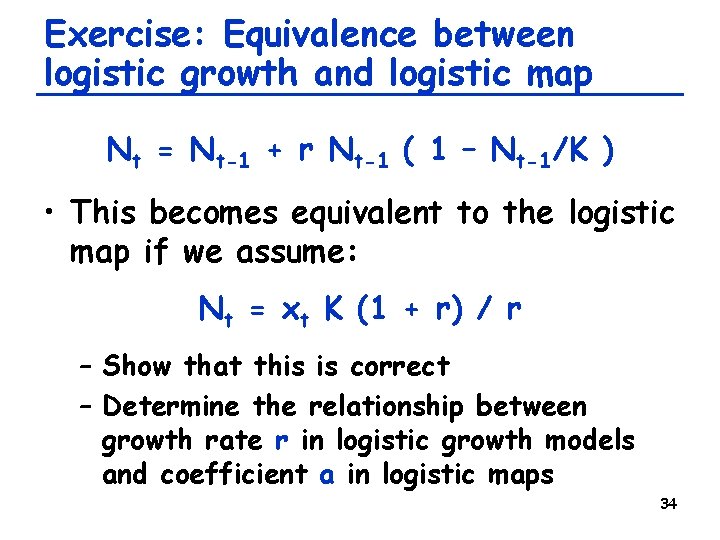
Exercise: Equivalence between logistic growth and logistic map Nt = Nt-1 + r Nt-1 ( 1 – Nt-1/K ) • This becomes equivalent to the logistic map if we assume: Nt = xt K (1 + r) / r – Show that this is correct – Determine the relationship between growth rate r in logistic growth models and coefficient a in logistic maps 34
Exercise • Draw cobweb plots of the logistic map for a = 0. 5, 1. 5 and 2. 5 – Try a couple of different initial conditions for each case 35
Period-doubling bifurcations • In discrete-time models, “perioddoubling” bifurcations may occur when F/ x(x=xe) = -1 – The equilibrium point xe is about to destabilize in an oscillatory manner – Also possible in multi-dimensional continuous-time models (which will not be covered in class) 36
Exercise • Obtain the equilibrium points of the logistic map as a function of a: xt = F(xt-1) = a xt-1 (1 – xt-1) • Examine their stability and its dependence on the value of a 37
Summary of stability analysis Range Equil. of a 0 < a < 1 points x = 0 Stable x = 1 -1/a (Doesn’t exist within positive range) 1 < a < 3 3 < a Unstable Stable Impossible if this was a continuous-time model Unstable 38
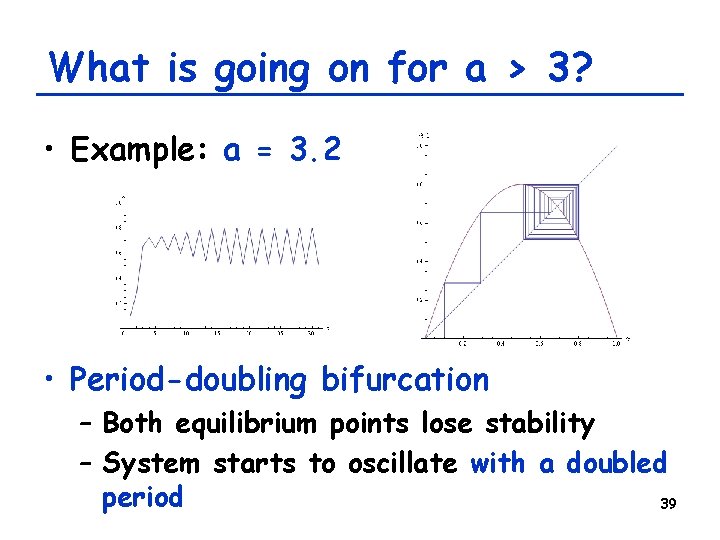
What is going on for a > 3? • Example: a = 3. 2 • Period-doubling bifurcation – Both equilibrium points lose stability – System starts to oscillate with a doubled period 39
Exercise: Stability analysis of F 2(x) • That the system flips back and forth between two points means that they should be equilibrium points of a composite function F 2(x) (= F(F(x)) ) • Obtain the equilibrium points of F 2(x) and examine their stability and its dependence on the value of a • What is happening at a=3? 40
General condition for stability of periodic trajectories • Consider a periodic trajectory: { x 0, x 1, x 2, …, xt } = { x 0, F(x 0), F(F(x 0)), … Ft(x 0) } (xt = x 0) • This trajectory is stable if & only if: | Ft/ x(x=x 0) | < 1, or | F/ x(x=x 0) F/ x(x=x 1) … F/ x(x=xt-1) | < 1 41
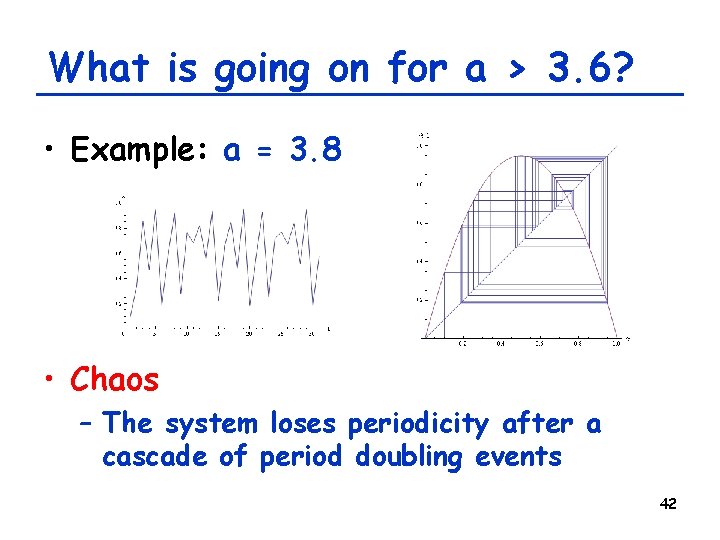
What is going on for a > 3. 6? • Example: a = 3. 8 • Chaos – The system loses periodicity after a cascade of period doubling events 42
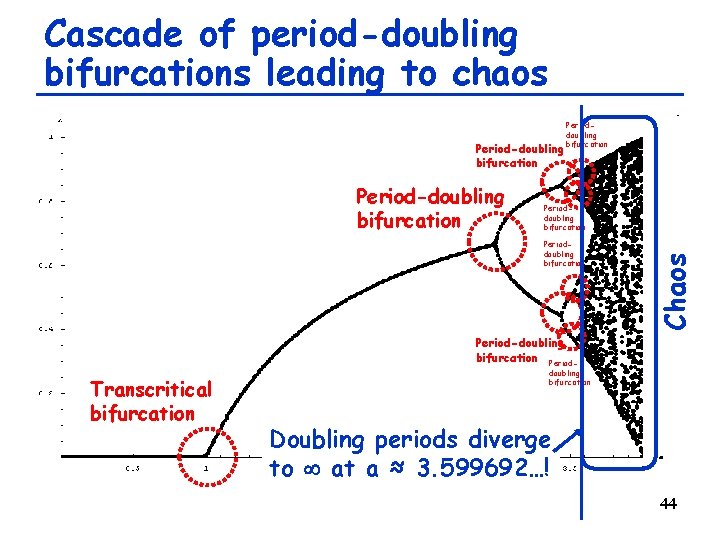
Drawing bifurcation diagrams using numerical results • For systems with periodic (or chaotic) long-term behavior, it is useful to draw a bifurcation diagram using numerical simulation results instead of analytical results – Plot actual system states sampled after a long period of time has passed – Can capture period-doubling bifurcation by a “set” of points 43
Cascade of period-doubling bifurcations leading to chaos Period-doubling bifurcation Perioddoubling bifurcation Chaos Period-doubling bifurcation Period- Transcritical bifurcation doubling bifurcation Doubling periods diverge to at a ≈ 3. 599692…! 44
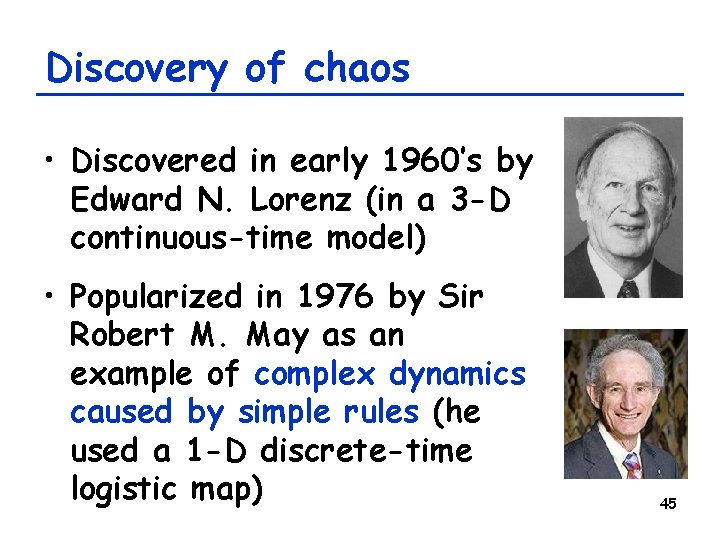
Discovery of chaos • Discovered in early 1960’s by Edward N. Lorenz (in a 3 -D continuous-time model) • Popularized in 1976 by Sir Robert M. May as an example of complex dynamics caused by simple rules (he used a 1 -D discrete-time logistic map) 45
Chaos in dynamical systems • A long-term behavior of a dynamical system that never falls in any static or periodic trajectories • Looks like a random fluctuation, but still occurs in completely deterministic simple systems • Exhibits sensitivity to initial conditions • Can be found everywhere 46
Reinterpreting chaos • Where a period diverges to infinity – Periodic behavior with infinitely long periods means “aperiodic” behavior • Where (almost) no periodic trajectories are stable – No fixed points or periodic trajectories you can sit in (you have to always deviate from your past course!!) 47
Exercise • Draw a more detailed bifurcation diagram for the chaotic regime and see how those chaotic trajectories are structured there • Can you find any “order” in chaos? 48
Exercise • What happens if you try plotting cobweb plots and bifurcation diagrams of the logistic map for negative a? • Determine the range of a where chaotic dynamics occurs 49
Characteristics of Chaos 50
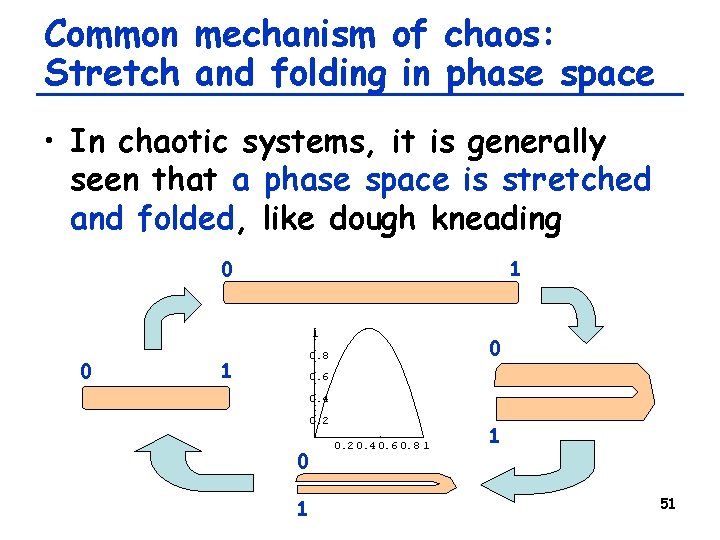
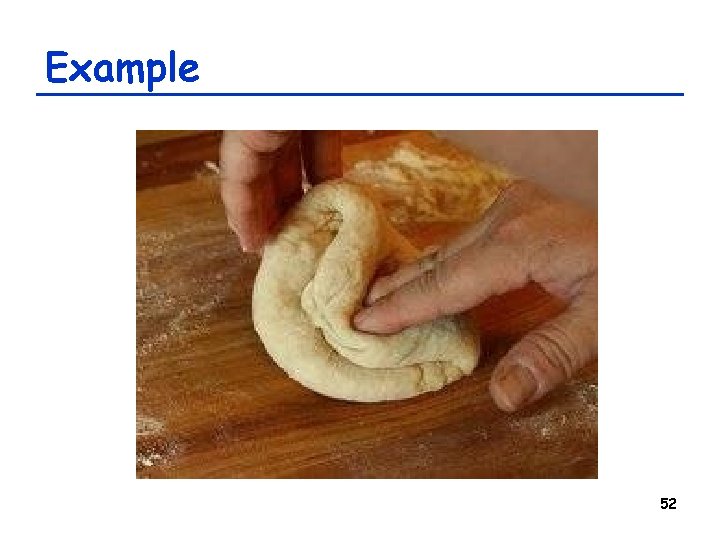
Common mechanism of chaos: Stretch and folding in phase space • In chaotic systems, it is generally seen that a phase space is stretched and folded, like dough kneading 0 1 1 0 0. 8 0. 6 0. 4 0. 2 0 1 0. 2 0. 4 0. 6 0. 8 1 1 51
Example 52
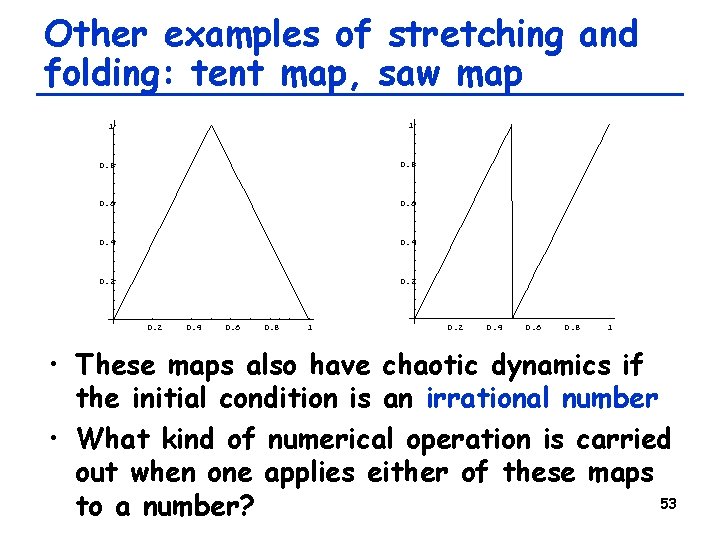
Other examples of stretching and folding: tent map, saw map 1 1 0. 8 0. 6 0. 4 0. 2 0. 4 0. 6 0. 8 1 • These maps also have chaotic dynamics if the initial condition is an irrational number • What kind of numerical operation is carried out when one applies either of these maps 53 to a number?
Sensitivity to initial conditions • Stretching and folding mechanisms always dig out microscale details hidden in a system’s state and expand them to macroscale visible levels • This causes chaotic systems very sensitive to initial conditions • Think about where a grain in a dough will eventually move during kneading 54
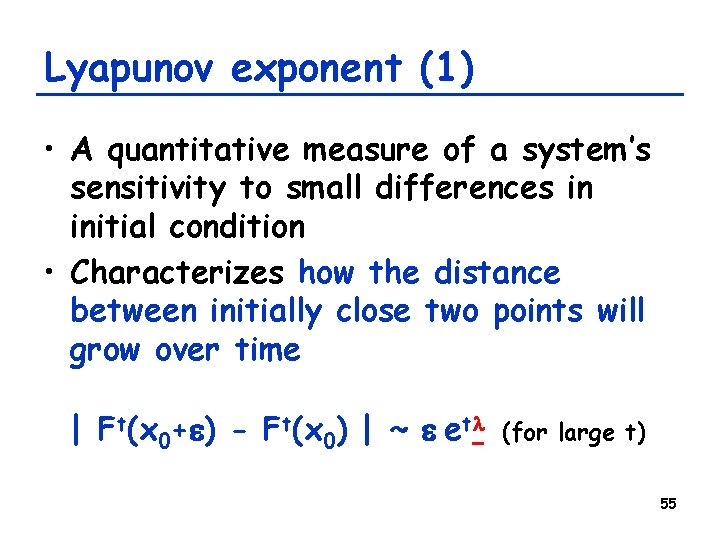
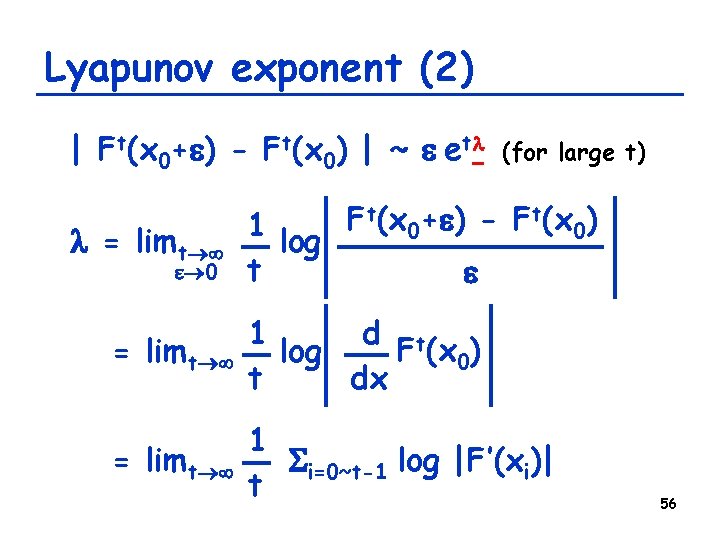
Lyapunov exponent (1) • A quantitative measure of a system’s sensitivity to small differences in initial condition • Characterizes how the distance between initially close two points will grow over time | Ft(x 0+e) - Ft(x 0) | ~ e etl (for large t) 55
Lyapunov exponent (2) | Ft(x 0+e) - Ft(x 0) | ~ e etl l = limt e 0 (for large t) Ft(x 0+e) - Ft(x 0) 1 log t e = limt d t 1 F (x 0) log dx t = limt 1 Si=0~t-1 log |F’(xi)| t 56
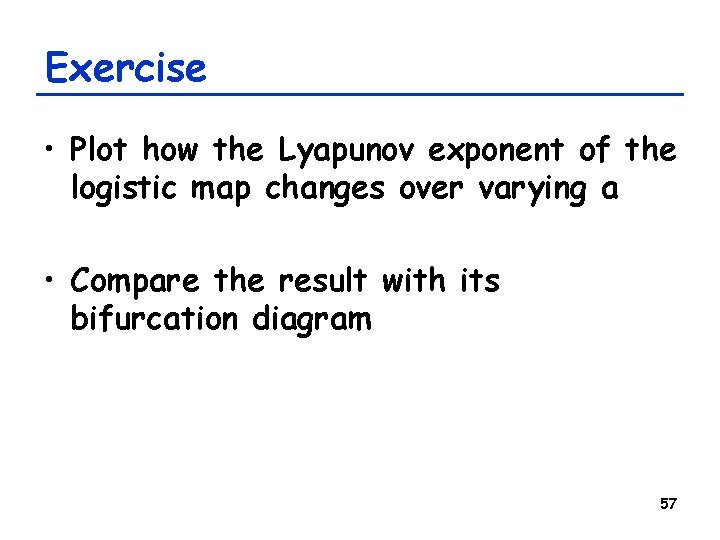
Exercise • Plot how the Lyapunov exponent of the logistic map changes over varying a • Compare the result with its bifurcation diagram 57
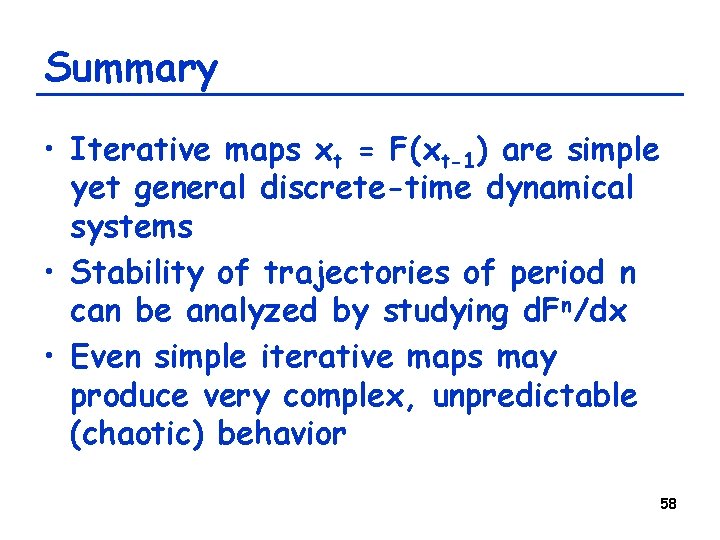
Summary • Iterative maps xt = F(xt-1) are simple yet general discrete-time dynamical systems • Stability of trajectories of period n can be analyzed by studying d. Fn/dx • Even simple iterative maps may produce very complex, unpredictable (chaotic) behavior 58