
NECSI Summer School 2008 Week 2 Complex Systems
- Slides: 23
NECSI Summer School 2008 Week 2: Complex Systems Modeling and Networks Network Models Hiroki Sayama sayama@binghamton. edu
Models of complex systems • Cellular automata – Parts are connected in a regular grid • Agent-based models – Parts can move in a continuous space and interact based on physical proximity • Network models – Parts can be connected arbitrarily, not restricted by their spatial locations • Logical/social relationships among parts 2
Representation of Networks 3
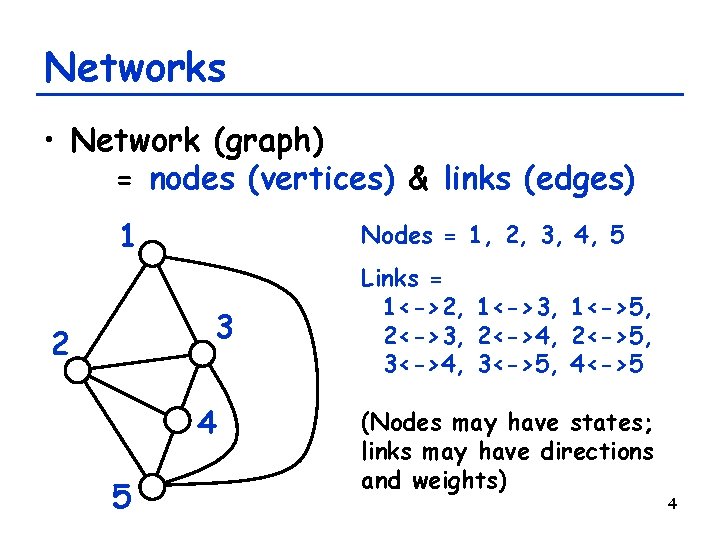
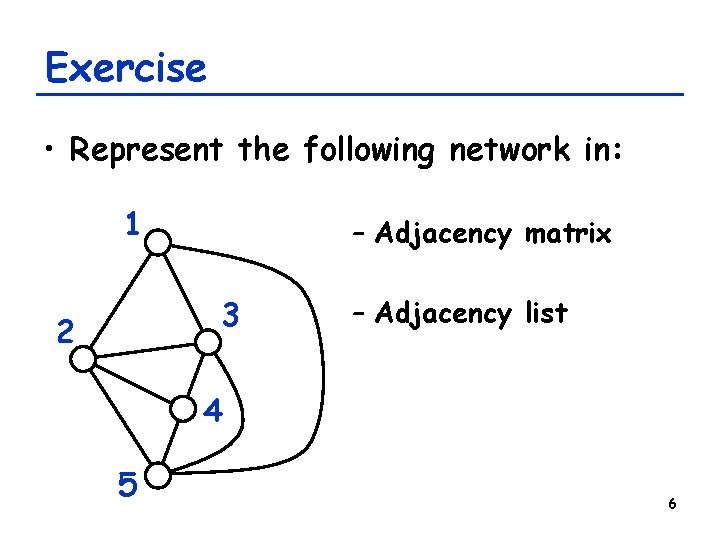
Networks • Network (graph) = nodes (vertices) & links (edges) 1 Nodes = 1, 2, 3, 4, 5 3 2 4 5 Links = 1<->2, 1<->3, 1<->5, 2<->3, 2<->4, 2<->5, 3<->4, 3<->5, 4<->5 (Nodes may have states; links may have directions and weights) 4
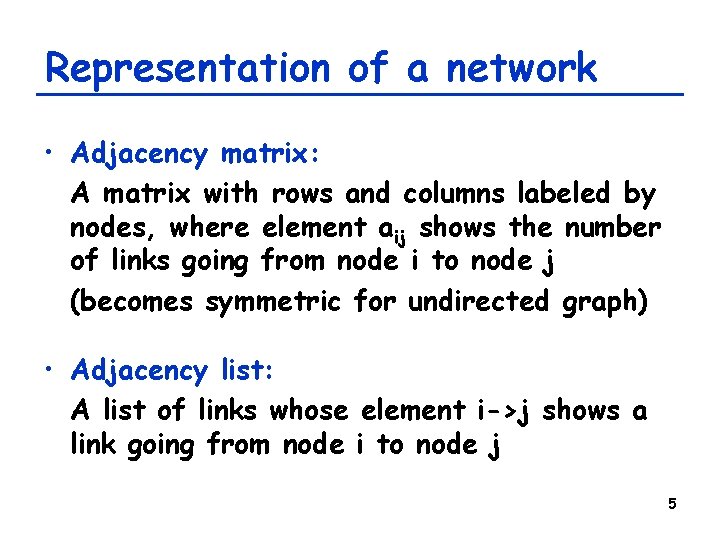
Representation of a network • Adjacency matrix: A matrix with rows and columns labeled by nodes, where element aij shows the number of links going from node i to node j (becomes symmetric for undirected graph) • Adjacency list: A list of links whose element i->j shows a link going from node i to node j 5
Exercise • Represent the following network in: 1 – Adjacency matrix 3 2 – Adjacency list 4 5 6
Measuring Topological Properties of Networks 7
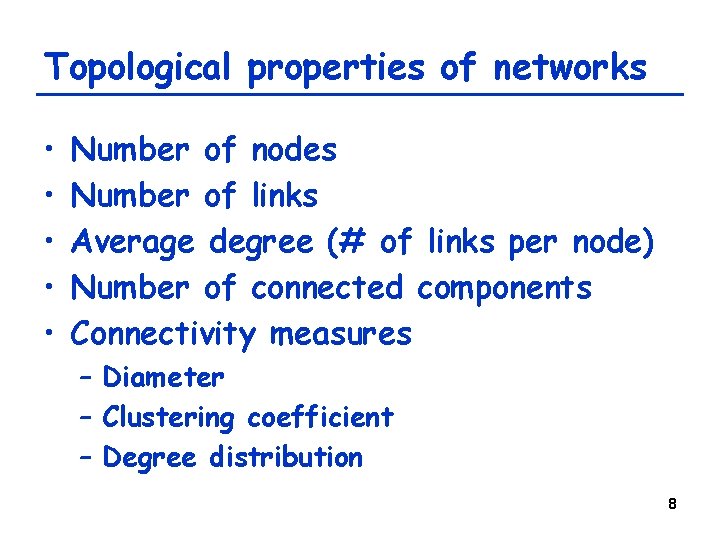
Topological properties of networks • • • Number of nodes Number of links Average degree (# of links per node) Number of connected components Connectivity measures – Diameter – Clustering coefficient – Degree distribution 8
Diameter • In mathematics: Maximum of shortest path lengths between pairs of nodes • In recent network theory: Average shortest path lengths • Characterizes how large the world being modeled is – A small diameter implies that the network is well connected globally 9
Clustering coefficient • For each node: – Let n be the number of its neighbor nodes – Let m be the number of links among the k neighbors – Calculate c = m / (n choose 2) Then C = <c> (the average of c) • C indicates the average probability for two of one’s friends to be friends too – A large C implies that the network is well connected locally to form a cluster 10
Degree distribution P(k) = # of nodes with degree k • Gives a rough profile of how the connectivity is distributed within the network Sk P(k) = total number of nodes 11
Several Well-Known Network Models 12
Erdös-Rényi random network model • N nodes are provided from the beginning • For each of the N(N-1)/2 pairs of nodes, a link will be created independently with probability p 13
Exercise • Create and plot several ER random networks using Network. X • Measure their properties • Study how the number of connected components and the diameter of random networks change with increasing link probability (for the same number of nodes, e. g. n=100) 14
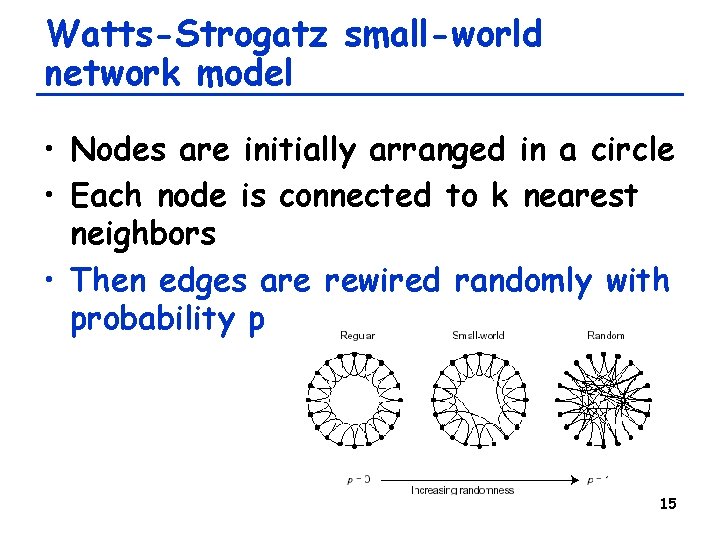
Watts-Strogatz small-world network model • Nodes are initially arranged in a circle • Each node is connected to k nearest neighbors • Then edges are rewired randomly with probability p 15
Exercise • Create and plot several WS smallworld networks using Network. X • Measure their properties • Study how the diameter and the clustering coefficient of WS networks change with increasing rewiring probability (for the same number of nodes, e. g. n=100) 16
Barabási-Albert scale-free network model • Nodes are sequentially added to the network one by one • When adding a new node, it is connected to m nodes chosen from the existing network • Probability for a node to be chosen is proportional to its degree 17
Exercise • Plot degree distributions of several different networks described here (use large number of nodes, e. g. 10, 000) • Compare their properties 18
Dynamics on Complex Networks 19
Dynamics on complex networks • Dynamical state changes considered on complex network topologies – Regulatory dynamics on gene/protein networks – Population dynamics on ecological networks – Disease infection on social networks – Information/culture propagation on organizational/social networks 20
Example: Epidemics on networks • Initially, a small fraction of nodes are infected by a disease • An infected node will recover and become susceptible with probability pr • If a susceptible node has an infected neighbor, it will be infected with probability pi (per infected neighbor) • Does the disease stay in the network? 21
Exercise • Study the effects of infection/ recovery probabilities on the fixation of a disease on a random social network – In what condition will the disease remain within society? – In what condition will it go away? – Is the transition smooth, or sharp? 22
Exercise • Do the same experiments with WS small-world networks and BA scalefree networks • Compare their properties 23