
NCU Electrical Engineering Electronic Design Automation Laboratory N
NCU Electrical Engineering Electronic Design Automation Laboratory N a tio n a l C e n tr a l Engineering Electronic Design Automation U n. Department i v e r s ofi Etlectrical y Laboratory High-Level Power/Noise Estimation of VLSI Designs 劉建男 助理教授 Prof. Chien-Nan (Jimmy) Liu 國立中央大學 電機 程學系 Dept. of EE, National Central Univ. Email: jimmy@ee. ncu. edu. tw TEL: 03 -4227151 ext: 34534 http: //www. ee. ncu. edu. tw/~jimmy Chien-Nan Liu

NCU Electrical Engineering Electronic Design Automation Laboratory Who am I ? ? ? l Education: l l l 1996/9 -2001/5: MS & PHD of National Chiao Tung Univ, Taiwan (advisor: Prof. Jing-Yang Jou) 1992/9 -1996/6: BS of Dept. of EE, NCTU, Taiwan Join Dept. of EE, Nat’l Central Univ. after graduate (from 2001/8) Group members: 9 Ph. D, 11 master Research interests: VLSI/CAD on Ø Ø Functional verification Verification of system-level integration Behavioral modeling of digital/analog circuits High-level power/current modeling Chien-Nan Liu

NCU Electrical Engineering Electronic Design Automation Laboratory What is CAD ? CAD = Computer-Aided Design Ø Exist everywhere in the whole design flow EDA = Electronic Design Automation Ø CAD for electronic industry Typically, more than 50% design time is elapsed on running CAD tools CAD research falls between design (hardware) and programming (software) Ø Require knowledge from both parts Methodology (thinking) + program (implementation) Chien-Nan Liu
NCU Electrical Engineering Electronic Design Automation Laboratory Outline Introduction High-Level Power Modeling High-Level Current Waveform Modeling Conclusion Chien-Nan Liu
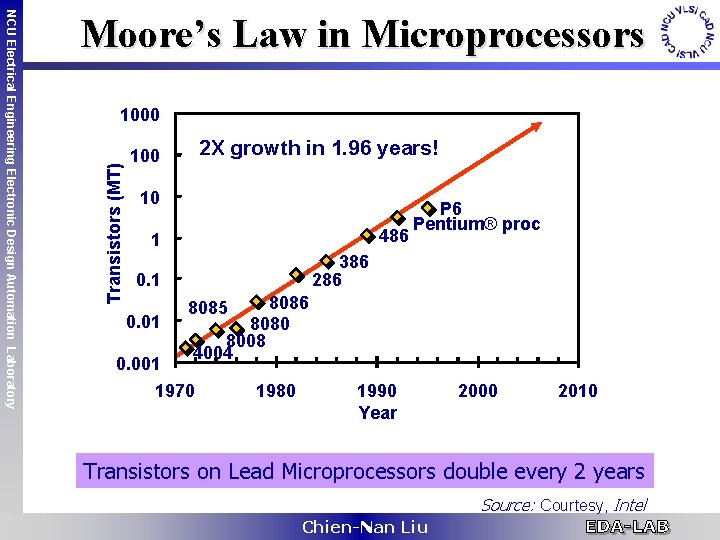
1000 Transistors (MT) NCU Electrical Engineering Electronic Design Automation Laboratory Moore’s Law in Microprocessors 2 X growth in 1. 96 years! 100 10 486 1 386 286 0. 1 0. 01 P 6 Pentium® proc 8086 8080 8008 4004 8085 0. 001 1970 1980 1990 Year 2000 2010 Transistors on Lead Microprocessors double every 2 years Source: Courtesy, Intel Chien-Nan Liu
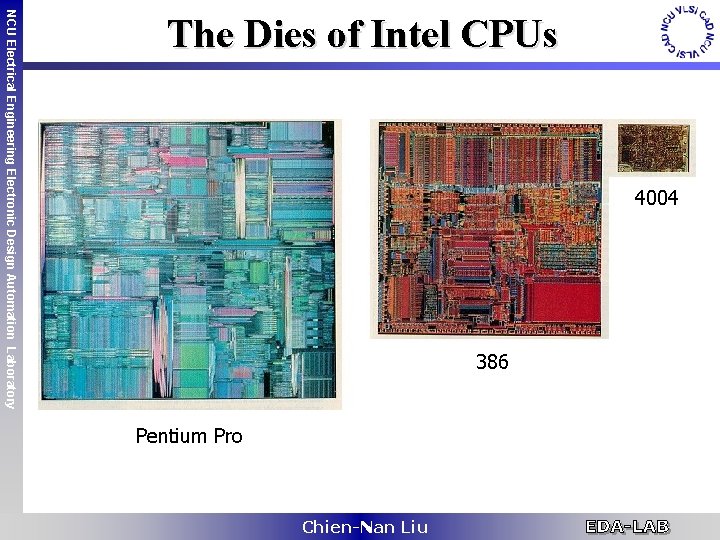
4004 386 NCU Electrical Engineering Electronic Design Automation Laboratory The Dies of Intel CPUs Pentium Pro Chien-Nan Liu
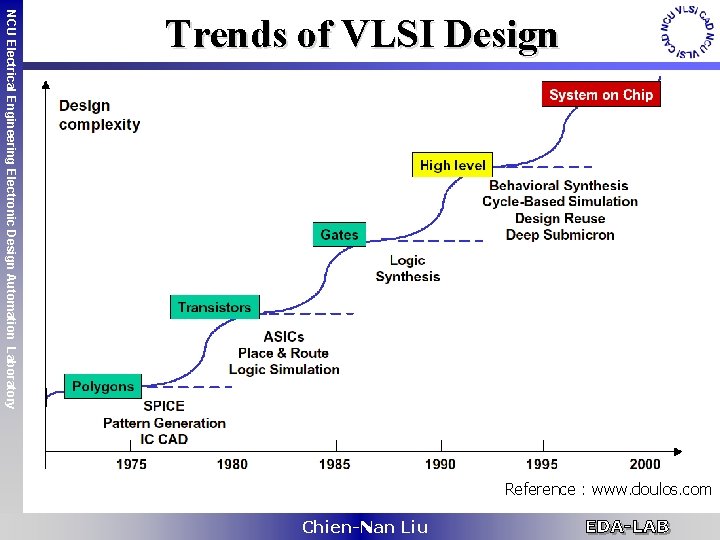
NCU Electrical Engineering Electronic Design Automation Laboratory Trends of VLSI Design Reference : www. doulos. com Chien-Nan Liu
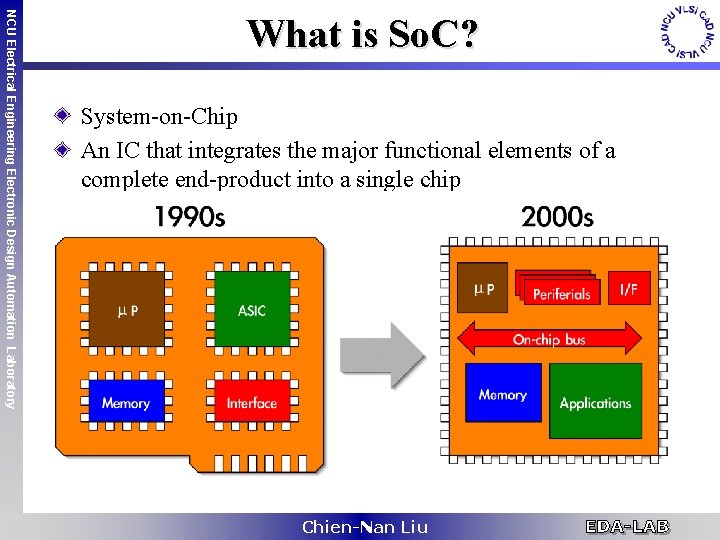
NCU Electrical Engineering Electronic Design Automation Laboratory What is So. C? System-on-Chip An IC that integrates the major functional elements of a complete end-product into a single chip Chien-Nan Liu
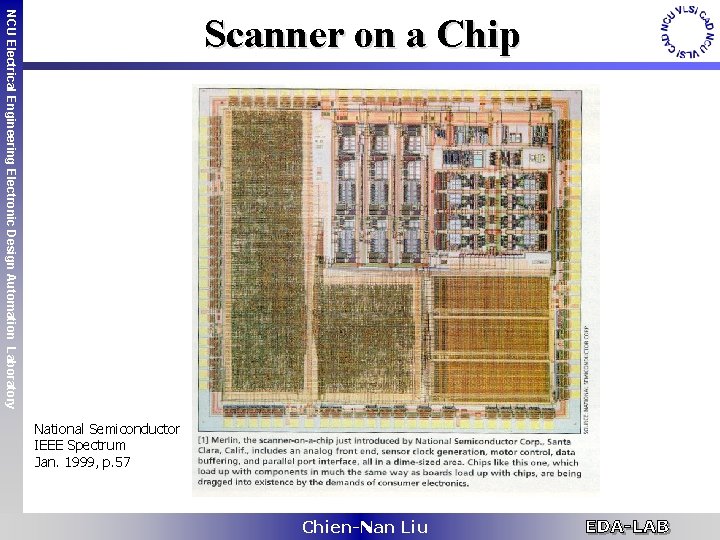
NCU Electrical Engineering Electronic Design Automation Laboratory Scanner on a Chip National Semiconductor IEEE Spectrum Jan. 1999, p. 57 Chien-Nan Liu
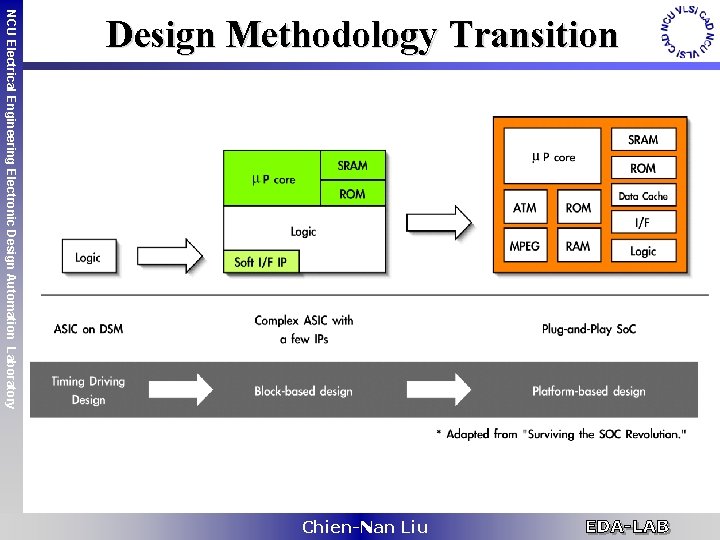
NCU Electrical Engineering Electronic Design Automation Laboratory Design Methodology Transition Chien-Nan Liu
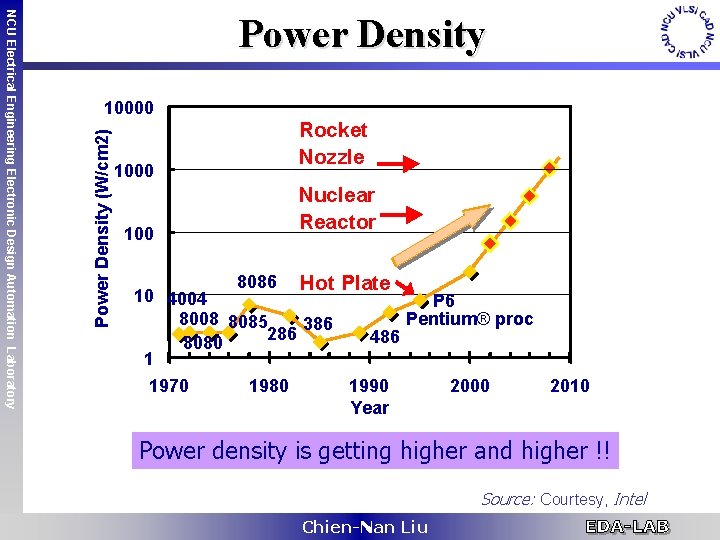
10000 Power Density (W/cm 2) NCU Electrical Engineering Electronic Design Automation Laboratory Power Density 1000 100 Rocket Nozzle Nuclear Reactor 8086 Hot Plate 10 4004 P 6 8008 8085 Pentium® proc 386 286 486 8080 1 1970 1980 1990 2000 2010 Year Power density is getting higher and higher !! Source: Courtesy, Intel Chien-Nan Liu
NCU Electrical Engineering Electronic Design Automation Laboratory Why Power Estimation ? Design space has been moved from 2 -D (Area/Delay) to 3 -D (Area-Delay-Power) Objectives Ø Verify the power dissipation requirements Ø Can be used during the circuit, logic and high-level synthesis to make trade-off between power and other design parameters • Area, performance, noise margin, … Power estimation tools are essential Ø Exploit the potential to reduce power by design techniques • An analysis of the expected power dissipation of a particular design alternative has to be made Ø Identify other power related design problems • Reliability, Hot spot detection, Electromigration, Voltage drops, Package selection Chien-Nan Liu
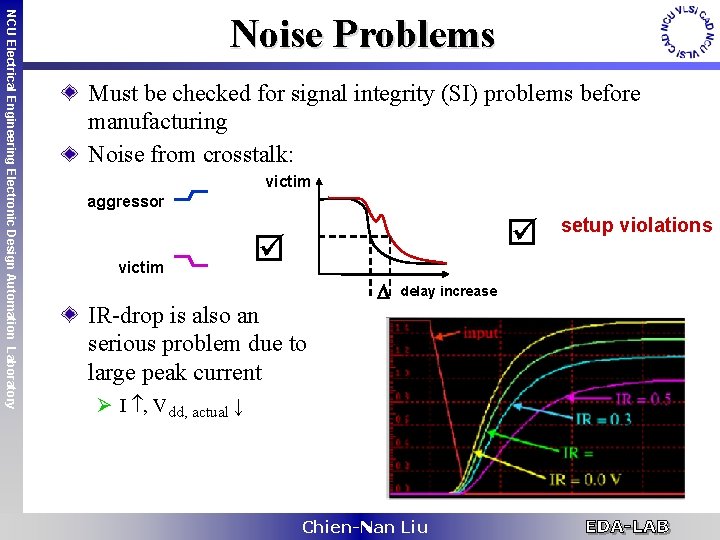
NCU Electrical Engineering Electronic Design Automation Laboratory Noise Problems Must be checked for signal integrity (SI) problems before manufacturing Noise from crosstalk: victim aggressor victim IR-drop is also an serious problem due to large peak current delay increase Ø I , Vdd, actual ↓ Chien-Nan Liu setup violations
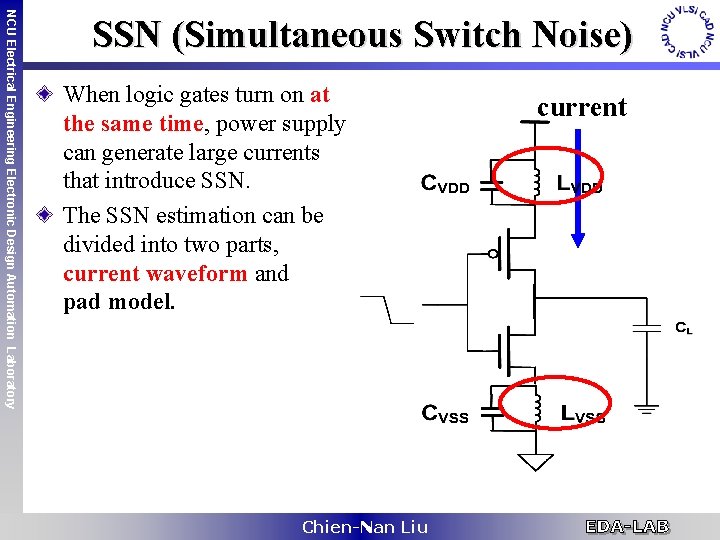
NCU Electrical Engineering Electronic Design Automation Laboratory SSN (Simultaneous Switch Noise) When logic gates turn on at the same time, power supply can generate large currents that introduce SSN. The SSN estimation can be divided into two parts, current waveform and pad model. Chien-Nan Liu current
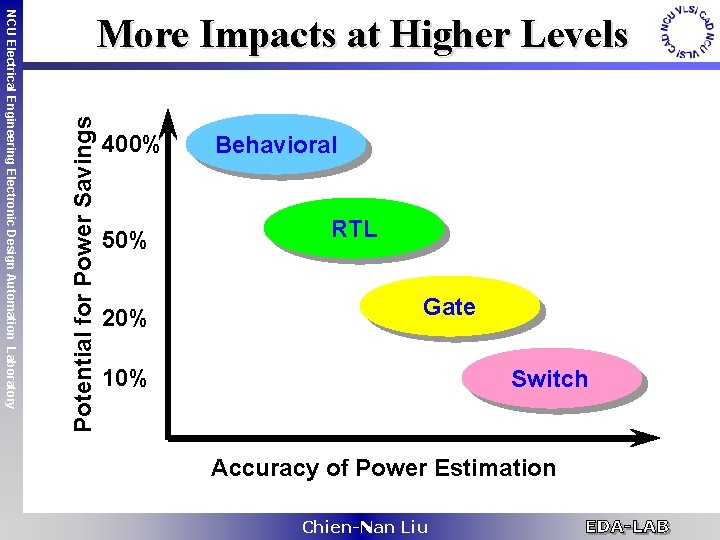
Potential for Power Savings NCU Electrical Engineering Electronic Design Automation Laboratory More Impacts at Higher Levels 400% 50% 20% Behavioral RTL Gate 10% Switch Accuracy of Power Estimation Chien-Nan Liu
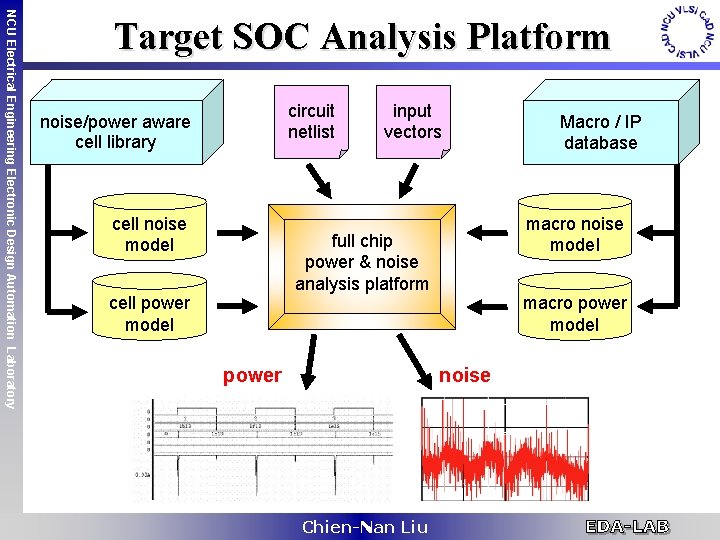
NCU Electrical Engineering Electronic Design Automation Laboratory Target SOC Analysis Platform circuit netlist noise/power aware cell library cell noise model input vectors macro noise model full chip power & noise analysis platform cell power model power macro power model noise Chien-Nan Liu Macro / IP database
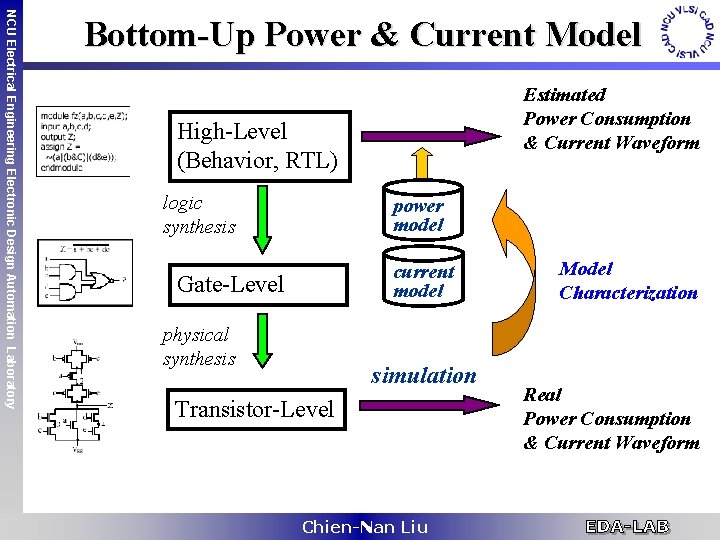
NCU Electrical Engineering Electronic Design Automation Laboratory Bottom-Up Power & Current Model Estimated Power Consumption & Current Waveform High-Level (Behavior, RTL) logic synthesis power model current model Gate-Level physical synthesis simulation Transistor-Level Chien-Nan Liu Model Characterization Real Power Consumption & Current Waveform
NCU Electrical Engineering Electronic Design Automation Laboratory Outline Introduction High-Level Power Modeling Ø Traditional Power Modeling Ø Our Neural Power Model High-Level Current Waveform Modeling Conclusion Chien-Nan Liu
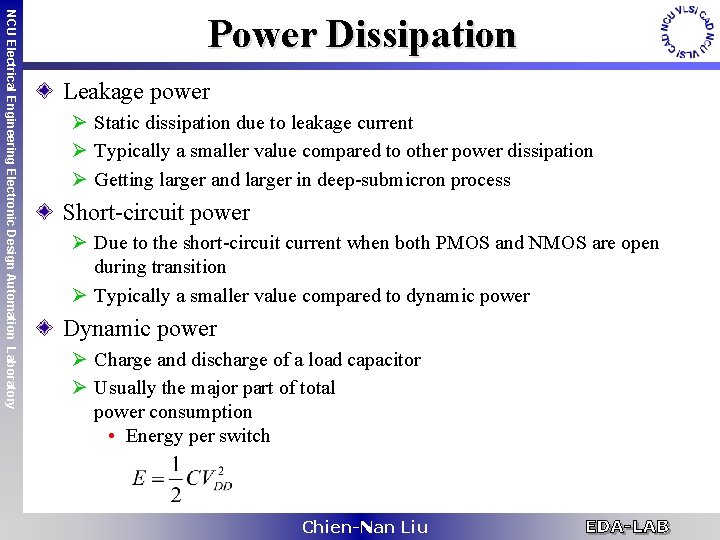
NCU Electrical Engineering Electronic Design Automation Laboratory Power Dissipation Leakage power Ø Static dissipation due to leakage current Ø Typically a smaller value compared to other power dissipation Ø Getting larger and larger in deep-submicron process Short-circuit power Ø Due to the short-circuit current when both PMOS and NMOS are open during transition Ø Typically a smaller value compared to dynamic power Dynamic power Ø Charge and discharge of a load capacitor Ø Usually the major part of total power consumption • Energy per switch Chien-Nan Liu
NCU Electrical Engineering Electronic Design Automation Laboratory Traditional Power Modeling (1/2) Look-Up Table (LUT) is the most popular method Ø Straight-forward idea Ø Easy to use Number of possible input transitions for an n-input combinational circuit is 22 n Ø Impractical to stored the whole input transitions in a table Ø Solution • Use probability measurements liked P(xi), D(xi), etc. … P: signal probability D: transition density Chien-Nan Liu
NCU Electrical Engineering Electronic Design Automation Laboratory Traditional Power Modeling (2/2) Some approaches use equations instead of LUT Power = C 1*Pin+C 2*Din+C 3*Dout+C 4*Pin*Din+ … Ø Use linear regression to find out the parameters that form the equation Ø Less data to be recorded than LUT Ø Hard to use only a single equation to describe the irregular power distribution curve To improve the accuracy, they may Ø Increase the order of the power equations Ø Increase the number of power equations Become more and more complex in large designs Chien-Nan Liu
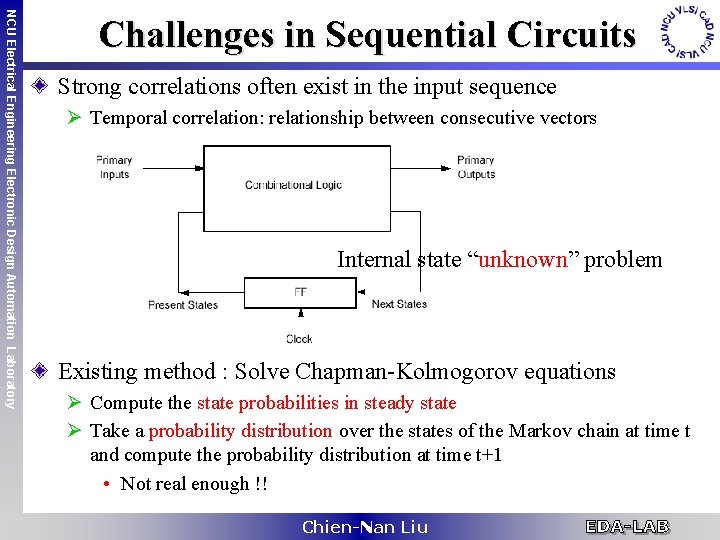
NCU Electrical Engineering Electronic Design Automation Laboratory Challenges in Sequential Circuits Strong correlations often exist in the input sequence Ø Temporal correlation: relationship between consecutive vectors Internal state “unknown” problem Existing method : Solve Chapman-Kolmogorov equations Ø Compute the state probabilities in steady state Ø Take a probability distribution over the states of the Markov chain at time t and compute the probability distribution at time t+1 • Not real enough !! Chien-Nan Liu
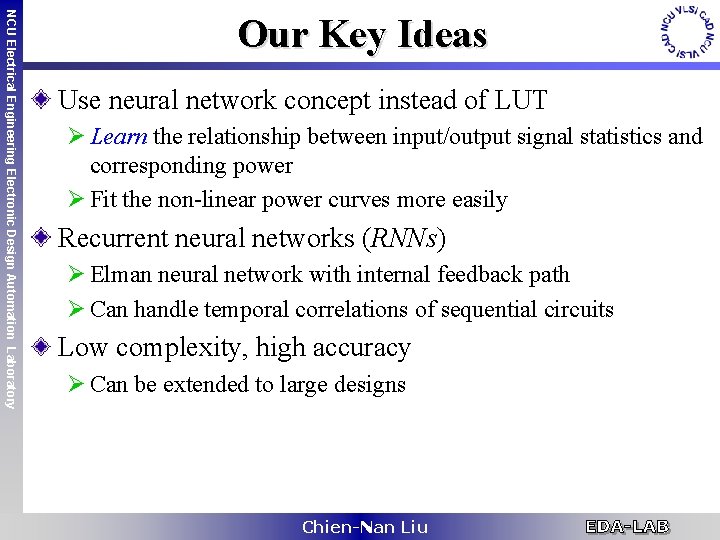
NCU Electrical Engineering Electronic Design Automation Laboratory Our Key Ideas Use neural network concept instead of LUT Ø Learn the relationship between input/output signal statistics and corresponding power Ø Fit the non-linear power curves more easily Recurrent neural networks (RNNs) Ø Elman neural network with internal feedback path Ø Can handle temporal correlations of sequential circuits Low complexity, high accuracy Ø Can be extended to large designs Chien-Nan Liu
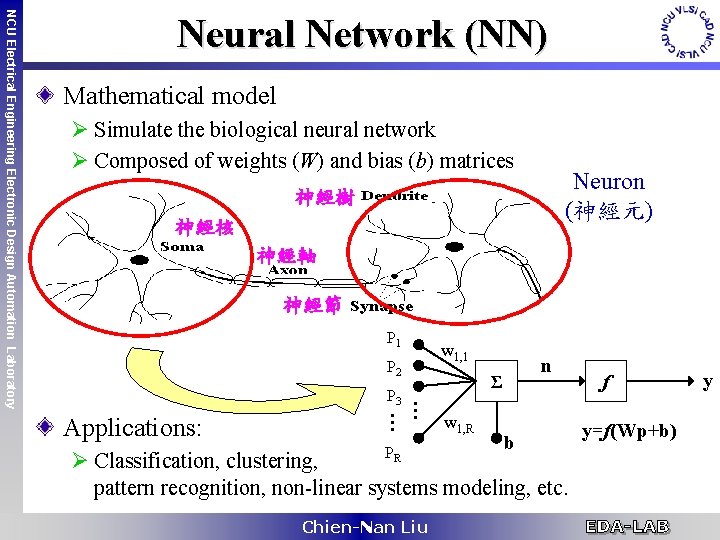
Mathematical model Ø Simulate the biological neural network Ø Composed of weights (W) and bias (b) matrices Neuron (神經元) 神經樹 神經核 神經軸 神經節 P 1 P 2 w 1, 1 Applications: n Σ P 3 … … NCU Electrical Engineering Electronic Design Automation Laboratory Neural Network (NN) w 1, R b PR Ø Classification, clustering, pattern recognition, non-linear systems modeling, etc. Chien-Nan Liu f y=f(Wp+b) y
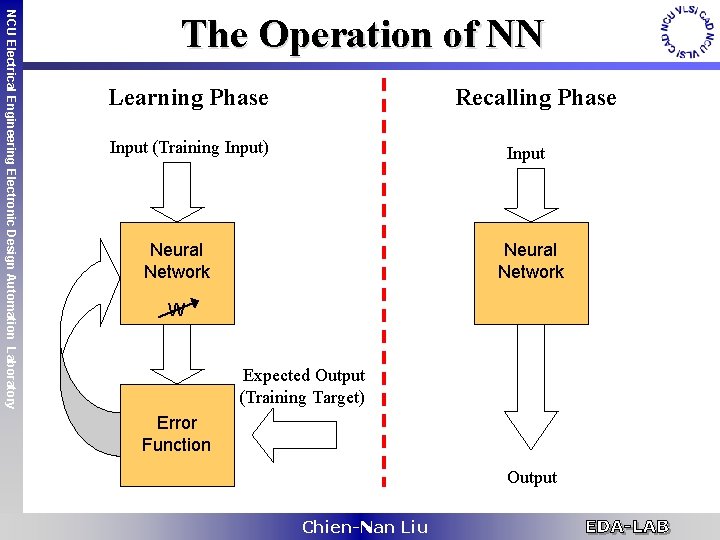
NCU Electrical Engineering Electronic Design Automation Laboratory The Operation of NN Learning Phase Recalling Phase Input (Training Input) Input Neural Network W Expected Output (Training Target) Error Function Output Chien-Nan Liu
NCU Electrical Engineering Electronic Design Automation Laboratory Proposed Construction Flow Building network Training set generation Network training Chien-Nan Liu
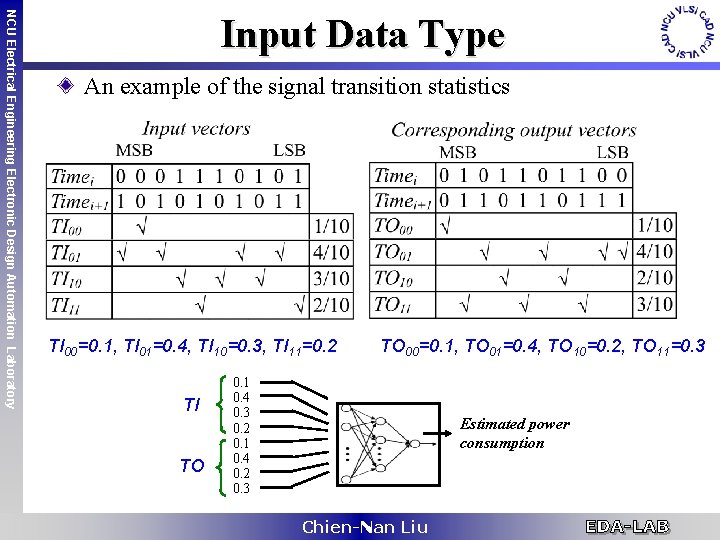
NCU Electrical Engineering Electronic Design Automation Laboratory Input Data Type An example of the signal transition statistics TI 00=0. 1, TI 01=0. 4, TI 10=0. 3, TI 11=0. 2 TI TO TO 00=0. 1, TO 01=0. 4, TO 10=0. 2, TO 11=0. 3 0. 1 0. 4 0. 3 0. 2 0. 1 0. 4 0. 2 0. 3 Estimated power consumption Chien-Nan Liu
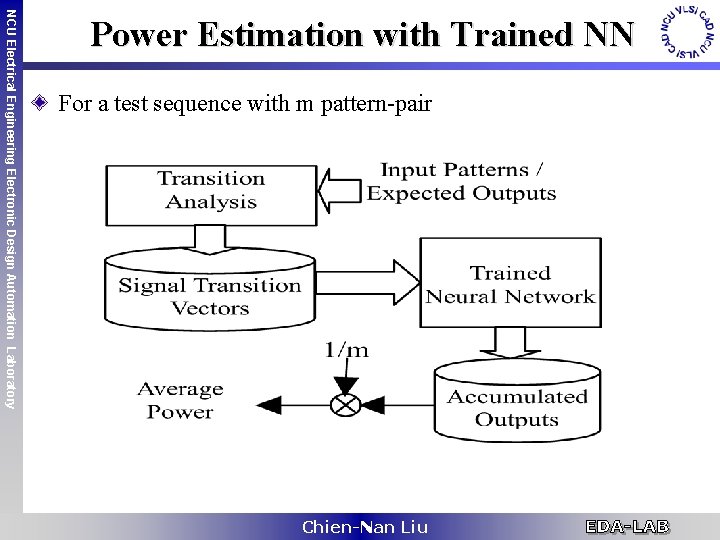
NCU Electrical Engineering Electronic Design Automation Laboratory Power Estimation with Trained NN For a test sequence with m pattern-pair Chien-Nan Liu
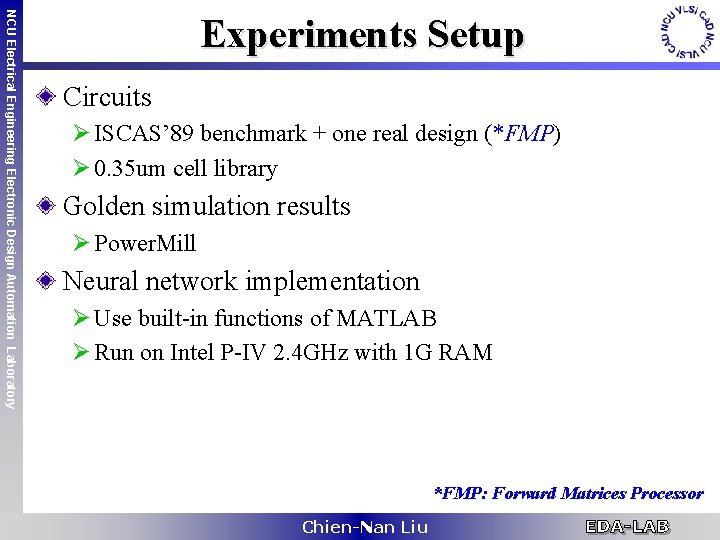
NCU Electrical Engineering Electronic Design Automation Laboratory Experiments Setup Circuits Ø ISCAS’ 89 benchmark + one real design (*FMP) Ø 0. 35 um cell library Golden simulation results Ø Power. Mill Neural network implementation Ø Use built-in functions of MATLAB Ø Run on Intel P-IV 2. 4 GHz with 1 G RAM *FMP: Forward Matrices Processor Chien-Nan Liu
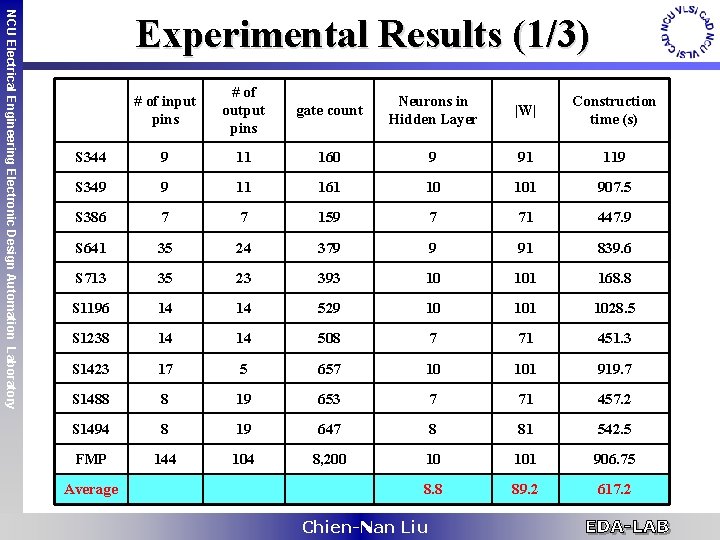
NCU Electrical Engineering Electronic Design Automation Laboratory Experimental Results (1/3) # of input pins # of output pins gate count Neurons in Hidden Layer |W| Construction time (s) S 344 9 11 160 9 91 119 S 349 9 11 161 10 101 907. 5 S 386 7 7 159 7 71 447. 9 S 641 35 24 379 9 91 839. 6 S 713 35 23 393 10 101 168. 8 S 1196 14 14 529 10 101 1028. 5 S 1238 14 14 508 7 71 451. 3 S 1423 17 5 657 10 101 919. 7 S 1488 8 19 653 7 71 457. 2 S 1494 8 19 647 8 81 542. 5 FMP 144 104 8, 200 10 101 906. 75 8. 8 89. 2 617. 2 Average Chien-Nan Liu
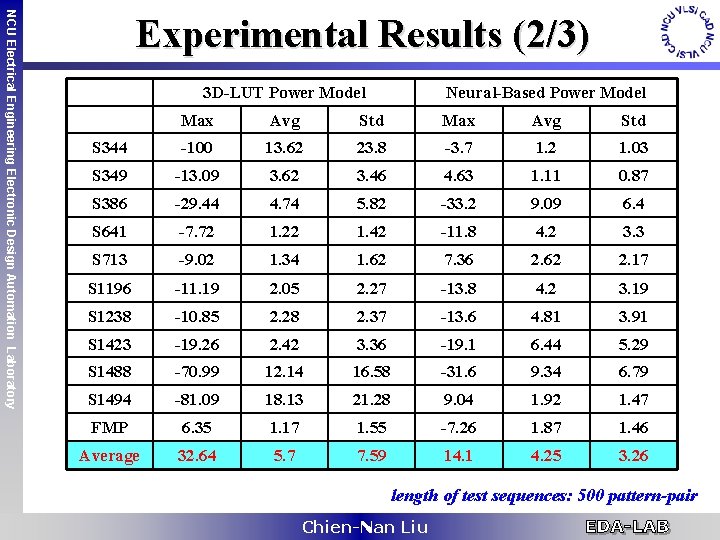
NCU Electrical Engineering Electronic Design Automation Laboratory Experimental Results (2/3) 3 D-LUT Power Model Neural-Based Power Model Max Avg Std S 344 -100 13. 62 23. 8 -3. 7 1. 2 1. 03 S 349 -13. 09 3. 62 3. 46 4. 63 1. 11 0. 87 S 386 -29. 44 4. 74 5. 82 -33. 2 9. 09 6. 4 S 641 -7. 72 1. 22 1. 42 -11. 8 4. 2 3. 3 S 713 -9. 02 1. 34 1. 62 7. 36 2. 62 2. 17 S 1196 -11. 19 2. 05 2. 27 -13. 8 4. 2 3. 19 S 1238 -10. 85 2. 28 2. 37 -13. 6 4. 81 3. 91 S 1423 -19. 26 2. 42 3. 36 -19. 1 6. 44 5. 29 S 1488 -70. 99 12. 14 16. 58 -31. 6 9. 34 6. 79 S 1494 -81. 09 18. 13 21. 28 9. 04 1. 92 1. 47 FMP 6. 35 1. 17 1. 55 -7. 26 1. 87 1. 46 Average 32. 64 5. 7 7. 59 14. 1 4. 25 3. 26 length of test sequences: 500 pattern-pair Chien-Nan Liu
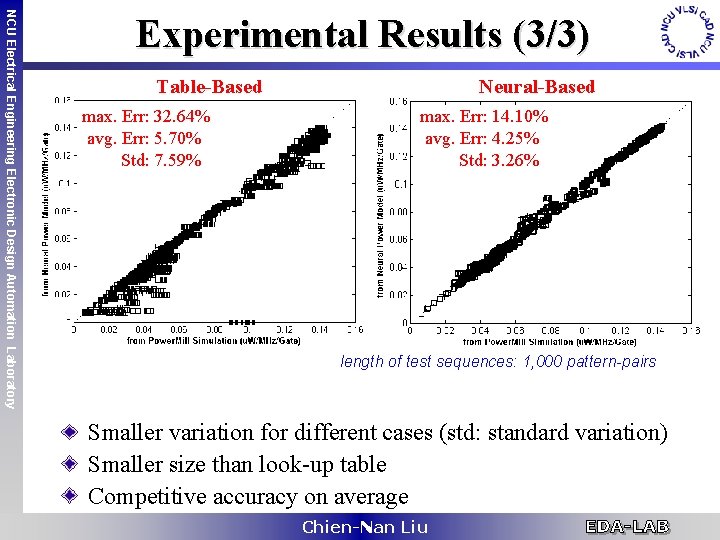
NCU Electrical Engineering Electronic Design Automation Laboratory Experimental Results (3/3) Table-Based max. Err: 32. 64% avg. Err: 5. 70% Std: 7. 59% Neural-Based max. Err: 14. 10% avg. Err: 4. 25% Std: 3. 26% length of test sequences: 1, 000 pattern-pairs Smaller variation for different cases (std: standard variation) Smaller size than look-up table Competitive accuracy on average Chien-Nan Liu
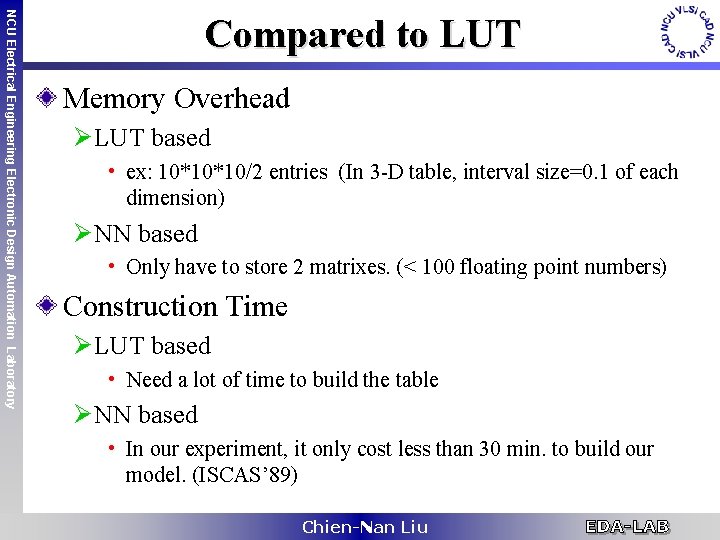
NCU Electrical Engineering Electronic Design Automation Laboratory Compared to LUT Memory Overhead Ø LUT based • ex: 10*10*10/2 entries (In 3 -D table, interval size=0. 1 of each dimension) Ø NN based • Only have to store 2 matrixes. (< 100 floating point numbers) Construction Time Ø LUT based • Need a lot of time to build the table Ø NN based • In our experiment, it only cost less than 30 min. to build our model. (ISCAS’ 89) Chien-Nan Liu
NCU Electrical Engineering Electronic Design Automation Laboratory Summary: Power Estimation We propose a novel power model for sequential circuits Ø Use the learning capability of neural networks Ø Can be used at behavior level (only need input/output info. ) Ø Can be extended to large circuits with low complexity Ø High efficiency and accuracy even for short sequences References: Ø Wen-Tsan Hsieh, Chih-Chieh Shiue, and Chien-Nan Jimmy Liu, “A Novel Approach for High-Level Power Modeling of Sequential Circuits Using Recurrent Neural Networks”, IEEE International Symposium on Circuit and Systems (EI), pp. 3591 -3594, May 2005. Ø Wen-Tsan Hsieh, Chih-Chieh Shiue, and Chien-Nan Jimmy Liu, “Efficient Power Modeling Approach of Sequential Circuits Using Recurrent Neural Networks”, IEE Proceedings - Computers and Digital Techniques (SCI, EI), vol. 153, no. 2, pp. 7886, March 2006. Chien-Nan Liu
NCU Electrical Engineering Electronic Design Automation Laboratory Outline Introduction High-Level Power Modeling High-Level Current Waveform Modeling Ø Gate-level current waveform estimation using existing information Ø Macro-level current waveform estimation using neural network Conclusion Chien-Nan Liu
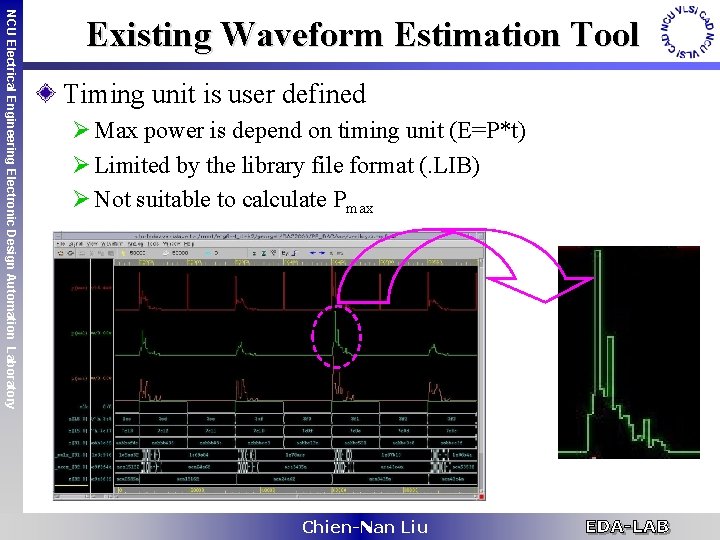
NCU Electrical Engineering Electronic Design Automation Laboratory Existing Waveform Estimation Tool Timing unit is user defined Ø Max power is depend on timing unit (E=P*t) Ø Limited by the library file format (. LIB) Ø Not suitable to calculate Pmax Chien-Nan Liu
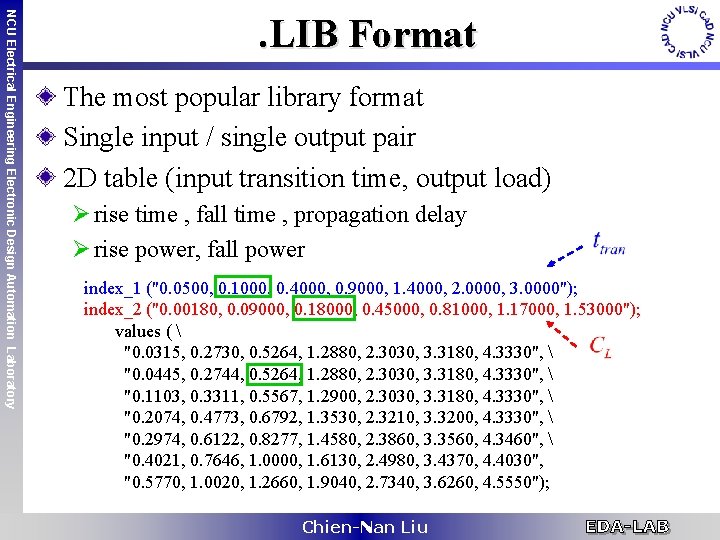
NCU Electrical Engineering Electronic Design Automation Laboratory . LIB Format The most popular library format Single input / single output pair 2 D table (input transition time, output load) Ø rise time , fall time , propagation delay Ø rise power, fall power index_1 ("0. 0500, 0. 1000, 0. 4000, 0. 9000, 1. 4000, 2. 0000, 3. 0000"); index_2 ("0. 00180, 0. 09000, 0. 18000, 0. 45000, 0. 81000, 1. 17000, 1. 53000"); values ( "0. 0315, 0. 2730, 0. 5264, 1. 2880, 2. 3030, 3. 3180, 4. 3330", "0. 0445, 0. 2744, 0. 5264, 1. 2880, 2. 3030, 3. 3180, 4. 3330", "0. 1103, 0. 3311, 0. 5567, 1. 2900, 2. 3030, 3. 3180, 4. 3330", "0. 2074, 0. 4773, 0. 6792, 1. 3530, 2. 3210, 3. 3200, 4. 3330", "0. 2974, 0. 6122, 0. 8277, 1. 4580, 2. 3860, 3. 3560, 4. 3460", "0. 4021, 0. 7646, 1. 0000, 1. 6130, 2. 4980, 3. 4370, 4. 4030", "0. 5770, 1. 0020, 1. 2660, 1. 9040, 2. 7340, 3. 6260, 4. 5550"); Chien-Nan Liu
NCU Electrical Engineering Electronic Design Automation Laboratory Our Key Ideas Assume triangular waveforms for basic gates Ø Most of the current waveforms are similar to a triangle. Ø A reasonable assumption that simplifies the current waveform problems. Use existing. lib information Ø Advanced library format for current waveform is not standardized and not supported by many tools. Ø Use some simple calculation to generate the current waveform from existing timing and power information stored in. lib files. Ø Do not require additional circuit characterization efforts. Ø Easier to be integrated with current EDA tools. Chien-Nan Liu
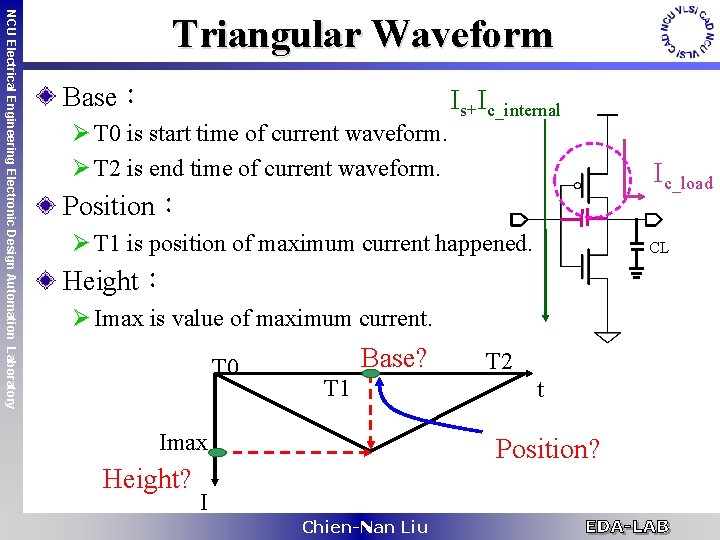
NCU Electrical Engineering Electronic Design Automation Laboratory Triangular Waveform Base: Ø T 0 is start time of current waveform. Ø T 2 is end time of current waveform. Is+Ic_internal Ic_load Position: Ø T 1 is position of maximum current happened. Height: Ø Imax is value of maximum current. T 0 Base? T 1 Imax Height? T 2 t Position? I Chien-Nan Liu CL
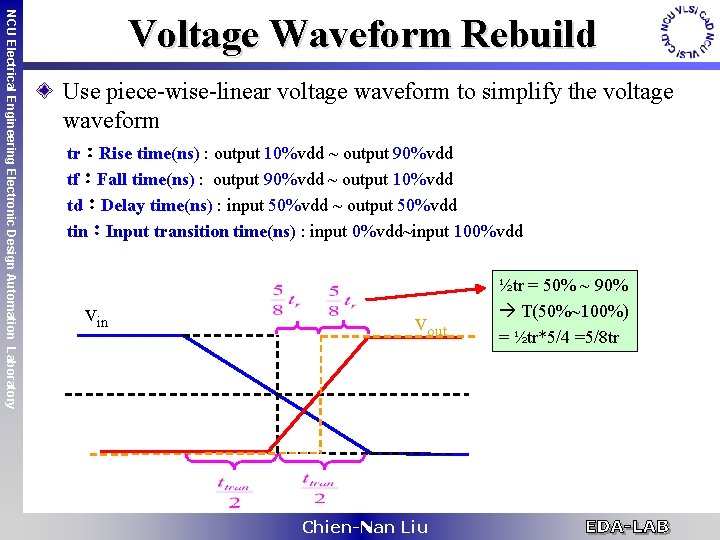
NCU Electrical Engineering Electronic Design Automation Laboratory Voltage Waveform Rebuild Use piece-wise-linear voltage waveform to simplify the voltage waveform tr:Rise time(ns) : output 10%vdd ~ output 90%vdd tf:Fall time(ns) : output 90%vdd ~ output 10%vdd td:Delay time(ns) : input 50%vdd ~ output 50%vdd tin:Input transition time(ns) : input 0%vdd~input 100%vdd vin vout Chien-Nan Liu ½tr = 50% ~ 90% T(50%~100%) = ½tr*5/4 =5/8 tr
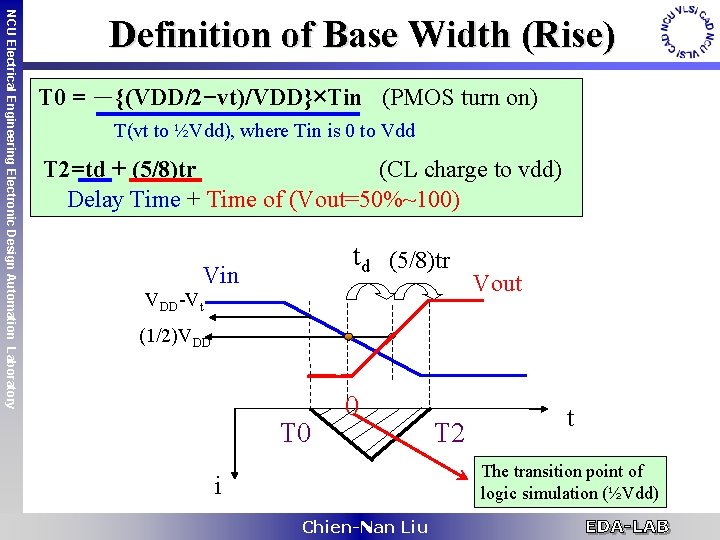
NCU Electrical Engineering Electronic Design Automation Laboratory Definition of Base Width (Rise) T 0 = -{(VDD/2−vt)/VDD}×Tin (PMOS turn on) T(vt to ½Vdd), where Tin is 0 to Vdd T 2=td + (5/8)tr (CL charge to vdd) Delay Time + Time of (Vout=50%~100) td (5/8)tr Vin VDD-Vt Vout (1/2)VDD T 0 0 T 2 t The transition point of logic simulation (½Vdd) i Chien-Nan Liu
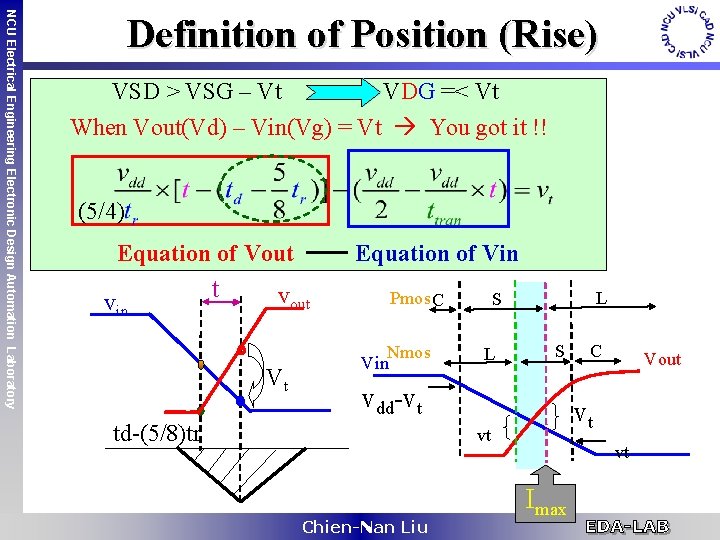
NCU Electrical Engineering Electronic Design Automation Laboratory Definition of Position (Rise) VSD > VSG – Vt VDG =< Vt When Vout(Vd) – Vin(Vg) = Vt You got it !! (5/4) Equation of Vout vin t Equation of Vin vout Vt Pmos C Nmos Vin L S vdd-vt td-(5/8)tr Vout vt vt Chien-Nan Liu C vt Imax
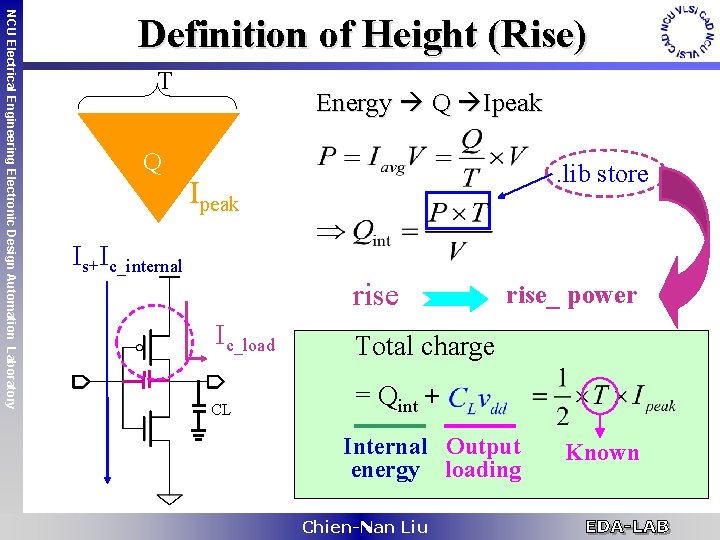
NCU Electrical Engineering Electronic Design Automation Laboratory Definition of Height (Rise) T Q Energy Q Ipeak. lib store Ipeak Is+Ic_internal rise Ic_load CL rise_ power Total charge = Qint + Internal Output energy loading Chien-Nan Liu Known
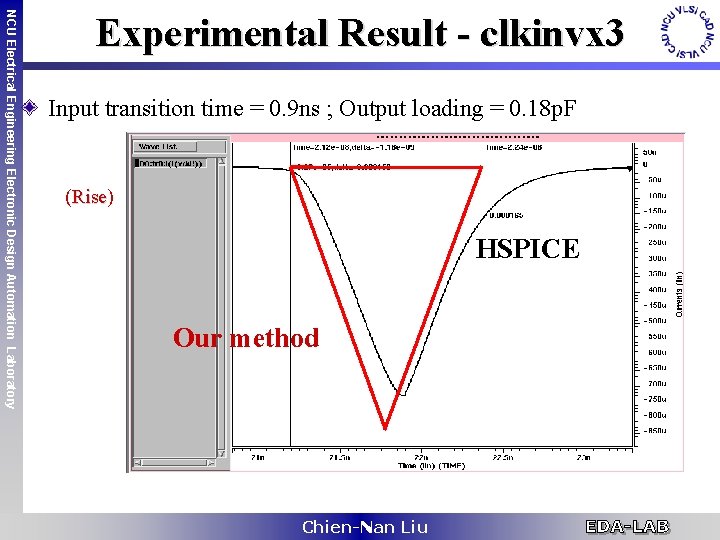
NCU Electrical Engineering Electronic Design Automation Laboratory Experimental Result - clkinvx 3 Input transition time = 0. 9 ns ; Output loading = 0. 18 p. F (Rise) Rise HSPICE Our method Chien-Nan Liu
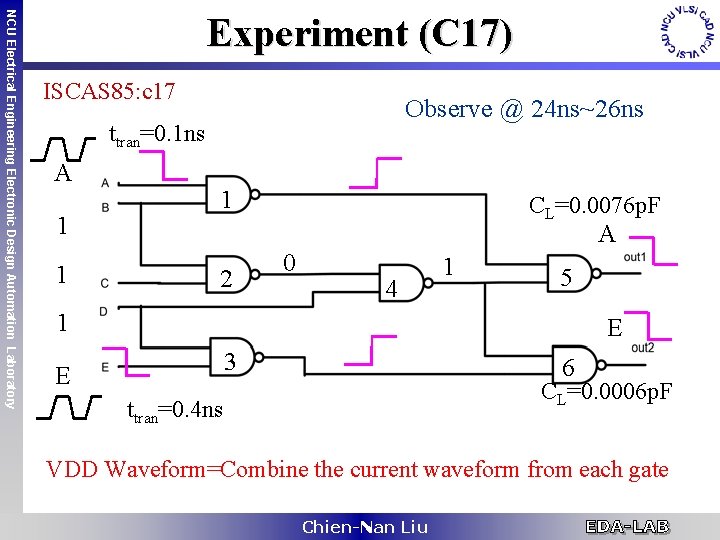
NCU Electrical Engineering Electronic Design Automation Laboratory Experiment (C 17) ISCAS 85: c 17 Observe @ 24 ns~26 ns ttran=0. 1 ns A 1 1 1 2 CL=0. 0076 p. F 0 A 4 1 5 1 E 3 E 6 CL=0. 0006 p. F ttran=0. 4 ns VDD Waveform=Combine the current waveform from each gate Chien-Nan Liu
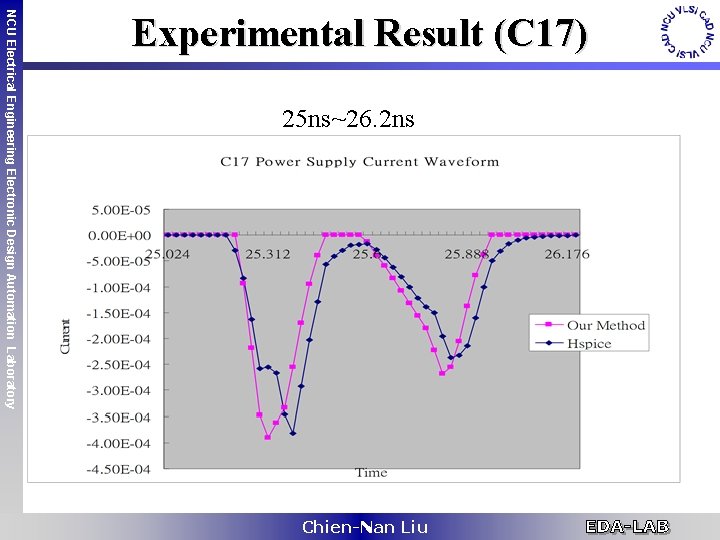
25 ns~26. 2 ns NCU Electrical Engineering Electronic Design Automation Laboratory Experimental Result (C 17) Chien-Nan Liu
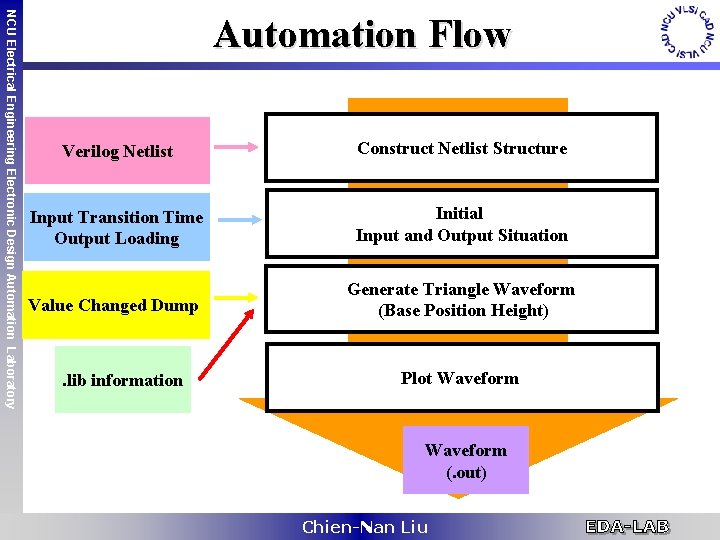
NCU Electrical Engineering Electronic Design Automation Laboratory Automation Flow Verilog Netlist Construct Netlist Structure Input Transition Time Output Loading Initial Input and Output Situation Value Changed Dump Generate Triangle Waveform (Base Position Height) . lib information Plot Waveform (. out) Chien-Nan Liu
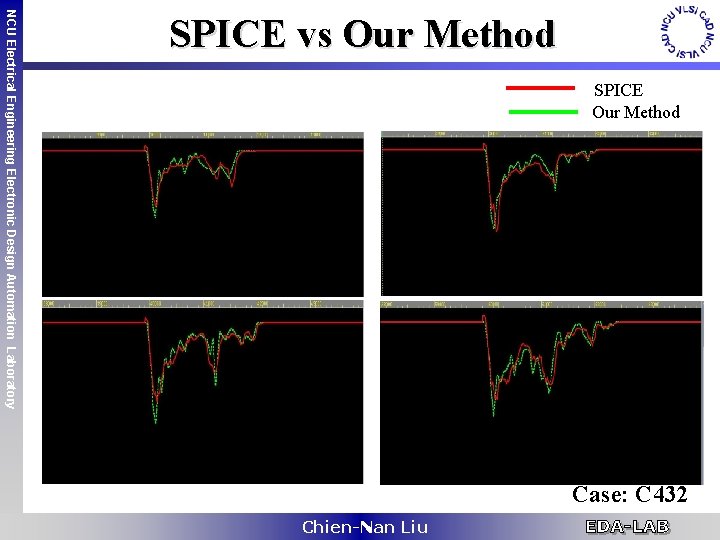
SPICE Our Method NCU Electrical Engineering Electronic Design Automation Laboratory SPICE vs Our Method Case: C 432 Chien-Nan Liu
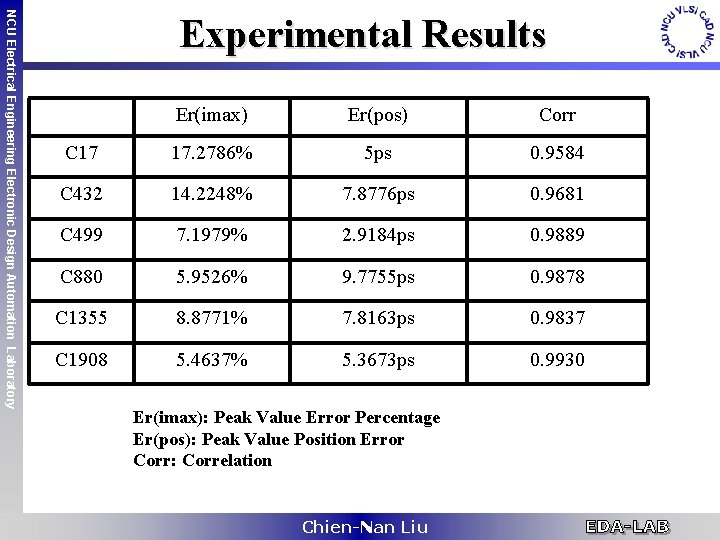
NCU Electrical Engineering Electronic Design Automation Laboratory Experimental Results Er(imax) Er(pos) Corr C 17 17. 2786% 5 ps 0. 9584 C 432 14. 2248% 7. 8776 ps 0. 9681 C 499 7. 1979% 2. 9184 ps 0. 9889 C 880 5. 9526% 9. 7755 ps 0. 9878 C 1355 8. 8771% 7. 8163 ps 0. 9837 C 1908 5. 4637% 5. 3673 ps 0. 9930 Er(imax): Peak Value Error Percentage Er(pos): Peak Value Position Error Corr: Correlation Chien-Nan Liu
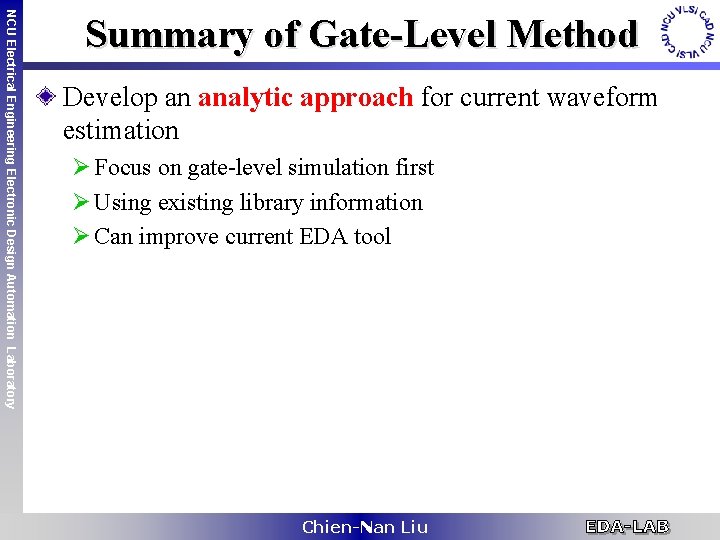
NCU Electrical Engineering Electronic Design Automation Laboratory Summary of Gate-Level Method Develop an analytic approach for current waveform estimation Ø Focus on gate-level simulation first Ø Using existing library information Ø Can improve current EDA tool Chien-Nan Liu
NCU Electrical Engineering Electronic Design Automation Laboratory Outline Introduction High-Level Power Modeling High-Level Current Waveform Modeling Ø Gate-level current waveform estimation using existing information Ø Macro-level current waveform estimation using neural network Conclusion Chien-Nan Liu
NCU Electrical Engineering Electronic Design Automation Laboratory Motivation Gate-level power/current estimation is the primary approach in existing tools For block-based designs (e. g. protected IP), you may not have the internal information, like the gate-level netlist Ø Only functional information (inputs/outputs) is available We target to provide a high-level model that only need “Inputs/Outputs” to estimate the current waveform Ø Internal circuit information is only required at the characterization process Providing such current waveform model and functional model will not explore the internal info. to customers Ø Suitable for IP protection Chien-Nan Liu
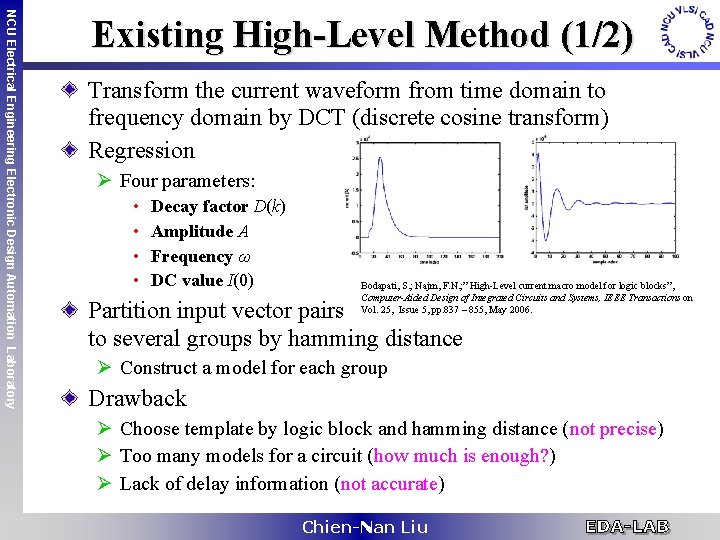
NCU Electrical Engineering Electronic Design Automation Laboratory Existing High-Level Method (1/2) Transform the current waveform from time domain to frequency domain by DCT (discrete cosine transform) Regression Ø Four parameters: • • Decay factor D(k) Amplitude A Frequency ω DC value I(0) Bodapati, S. ; Najm, F. N. ; ” High-Level current macro model for logic blocks”, Computer-Aided Design of Integrated Circuits and Systems, IEEE Transactions on Vol. 25, Issue 5, pp. 837 – 855, May 2006. Partition input vector pairs to several groups by hamming distance Ø Construct a model for each group Drawback Ø Choose template by logic block and hamming distance (not precise) Ø Too many models for a circuit (how much is enough? ) Ø Lack of delay information (not accurate) Chien-Nan Liu
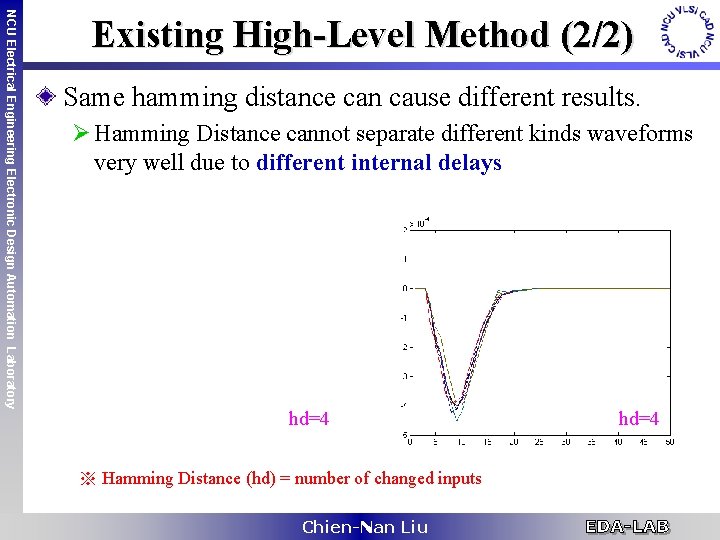
NCU Electrical Engineering Electronic Design Automation Laboratory Existing High-Level Method (2/2) Same hamming distance can cause different results. Ø Hamming Distance cannot separate different kinds waveforms very well due to different internal delays hd=4 ※ Hamming Distance (hd) = number of changed inputs Chien-Nan Liu hd=4
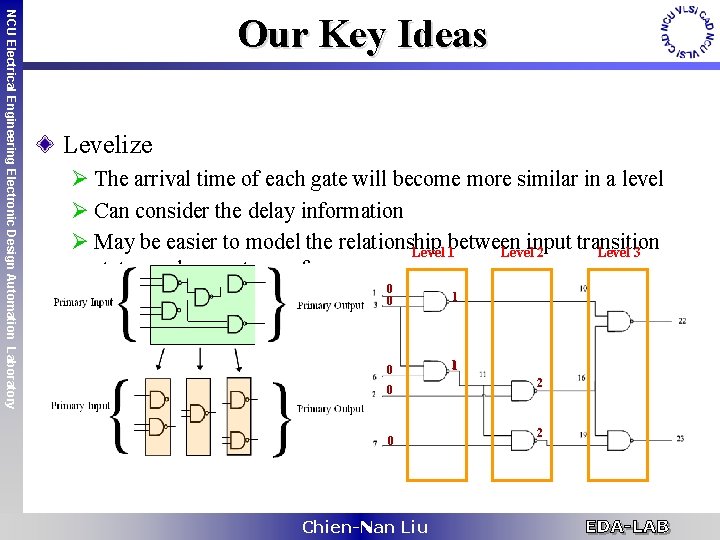
NCU Electrical Engineering Electronic Design Automation Laboratory Our Key Ideas Levelize Ø The arrival time of each gate will become more similar in a level Ø Can consider the delay information Ø May be easier to model the relationship between input transition Level 1 Level 2 Level 3 status and current waveform 0 0 1 0 0 Chien-Nan Liu 2 2
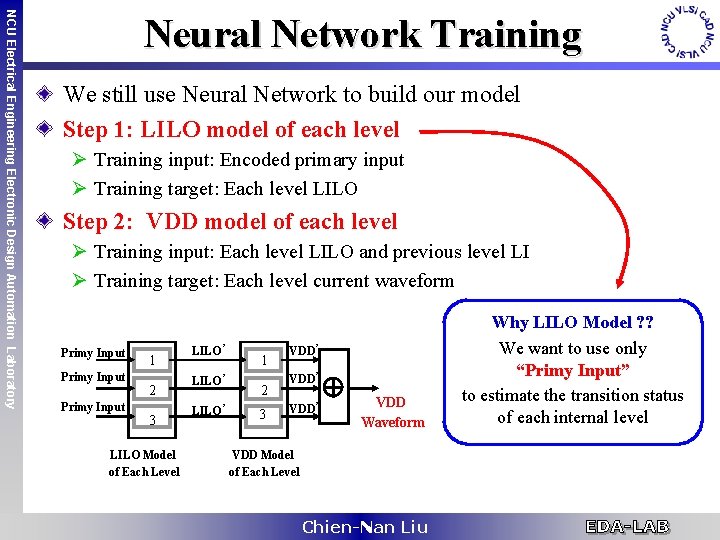
NCU Electrical Engineering Electronic Design Automation Laboratory Neural Network Training We still use Neural Network to build our model Step 1: LILO model of each level Ø Training input: Encoded primary input Ø Training target: Each level LILO Step 2: VDD model of each level Ø Training input: Each level LILO and previous level LI Ø Training target: Each level current waveform Primy Input 1 2 3 LILO Model of Each Level LILO’ 1 2 3 VDD’ VDD Waveform VDD Model of Each Level Chien-Nan Liu Why LILO Model ? ? We want to use only “Primy Input” to estimate the transition status of each internal level
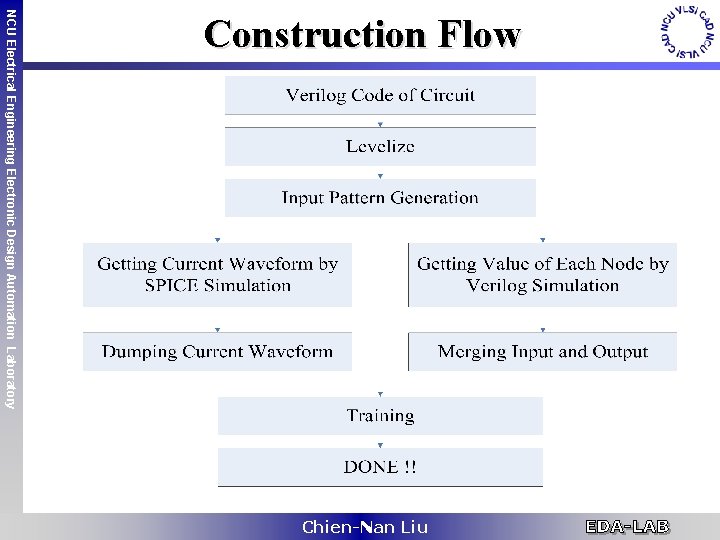
NCU Electrical Engineering Electronic Design Automation Laboratory Construction Flow Chien-Nan Liu
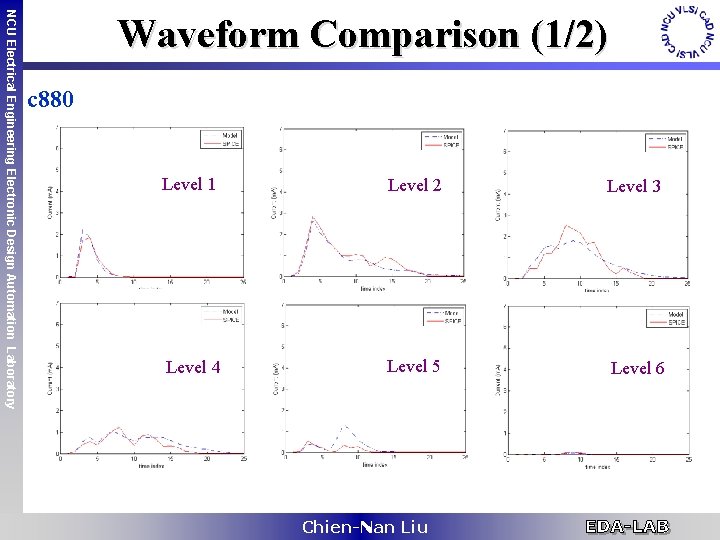
NCU Electrical Engineering Electronic Design Automation Laboratory Waveform Comparison (1/2) c 880 Level 1 Level 2 Level 3 Level 4 Level 5 Level 6 Chien-Nan Liu
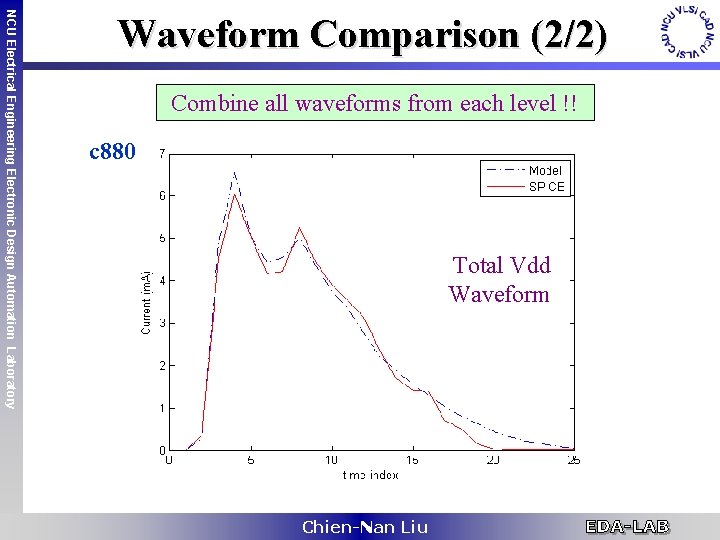
NCU Electrical Engineering Electronic Design Automation Laboratory Waveform Comparison (2/2) Combine all waveforms from each level !! c 880 Total Vdd Waveform Chien-Nan Liu
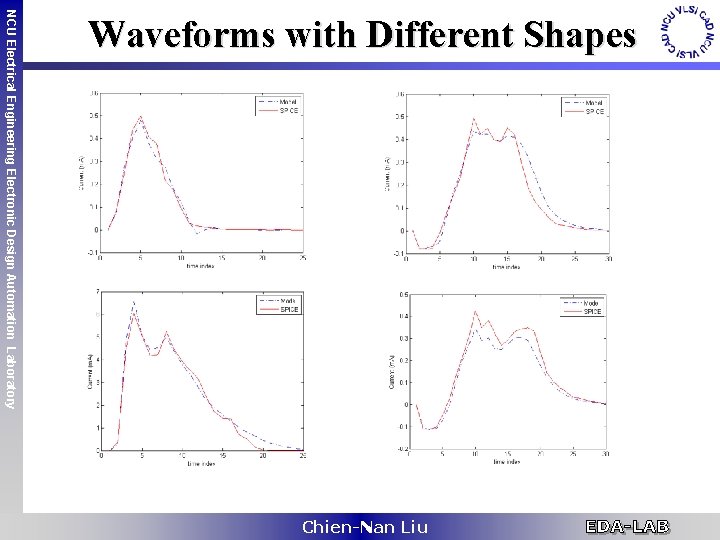
NCU Electrical Engineering Electronic Design Automation Laboratory Waveforms with Different Shapes Chien-Nan Liu
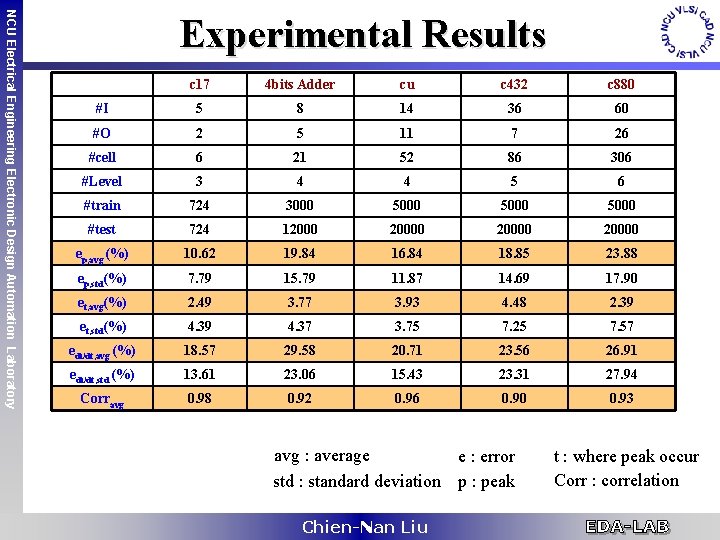
NCU Electrical Engineering Electronic Design Automation Laboratory Experimental Results c 17 4 bits Adder cu c 432 c 880 #I 5 8 14 36 60 #O 2 5 11 7 26 #cell 6 21 52 86 306 #Level 3 4 4 5 6 #train 724 3000 5000 #test 724 120000 20000 ep, avg (%) 10. 62 19. 84 16. 84 18. 85 23. 88 ep, std(%) 7. 79 15. 79 11. 87 14. 69 17. 90 et, avg(%) 2. 49 3. 77 3. 93 4. 48 2. 39 et, std(%) 4. 39 4. 37 3. 75 7. 25 7. 57 edi/dt, avg (%) 18. 57 29. 58 20. 71 23. 56 26. 91 edi/dt, std (%) 13. 61 23. 06 15. 43 23. 31 27. 94 Corravg 0. 98 0. 92 0. 96 0. 90 0. 93 avg : average e : error t : where peak occur Corr : correlation std : standard deviation p : peak Chien-Nan Liu
NCU Electrical Engineering Electronic Design Automation Laboratory Summary of Macro-Level Method We propose a high level current model Ø Used at high-level (only require input/output info. ) • Convenient to use • Efficient computation • Feasible for IP protection Ø Constructed by neural network Ø Only a single model for one logic block Ø Can estimate the waveforms with different shapes Chien-Nan Liu
NCU Electrical Engineering Electronic Design Automation Laboratory Conclusions 欲善其事 必先利其器 !! So. C is really a big challenge for IC designers Power and Noise are two major challenges Doing the things earlier can have higher impacts More powerful tools are essential to solve those difficult design problems EDA – Where Electronics Begins Welcome to join MOE CAD contest http: //www. ee. ncu. edu. tw/~cad_contest Chien-Nan Liu
- Slides: 63