
NCSBN The Forum of State Nursing Workforce Centers
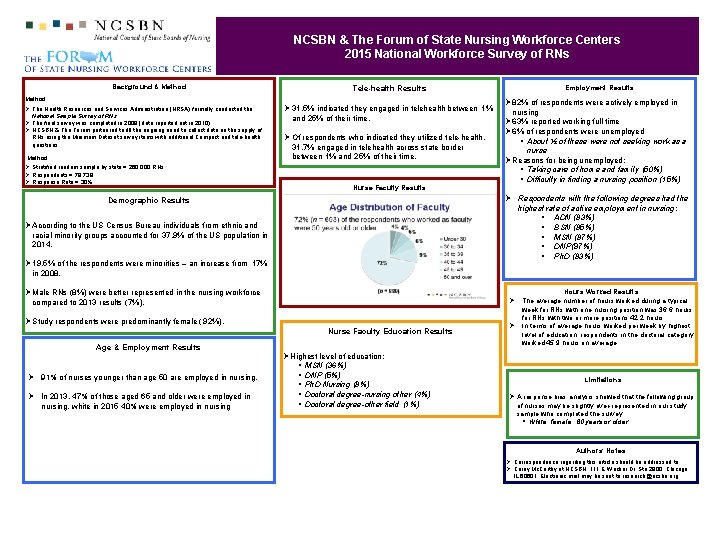
NCSBN & The Forum of State Nursing Workforce Centers 2015 National Workforce Survey of RNs Background & Method Ø The Health Resources and Services Administration (HRSA) formally conducted the National Sample Survey of RNs. Ø The final survey was completed in 2008 (data reported out in 2010). Ø NCSBN & The Forum partnered to fill the ongoing need to collect data on the supply of RNs using the Minimum Dataset survey items with additional Compact and tele-health questions. Method Ø Stratified random sample by state = 260, 000 RNs Ø Respondents = 78, 739 Ø Response Rate = 30% Employment Results Tele-health Results Method Ø 31. 5% indicated they engaged in telehealth between 1% and 25% of their time. Ø Of respondents who indicated they utilized tele-health, 31. 7% engaged in telehealth across state border between 1% and 25% of their time. Nurse Faculty Results Ø 82% of respondents were actively employed in nursing Ø 63% reported working full time Ø 6% of respondents were unemployed § About ½ of these were not seeking work as a nurse Ø Reasons for being unemployed: § Taking care of home and family (50%) § Difficulty in finding a nursing position (15%) Ø Respondents with the following degrees had the Demographic Results highest rate of active employment in nursing: § ADN (83%) § BSN (85%) § MSN (87%) § DNP(97%) § Ph. D (83%) Ø According to the US Census Bureau individuals from ethnic and racial minority groups accounted for 37. 9% of the US population in 2014. Ø 19. 5% of the respondents were minorities – an increase from 17% in 2008. Ø Male RNs (8%) were better represented in the nursing workforce Ø compared to 2013 results (7%). Ø Study respondents were predominantly female ( 92%). Nurse Faculty Education Results Age & Employment Results Ø 91% of nurses younger than age 50 are employed in nursing, Ø In 2013, 47% of those aged 65 and older were employed in nursing, white in 2015 40% were employed in nursing Ø Highest level of education: § MSN (36%) § DNP (5%) § Ph. D Nursing (8%) § Doctoral degree-nursing other (4%) § Doctoral degree-other field (1%) Ø Hours Worked Results The average number of hours worked during a typical week for RNs with one nursing position was 36. 6 hours; for RNs with two or more positions 42. 2 hours. In terms of average hours worked per week by highest level of education, respondents in the doctoral category worked 45. 9 hours on average Limitations Ø A response bias analysis showed that the following group of nurses may be slightly over-represented in our study sample who completed the survey § White, female, 60 years or older Authors’ Notes Ø Correspondence regarding this article should be addressed to Ø Carey Mc. Carthy at NCSBN, 111 E Wacker Dr, Ste 2900, Chicago, IL 60601. Electronic mail may be sent to research@ncsbn. org.
- Slides: 1