Navigation 3 02 Using Charts References FTGU pages


: – Lambert Conformal Conic Projection, 1:")


- Slides: 20
Navigation 3. 02 Using Charts References: FTGU pages 184 -194 Transport Canada Study and Reference Guide Glider Pilot Canada Flight Training Manual – Pilot Navigation
3. 02 Using Charts • MTPs: – Using Aeronautical Charts – Types of Charts – Symbols on Charts – Measuring Distance – Tracks and Bearings
Using Aeronautical Charts • How charts differ from maps: Control Zones Aerodrome Information Ground Elevation Lines of Variation Airspace Information Communication/ Navigation Aids
Types of Charts • VNC (VFR Navigation Chart): – Lambert Conformal Conic Projection, 1: 500 000 scale – Used to enable visual navigation (lower level, low speed) • VTA (VFR Terminal Area Chart): – Transverse Mercator Projection, 1: 50 000 scale – Used to illustrate landmarks, call points, and control zones in a terminal area (e. g. Vancouver) • WAC (World Aeronautical Chart): – Lambert Conformal Conic Projection, 1: 1 000 scale – Designed for visual navigation (higher levels, greater speed)
Symbols on Charts • Charts: – Where to find the chart legend – How to interpret symbols
Symbols on Charts
Symbols on Charts
Symbols on Charts
Symbols on Charts
Symbols on Charts
Symbols on Charts
Confirmation
CYQQ Comox
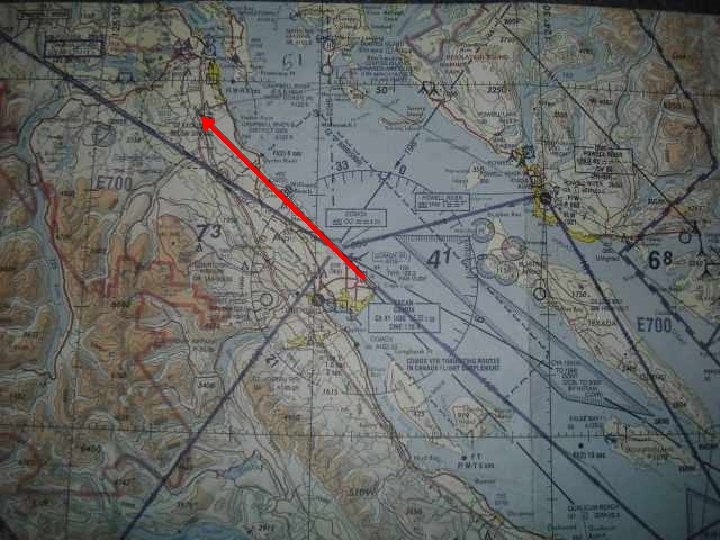
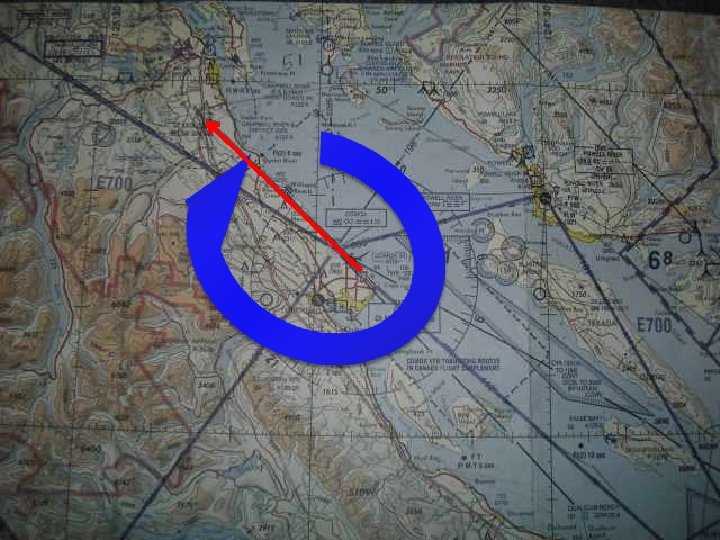
Measuring Distance • To Measure Distance on a Chart – Use ruler and chart scale
21 SM
21 SM
Tracks and Bearings • Track: – Proposed path over the ground • Track Made Good: – Actual path over the ground • Track Error: – Angle between track and track made good • Bearing: – The direction or angle from one point to another
Test Ranges in Nevada