Natural Language Processing Clustering July 2002 Clustering n


 n n Develop a probabilistic model for a problem. Understand")

 n n Clustering does not require training data and is hence")


 Top-down n 1. 2. 3. Start from a cluster of")


")

 n n n Determine the most likely estimates for the parameters")
 We assume that the data is generated by k gaussians (k")
 n We find the maximum likelihood model of the form: P(xi)=Skj=1")
 n Parameters are found by maximizing the log likelihood given in")
 n EM algorithm is an iterative solution to the following circular")
 n Expectation step (E-step): hij P ( xi | n j")

- Slides: 25
Natural Language Processing Clustering July, 2002
Clustering n Partition a set of objects into groups or clusters. n n Similar objects are placed in the same group and dissimilar objects in different groups. Objects are described and clustered using a set of features and values.
Exploratory Data Analysis (EDA) n n Develop a probabilistic model for a problem. Understand the characteristics of the data
Generalization n Induce bins from the data. n n n Monday, Tuesday, …, Sunday There is no entry for Friday Learn natural relationships in data. n Group objects into clusters and genaralize from what we know about some members of the cluster
Clustering (vs. Classification) n n Clustering does not require training data and is hence called unsupervised. Classification is supervised and requires a set of labeled training instances for each group. The result of clustering only depends on natural divisions in the data and not on any pre-existing categorization scheme as in classification.
Types of Clustering n Hierarchical n Bottom Up: n n Top down: n n n Start with all objects and divide into groups so as to maximize within-group similarity. Single-link, complete-link, group-average Non-hierarchical n n n Start with objects and group most similar ones. K-means EM-algorithm Hard (1: 1) vs soft (1: n – degree of membership)
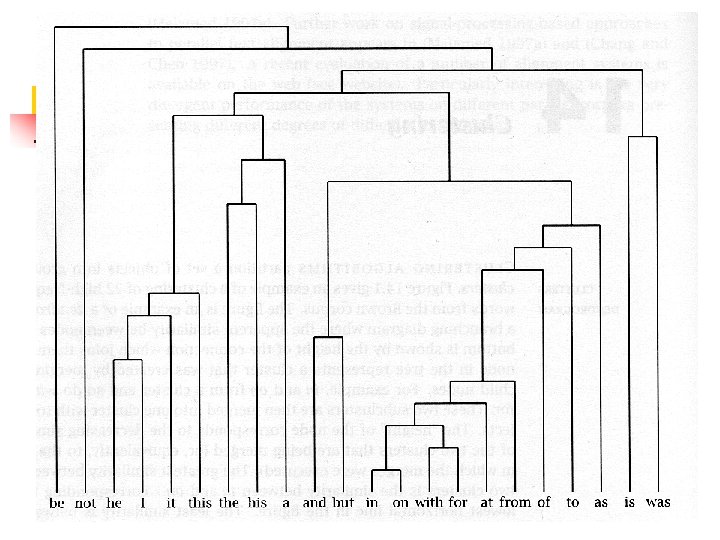
Hierarchical Clustering Bottom-up: n 1. 2. 3. Start with a separate cluster for each object Determine the two most similar clusters and merge into a new cluster. Repeat on the new clusters that have been formed. Terminate when one large cluster containing all objects has been formed Example of a similarity measure:
Hierarchical Clustering (Cont. ) Top-down n 1. 2. 3. Start from a cluster of all objects Iteratively determine the cluster that is least coherent and split it. Repeat until all clusters have one object.
Similarity Measures for Hierarchical Clustering n Single-link n n Complete-link n n Similarity of two most similar members Similarity of two least similar members Group-average n Average similarity between members
Single-Link n Similarity function focuses on local coherence
Complete-Link n Similarity function focuses on global cluster quality
Group-Average n n Instead of greatest similarity between elements of clusters or the least similarity the merge criterion is average similarity. Compromise between single-link and complete-link clustering
An Application: Language Model n n Many rare events do not have enough training data for accurate probabilistic modeling. Clustering is used to improve the language model by way of generalization. n Predictions for rare events more accurate.
Non-Hierarchical Clustering n n n Start out with a partition based on randomly selected seeds and then refine this initial partition. Several passes of reallocating objects are needed (hierarchical algorithms need only one pass). Hierarchical clusterings too can be improved using reallocations. Stop based on some measure of goodness or cluster quality. Heuristic: number of clusters, size of clusters, stopping criteria… No optimal solution.
K-Means Hard clustering algorithm Defines clusters by the center of mass of their members n n 1. 2. 3. 4. Define initial center of clusters randomly Assign each object to the cluster whose center is closest Recompute the center for each cluster Stop when centers do not change
K-Means (Cont. )
The EM Algorithm n “Soft” version of K-means clustering.
EM (Cont. ) n n n Determine the most likely estimates for the parameters of the distribution. The idea is that the data are generated by several underlying causes. Z : unobserved data set n n Z= { vector z 1 … vector zn } Zi = (zi 1, zi 2 … zik) n n X : observed data set (data to be clustered) n n n Where zij =1 if object i is a member of cluster j otherwise 0 X = { vector x 1 … vector xn } xi = (xi 1, xi 2 … xim) Estimate the model that generated this data.
EM (Cont. ) We assume that the data is generated by k gaussians (k clusters) n Each gaussian with parameters mean mj and covariance Sj is given by: 1 TS-1 (x-m )/2] exp[-(x-m ) j j j n( x; mj , Sj ) = ( 2 p )m Sj n
EM (Cont. ) n We find the maximum likelihood model of the form: P(xi)=Skj=1 pj nj (xi; mj, Sj) where pj is the weight for each Gaussian
EM (Cont. ) n Parameters are found by maximizing the log likelihood given in the equation: = (q 1, …, qk)T where the individual parameters of the gaussian mixture are qj=(mj, Sj, pj) - = = p l ( X | ) log Õ P( xi ) log Õå j n j ( xi ; m j , S j ) n i =1 - = å log å p j n j ( xi ; m j , S j ) n k i =1 j =1
EM (Cont. ) n EM algorithm is an iterative solution to the following circular statements: n n Estimate: If we knew the value of we could compute the expected values of the hidden structure of the model. Maximize: If we knew the expected values of the hidden structure of the model, then we could compute the maximum likelihood value of .
EM (Cont. ) n Expectation step (E-step): hij P ( xi | n j ; ) = E ( zij | xi ; ) = k å P ( xi | nl ; ) l =1 n Maximization step (M-step): åhij xi n - mj¢ = i =1 n åhij i =1 - - T åhij ( xi - mj ) n Sj¢ = i =1 n åhij i =1 n p j¢ = åh i =1 n ij
Properties of hierarchical and non-hierarchical clustering n n Preferable for detailed data analysis Provides more information than flat No single best algorithm (dependent on application) Less efficient than flat ( for n objects, n X n similarity matrix required) n n Preferable if efficiency is a consideration or data sets are very large K-means is the conceptually simplest method K-means assumes a simple Euclidean representation space and so can’t be used for many data sets In such case, EM algorithm is chosen