Natural History Prognosis Studies n Natural history of
")


 Study) n n")
 n Disease (cure, progression) n Disability")

 n Independence in: basic")


")


 n n n")


 n Clear indication of starting point (zero time) n n")
 n n n Withdrawn subjects (lost to FU and still")


- Slides: 33
Natural History/ Prognosis Studies n Natural history of disease (clinical course; preclinical/ clinical stage) n Prognosis (death/survivors of disease) n Survival analysis: Kaplan-Meier survival curves n Cox proportional hazards analysis (hazard ratio)
Natural History and Prognosis of a Disease Why? n Need to quantify n Patient/family counseling n Development and evaluation of interventions Types of study n Descriptive (persons with the disease only) n Analytical (comparison group) n Prognostic factors (risk factors for poor prognosis)
Natural History Studies Stages of Disease Preclinical - Biologic onset of disease - Pathologic evidence of disease (if sought) - Signs and symptoms Clinical - Medical care sought - Diagnosis - Treatment 3
Five Stages to Dependence Non-smoker Preparatory Development of attitudes and beliefs Trying First cigarettes Experimental Smokes repeatedly but irregularily Regular Use Smokes at least weekly across a variety of situations Addiction Dependent Physiologic need Source: Preventing Tobacco Use Among Young People. A Report of the Surgeon General, 1994.
What is Time Zero? n n Date of first symptoms? Date of detection? Date of diagnosis? Beware of differences in “time zero”between study groups n Screening/early detection intervention shifts time zero n Intervention appears to lengthen time to outcome without real change in prognosis n “Lead time” bias 5
6
Computation of Lead-Time of Breast Cancer Screening (HIP (Health Insurance Plan) Study) n n Use relation between incidence, prevalence, mean duration Prevalence = Incidence x Mean Duration n Incidence rate of clinical breast cancer = 1. 84/1, 000 per year n Prevalence of pre-clinical breast cancer (from screening) = 2. 73 per 1, 000 n Average duration of pre-clinical breast cancer = 2. 73/1. 84 = 1. 48 years n Assumption: on average, patients are detected halfway through the pre-clinical stage n Lead-time = duration of pre-clinical stage/2=1. 48/2 = 0. 74 years 7
Prognosis Studies Outcomes n Distress (pain, other symptoms) n Disease (cure, progression) n Disability (physical, mental) n Death 8
Measures of Distress n n Subjective experience of disease n e. g. , pain, discomfort, psychological distress, depressive symptoms Sources of information n primarily self-report n for subjects unable to self-report, observational methods may be needed 9
Measures of Disability n n Activities of daily living (ADL) n Independence in: basic ADL (e. g. , feeding, washing); instrumental ADL (e. g. , telephone, money management) Sources of information n observation (performance) n self-report n proxy report 10
Measures of Disease n n n Disease definition n Diagnostic criteria n Clinical measures, pathology etc Time to key events n Progression to another stage Prevalence of disease at specified follow-up time(s) 11
Measures of Mortality/Survival n n n Case-fatality rate (no. die/no. with disease; for short-term acute illnesses) Survival rate (1 -year, 5 -year etc) (no. alive 1, 5 years after treatment begins or after diagnosis) Median survival time (length of time half the study population survives) Relative survival (ratio of observed survival to expected survival if disease was absent) Survival curves (life-tables) 12
Life-Table Methods Why are They Needed? n n n Not needed if all members of a cohort have complete follow-up to death Patients drop out of follow-up studies n How should they be treated? At any point in time in a study, patients have been followed for different periods of time 13
Survival Analysis n What is survival analysis and when do we use it? n What is censored data? n n Kaplan-Meier method to estimate and graph survival curves Comparison of two survival curves
What is Survival Analysis? n Statistical procedure for data analysis when the outcome variable is "time until an event occurs" n Time - days, weeks, months, years from the beginning of follow-up until an event occurs. Time could be age n Event - death, disease incidence, relapse from remission, recovery (i. e. return to work). Assumes only 1 event n Time variable referred to a "survival time" because it gives the time that the person has "survived" (without the event) over some follow-up period n Event is typically referred to as failure (i. e. death, negative human experience)
When Do We Use Survival Analysis? Some Examples n Leukemia patients/time in remission (weeks) n Disease-free cohort/time until heart disease (years) n Elderly (60+) population/time until death (years) n n Parolees (recidivism study) / time until rearrest (weeks) Heart transplants/time until death (months)
What Does Survival Analysis Do? n n n Allows calculation of the probability of developing event (continuous outcome) Can be used to describe survival experience in a single exposure group Compare survival experiences in two or more groups
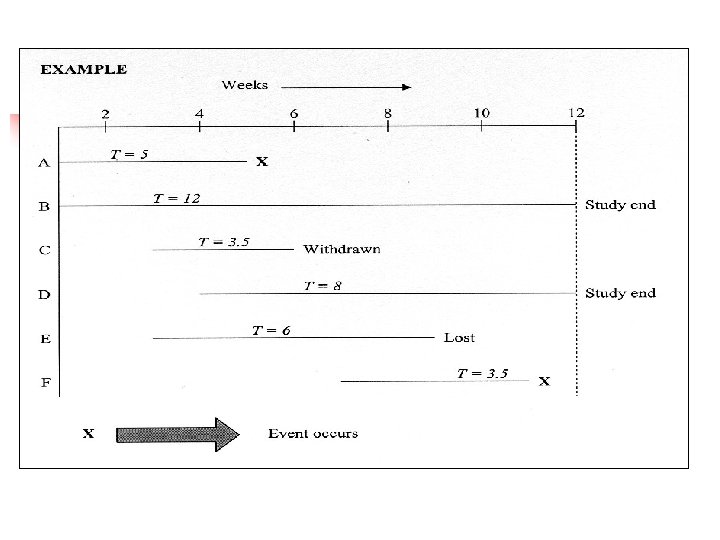
Features of Survival Analysis n n Typically duration of follow-up varies between subjects n First subject enrolled has longest potential duration n Last subject enrolled has shortest potential duration Since study must end (before all subjects experience event), the status of many subjects will be known n Survival analysis takes duration of follow-up into account n Makes maximum use of all data by including data for withdrawn subjects and those lost to follow-up (i. e. censored)
What is Censored Data? n n n Censoring occurs when we have some information about individual survival time, but we don't know the survival time exactly (outcome of interest has not occurred) Three reasons why censoring occurs n Subject does not experience event before study ends n Subject is lost to follow-up (moved; did not attend data collection; could not be contacted) n Subject withdraws from the study Assumption: Reason for censoring is independent of the outcome of interest
Computation of a Survival Curve Example n n Descriptive study of survival in a cohort of 15 adolescents with osteogenic sarcoma (bone cancer) of the femur Treated with leg amputation and chemotherapy at a single tertiary care referral center n First patient began treatment on October 9, 1979 n 14 more patients received treatment n Last patient was enrolled on January 18, 1985
How Can Survival Experience Best Be Summarized? n Mean duration of survival n Overall survival rate n n-year survival rate n Person-year approach n Survival analysis
Mean Duration of Survival n n Least desirable Main problem is that duration of survival is not known for n n n = 2 patients withdrawn n = 9 patients alive at end of study If duration of FU of 11 patients is included, survival will be underestimated If 11 patients omitted, duration of survival will be biased (i. e. short and unrepresentative) Mean is also unduly affected by outliers
Overall Rate of Survival n n n Requires a numerator and denominator but who should be included in denominator? If n = 2 patients withdrawn are included then survival rate is 11/15 = 73% which could be too optimistic if one or both die subsequently Main problem is lack of information on duration of followup n with a 2 -year FU, survival rate = 100% n with a 100 -year FU, survival rate = 0%
n-Year Survival Rate (i. e. 1, 2, 5 -year survival rate) n n n Includes duration of FU but does not resolve the denominator problem (patients lost to FU) n 1 patient survived 5 years n 4 patients died in 5 years n 10 lost to FU or still alive at the end of the study 5 -year survival rate: n 1/15 = 6. 7% if n = 10 included n 1/5 = 20% if n = 10 excluded 5 -year mortality: n 4/15 = 27%
Person-Year Approach n n n Sums person-time of FU for each individual and uses this as the denominator Thus patients lost to FU and those alive at the end of the study contribute to the denominator Problem can occur if the risk of outcome is not constant over time (i. e. 100 person-years can accumulate with 50 patients followed for 2 years or 2 patients followed for 50 years)
Survival Analysis n n n Has features of the person-year approach Uses data from all study subjects regardless of duration of FU (i. e. analysis of choice when the length of FU differs between subjects) Does not require a constant risk over time
Kaplan-Meier Method Requirements (1) n Clear indication of starting point (zero time) n n n Usually time of first exposure If exposure is disease, zero-time might be difficult to ascertain (onset of symptoms? time of diagnosis? time of first treatment? ) "Event" must be well-defined n n n Dichotomous Not subject to multiple episodes (i. e. first MD visit, first hospitalization) Should decide if all outcome events will be included or only those attributable to a specific disease Each row defined by when next subject experiences the event n Exact time of event must be known for each subject event n
Kaplan-Meier Method Requirements (2) n n n Withdrawn subjects (lost to FU and still alive at end of study) assumed to be at risk of outcome up to and including the time they are withdrawn Subjects withdrawn between rows are used to calculate the outcome rate for the first of the two rows, but not the second Only subjects known to be at risk at the time of each outcome event are used to calculate the rate at that time
Kaplan-Meier Method Assumptions Losses to FU should be independent of event n n n If osteosarcoma patients were transferred to hospice care when the disease became unresponsive to treatment, n = 4 deaths would have been counted as withdrawals and survival = 100% Survival analysis assumes that subjects lost to FU have an identical prognosis as those remaining in the cohort Risk of event is independent of calendar time Prognosis of subjects entering the study early is the same as those enrolled at the end Assumes no major secular changes in prognosis for the overall cohort
Kaplan-Meier Survival Curve n Shows probability of event as a function of time n Plot is a step function which "jumps" n n Height of the curve at any time (horizontal axis) gives probability of survival beyond that time Methods are available to compute SE (and confidence intervals) for survival estimates
Comparison of Survival Curves in Two Exposure Groups n n Usually, we want to compare survival curves in two (or more) subgroups with different exposures Life tables are calculated for each exposure groups Two survival curves can be tested for statistically significant differences using a Z-test, or a non parametric log rank test Control for confounding in comparing two survival curves can be achieved through: n Stratification (strata defined by the cofounder) n Multivariate statistical modelling (i. e. Cox's proportional hazards model)
Cox Proportional Hazards Analysis n n n Multivariate technique, allowing adjustment for covariates (confounding variables) Similar to multiple logistic regression, except that dependent variable is time to outcome Hazard ratio (HR) interpretation similar to risk ratio 33