
Natural Haze Levels II Application of the New


- Slides: 21
Natural Haze Levels II: Application of the New IMPROVE Algorithm to Natural Species Concentrations Estimates Final Report by the Natural Haze Levels II Committee to the RPO Monitoring/Data Analysis Workgroup
Note: This presentation contains substantial additional information in the notes section of Power. Point that can be seen in the bottom panel of the “Normal” view mode, and can be printed by selecting “Notes Pages” from the “Print what” selection of the “Print” menu (go to “Files” on the top tool bar and select “Print”). You can also use “Preview” for the “Notes Pages” to more easily read the notes on your computer monitor. These notes were prepared 1. to aid those hearing the presentation by relieving them of the burden of taking as many notes; 2. to allow those who haven’t heard the presentation to understand it by providing the additional information that is spoken during presentations; and 3. to provide a more complete documentation of the natural haze levels II approach for anyone who may want to understand it 4. For additional information contact Marc Pitchford at Marc. Pitchford@NOAA. gov
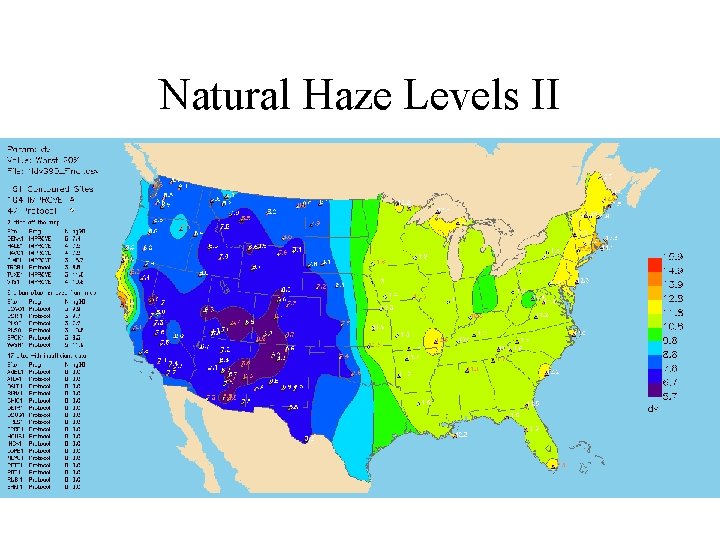
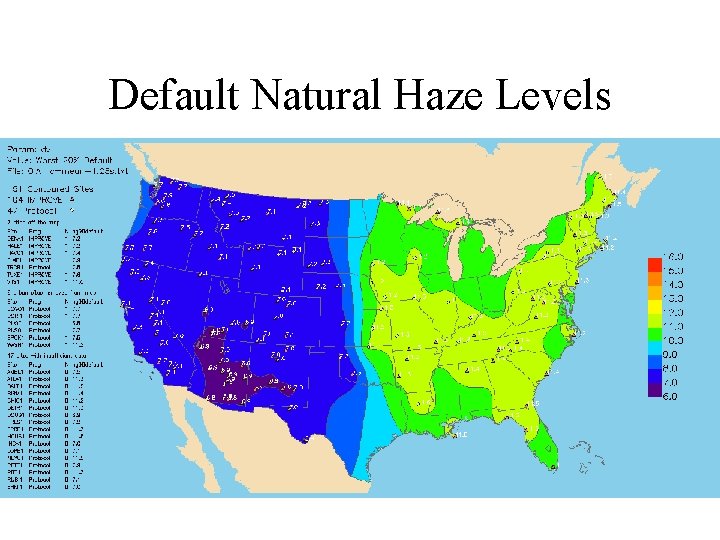
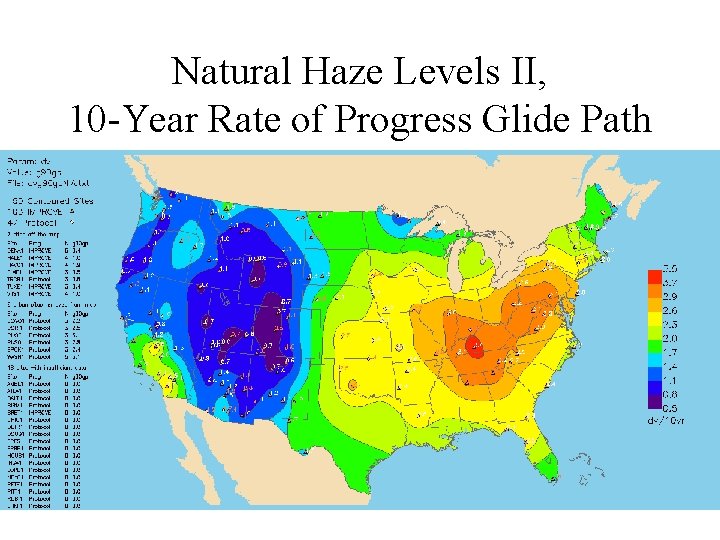
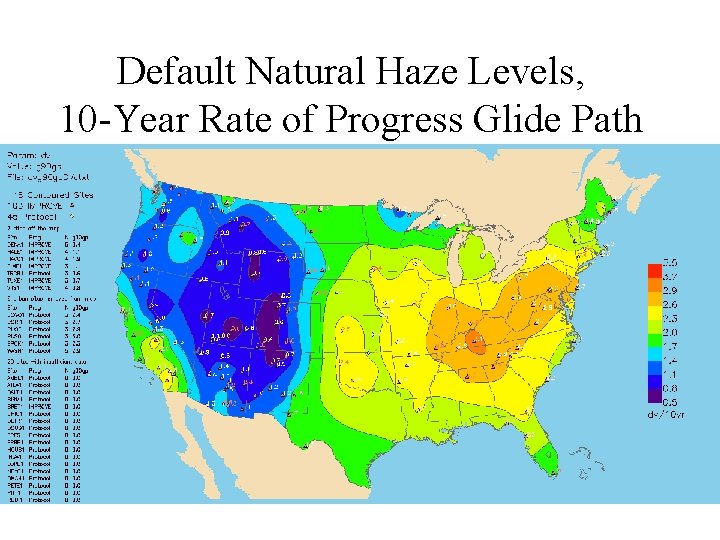
Overall Goal • Estimate 20% best and 20% worst natural haze levels for visibility-protected class I areas using the new IMPROVE algorithm for estimating light extinction from aerosol species concentrations. – Needed for Regional Haze Rule (RHR) rate of progress glide slopes where the new IMPROVE algorithm is used to characterize current haze levels – Should minimize the technical problems identified in the RHR default natural haze levels that were developed using the original IMPROVE algorithm
Default Natural Haze Levels Approach • Typical haze level estimates for East and West – Typical light extinction by applying the original IMPROVE algorithm to Trijonis natural species concentration estimates for East and West – Convert to haze index (deciview units) • 20% best and 20% worst haze estimate for East and West – Best = typical – 1. 28(standard deviation) – Worst = typical + 1. 28(standard deviation) – Standard deviation is 3 dv for the East and 2 dv for the West (corresponds to the 10 th and 90 th percentile)
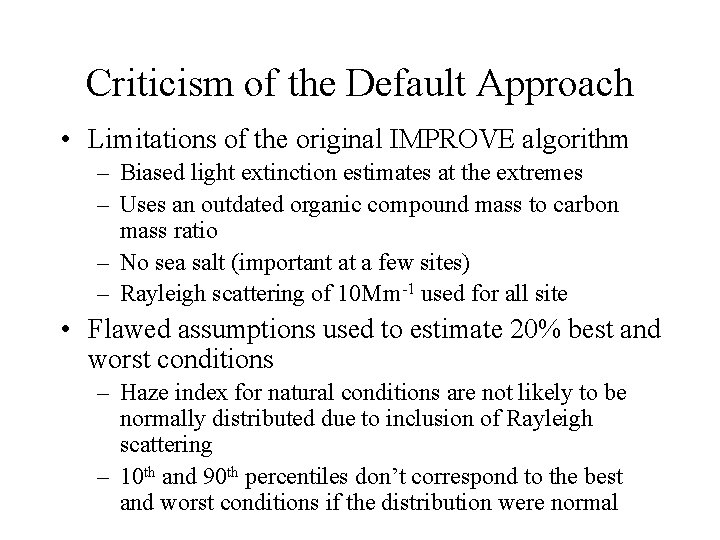
Criticism of the Default Approach • Limitations of the original IMPROVE algorithm – Biased light extinction estimates at the extremes – Uses an outdated organic compound mass to carbon mass ratio – No sea salt (important at a few sites) – Rayleigh scattering of 10 Mm-1 used for all site • Flawed assumptions used to estimate 20% best and worst conditions – Haze index for natural conditions are not likely to be normally distributed due to inclusion of Rayleigh scattering – 10 th and 90 th percentiles don’t correspond to the best and worst conditions if the distribution were normal
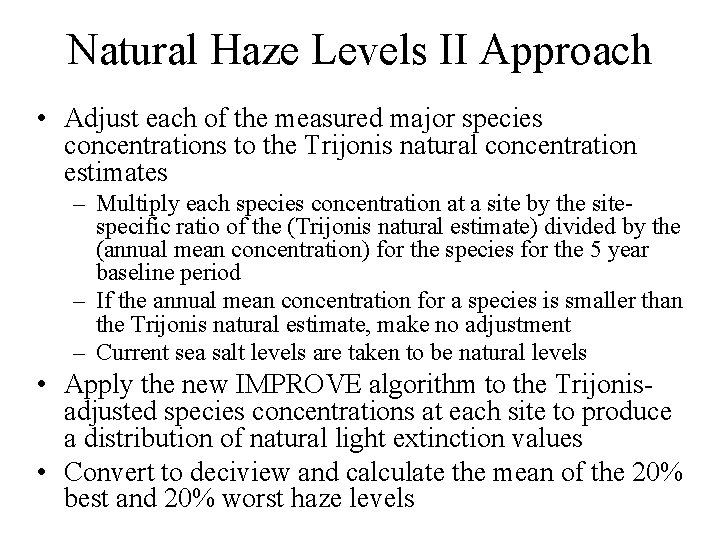
Natural Haze Levels II Approach • Adjust each of the measured major species concentrations to the Trijonis natural concentration estimates – Multiply each species concentration at a site by the sitespecific ratio of the (Trijonis natural estimate) divided by the (annual mean concentration) for the species for the 5 year baseline period – If the annual mean concentration for a species is smaller than the Trijonis natural estimate, make no adjustment – Current sea salt levels are taken to be natural levels • Apply the new IMPROVE algorithm to the Trijonisadjusted species concentrations at each site to produce a distribution of natural light extinction values • Convert to deciview and calculate the mean of the 20% best and 20% worst haze levels
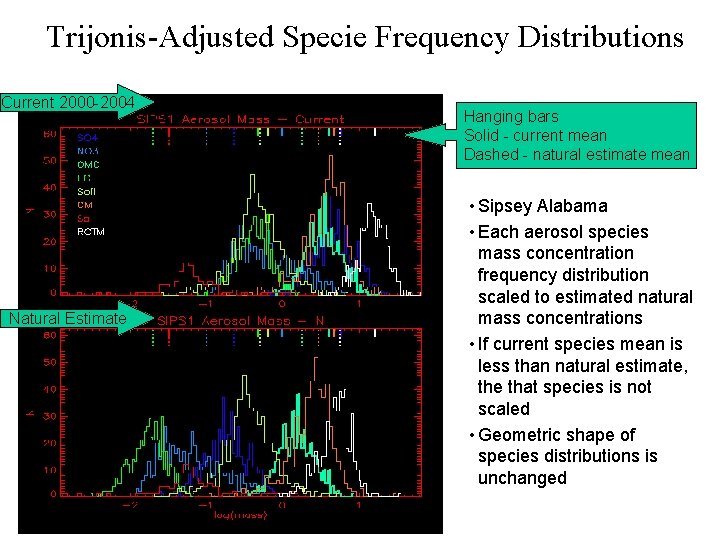
Trijonis-Adjusted Specie Frequency Distributions Current 2000 -2004 Natural Estimate Hanging bars Solid - current mean Dashed - natural estimate mean • Sipsey Alabama • Each aerosol species mass concentration frequency distribution scaled to estimated natural mass concentrations • If current species mean is less than natural estimate, the that species is not scaled • Geometric shape of species distributions is unchanged
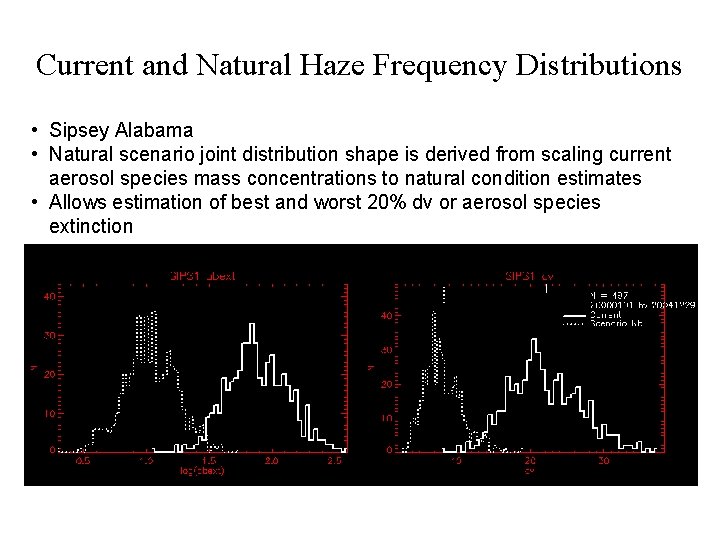
Current and Natural Haze Frequency Distributions • Sipsey Alabama • Natural scenario joint distribution shape is derived from scaling current aerosol species mass concentrations to natural condition estimates • Allows estimation of best and worst 20% dv or aerosol species extinction
Natural Haze Levels II
Default Natural Haze Levels
Natural Haze Levels II, 10 -Year Rate of Progress Glide Path
Default Natural Haze Levels, 10 -Year Rate of Progress Glide Path
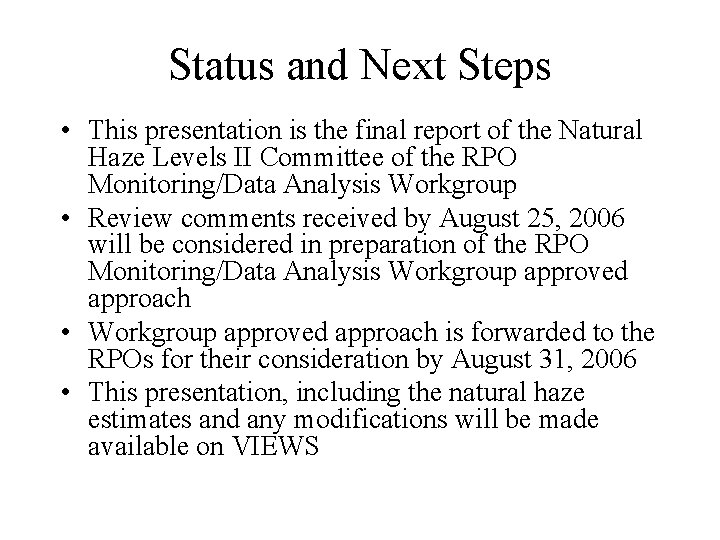
Status and Next Steps • This presentation is the final report of the Natural Haze Levels II Committee of the RPO Monitoring/Data Analysis Workgroup • Review comments received by August 25, 2006 will be considered in preparation of the RPO Monitoring/Data Analysis Workgroup approved approach • Workgroup approved approach is forwarded to the RPOs for their consideration by August 31, 2006 • This presentation, including the natural haze estimates and any modifications will be made available on VIEWS
Appendix • Tables of Natural Haze Level II Estimates for all IMPROVE Sites by RPO and State
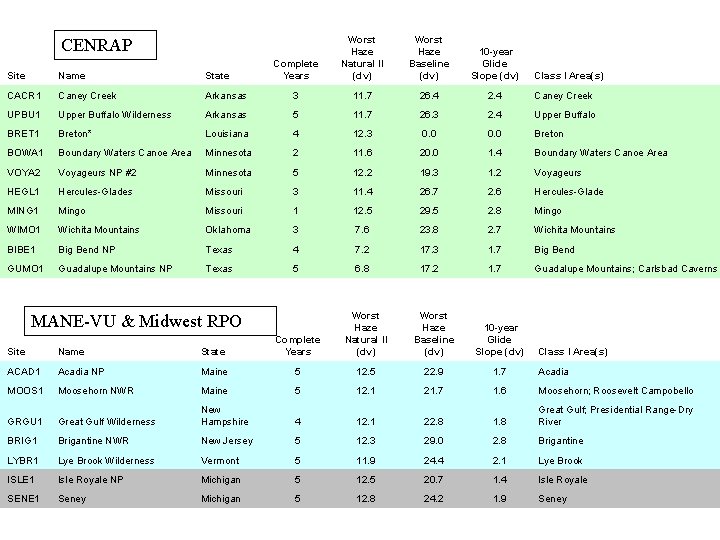
Complete Years Worst Haze Natural II (dv) Worst Haze Baseline (dv) 10 -year Glide Slope (dv) CENRAP Site Name State CACR 1 Caney Creek Arkansas 3 11. 7 26. 4 2. 4 Caney Creek UPBU 1 Upper Buffalo Wilderness Arkansas 5 11. 7 26. 3 2. 4 Upper Buffalo BRET 1 Breton* Louisiana 4 12. 3 0. 0 Breton BOWA 1 Boundary Waters Canoe Area Minnesota 2 11. 6 20. 0 1. 4 Boundary Waters Canoe Area VOYA 2 Voyageurs NP #2 Minnesota 5 12. 2 19. 3 1. 2 Voyageurs HEGL 1 Hercules-Glades Missouri 3 11. 4 26. 7 2. 6 Hercules-Glade MING 1 Mingo Missouri 1 12. 5 29. 5 2. 8 Mingo WIMO 1 Wichita Mountains Oklahoma 3 7. 6 23. 8 2. 7 Wichita Mountains BIBE 1 Big Bend NP Texas 4 7. 2 17. 3 1. 7 Big Bend GUMO 1 Guadalupe Mountains NP Texas 5 6. 8 17. 2 1. 7 Guadalupe Mountains; Carlsbad Caverns MANE-VU & Midwest RPO Worst Haze Natural II (dv) Worst Haze Baseline (dv) 10 -year Glide Slope (dv) Class I Area(s) Site Name State Complete Years ACAD 1 Acadia NP Maine 5 12. 5 22. 9 1. 7 Acadia MOOS 1 Moosehorn NWR Maine 5 12. 1 21. 7 1. 6 Moosehorn; Roosevelt Campobello GRGU 1 Great Gulf Wilderness New Hampshire 4 12. 1 22. 8 1. 8 Great Gulf; Presidential Range-Dry River BRIG 1 Brigantine NWR New Jersey 5 12. 3 29. 0 2. 8 Brigantine LYBR 1 Lye Brook Wilderness Vermont 5 11. 9 24. 4 2. 1 Lye Brook ISLE 1 Isle Royale NP Michigan 5 12. 5 20. 7 1. 4 Isle Royale SENE 1 Seney Michigan 5 12. 8 24. 2 1. 9 Seney Class I Area(s)
VISTAS + VI Complet e Years Worst Haze Natural II (dv) Worst Haze Baseline (dv) 10 -year Glide Slope (dv) Site Name State Class I Area(s) SIPS 1 Sipsy Wilderness Alabama 4 11. 1 29. 0 3. 0 Sipsey CHAS 1 Chassahowitzka NWR Florida 3 11. 3 26. 1 2. 5 Chassahowitzka EVER 1 Everglades NP Florida 4 12. 3 22. 3 1. 7 Everglades SAMA 1 St. Marks Florida 2 11. 6 26. 0 2. 4 Saint Marks COHU 1 Cohutta Georgia 2 11. 2 30. 3 3. 2 Cohutta OKEF 1 Okefenokee NWR Georgia 5 11. 5 27. 1 2. 6 Okefenokee; Wolf Island MACA 1 Mammoth Cave NP Kentucky 5 11. 2 31. 4 3. 4 Mammoth Cave LIGO 1 Linville Gorge North Carolina 4 11. 3 28. 8 2. 9 Linville Gorge SHRO 1 Shining Rock Wilderness North Carolina 2 11. 6 27. 9 2. 7 Shining Rock SWAN 1 Swanquarter North Carolina 2 12. 0 25. 5 2. 2 Swanquarter ROMA 1 Cape Romain NWR South Carolina 5 12. 2 26. 5 2. 4 Cape Romain GRSM 1 Great Smoky Mountains NP Tennessee 5 11. 3 30. 3 3. 2 Great Smoky Mountains; Joyce Kilmer-Slickrock JARI 1 James River Face Wilderness Virginia 4 11. 2 29. 1 3. 0 James River Face SHEN 1 Shenandoah NP Virginia 5 11. 4 29. 3 3. 0 Shenandoah DOSO 1 Dolly Sods Wilderness West Virginia 5 10. 4 29. 0 3. 1 Dolly Sods; Otter Creek VIIS 1 Virgin Islands NP Virgin Islands 4 10. 8 17. 0 1. 0 Virgin Islands
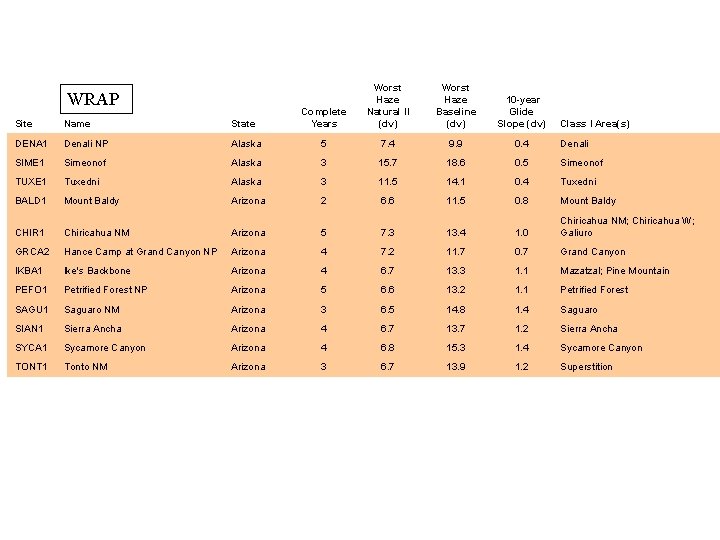
WRAP Worst Haze Natural II (dv) Worst Haze Baseline (dv) 10 -year Glide Slope (dv) Site Name State Complete Years DENA 1 Denali NP Alaska 5 7. 4 9. 9 0. 4 Denali SIME 1 Simeonof Alaska 3 15. 7 18. 6 0. 5 Simeonof TUXE 1 Tuxedni Alaska 3 11. 5 14. 1 0. 4 Tuxedni BALD 1 Mount Baldy Arizona 2 6. 6 11. 5 0. 8 Mount Baldy CHIR 1 Chiricahua NM Arizona 5 7. 3 13. 4 1. 0 Chiricahua NM; Chiricahua W; Galiuro GRCA 2 Hance Camp at Grand Canyon NP Arizona 4 7. 2 11. 7 0. 7 Grand Canyon IKBA 1 Ike's Backbone Arizona 4 6. 7 13. 3 1. 1 Mazatzal; Pine Mountain PEFO 1 Petrified Forest NP Arizona 5 6. 6 13. 2 1. 1 Petrified Forest SAGU 1 Saguaro NM Arizona 3 6. 5 14. 8 1. 4 Saguaro SIAN 1 Sierra Ancha Arizona 4 6. 7 13. 7 1. 2 Sierra Ancha SYCA 1 Sycamore Canyon Arizona 4 6. 8 15. 3 1. 4 Sycamore Canyon TONT 1 Tonto NM Arizona 3 6. 7 13. 9 1. 2 Superstition Class I Area(s)
Complete Years Worst Haze Natural II (dv) Worst Haze Baseline (dv) 10 -year Glide Slope (dv) WRAP Site Name State Class I Area(s) AGTI 1 Agua Tibia California 4 7. 7 23. 5 2. 6 Agua Tibia BLIS 1 Bliss SP (TRPA) California 4 6. 2 12. 6 1. 1 Desolation; Mokelumne DOME 1 Dome Lands Wilderness California 4 7. 5 19. 4 2. 0 Dome Land HOOV 1 Hoover California 3 8. 0 12. 9 0. 8 Hoover JOSH 1 Joshua Tree NP California 4 7. 3 19. 6 2. 1 Joshua Tree KAIS 1 Kaiser California 2 7. 3 14. 8 1. 2 Ansel Adams; Kaiser; John Muir LABE 1 Lava Beds NM California 4 7. 9 15. 1 1. 2 Lava Beds; South Warner LAVO 1 Lassen Volcanic NP California 5 7. 4 14. 1 1. 1 Lassen Volcanic; Caribou; Thousand Lakes PINN 1 Pinnacles NM California 4 8. 1 18. 5 1. 7 Pinnacles; Ventana PORE 1 Point Reyes National Seashore California 3 15. 9 22. 8 1. 2 Point Reyes RAFA 1 San Rafael California 2 7. 8 18. 9 1. 8 San Rafael REDW 1 Redwood NP California 5 14. 0 18. 5 0. 7 Redwood SAGA 1 San Gabriel California 3 7. 1 19. 9 2. 1 San Gabriel; Cucamonga SAGO 1 San Gorgonio Wilderness California 4 7. 4 22. 2 2. 5 San Gorgonio; San Jacinto SEQU 1 Sequoia NP California 3 7. 6 24. 6 2. 8 Sequoia; Kings Canyon TRIN 1 Trinity California 3 8. 3 16. 3 1. 3 Marble Mountain; Yolla Bolly-Middle Eel YOSE 1 Yosemite NP California 5 7. 7 17. 6 1. 7 Yosemite; Emigrant
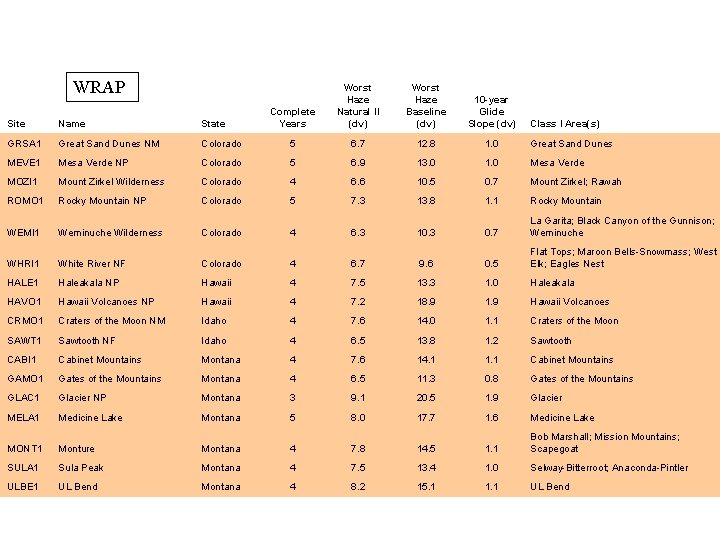
WRAP Complete Years Worst Haze Natural II (dv) Worst Haze Baseline (dv) 10 -year Glide Slope (dv) Site Name State Class I Area(s) GRSA 1 Great Sand Dunes NM Colorado 5 6. 7 12. 8 1. 0 Great Sand Dunes MEVE 1 Mesa Verde NP Colorado 5 6. 9 13. 0 1. 0 Mesa Verde MOZI 1 Mount Zirkel Wilderness Colorado 4 6. 6 10. 5 0. 7 Mount Zirkel; Rawah ROMO 1 Rocky Mountain NP Colorado 5 7. 3 13. 8 1. 1 Rocky Mountain WEMI 1 Weminuche Wilderness Colorado 4 6. 3 10. 3 0. 7 La Garita; Black Canyon of the Gunnison; Weminuche WHRI 1 White River NF Colorado 4 6. 7 9. 6 0. 5 Flat Tops; Maroon Bells-Snowmass; West Elk; Eagles Nest HALE 1 Haleakala NP Hawaii 4 7. 5 13. 3 1. 0 Haleakala HAVO 1 Hawaii Volcanoes NP Hawaii 4 7. 2 18. 9 1. 9 Hawaii Volcanoes CRMO 1 Craters of the Moon NM Idaho 4 7. 6 14. 0 1. 1 Craters of the Moon SAWT 1 Sawtooth NF Idaho 4 6. 5 13. 8 1. 2 Sawtooth CABI 1 Cabinet Mountains Montana 4 7. 6 14. 1 1. 1 Cabinet Mountains GAMO 1 Gates of the Mountains Montana 4 6. 5 11. 3 0. 8 Gates of the Mountains GLAC 1 Glacier NP Montana 3 9. 1 20. 5 1. 9 Glacier MELA 1 Medicine Lake Montana 5 8. 0 17. 7 1. 6 Medicine Lake MONT 1 Monture Montana 4 7. 8 14. 5 1. 1 Bob Marshall; Mission Mountains; Scapegoat SULA 1 Sula Peak Montana 4 7. 5 13. 4 1. 0 Selway-Bitterroot; Anaconda-Pintler ULBE 1 UL Bend Montana 4 8. 2 15. 1 1. 1 UL Bend
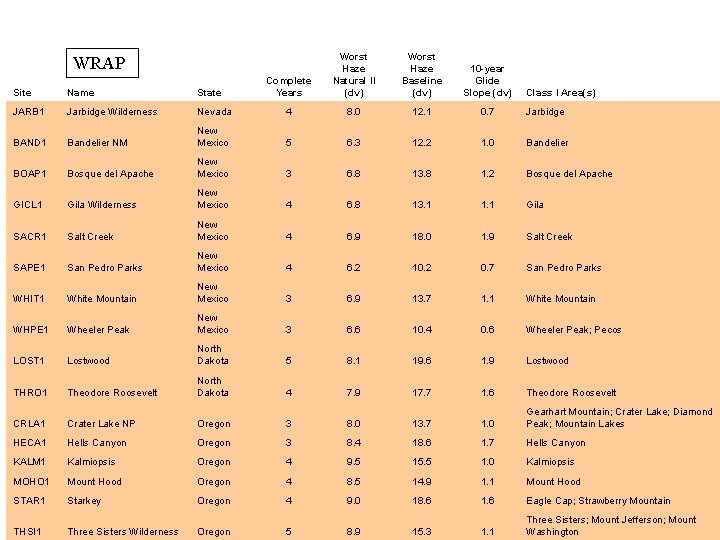
Complete Years Worst Haze Natural II (dv) Worst Haze Baseline (dv) 10 -year Glide Slope (dv) WRAP Site Name State Class I Area(s) JARB 1 Jarbidge Wilderness Nevada 4 8. 0 12. 1 0. 7 Jarbidge BAND 1 Bandelier NM New Mexico 5 6. 3 12. 2 1. 0 Bandelier BOAP 1 Bosque del Apache New Mexico 3 6. 8 13. 8 1. 2 Bosque del Apache GICL 1 Gila Wilderness New Mexico 4 6. 8 13. 1 1. 1 Gila SACR 1 Salt Creek New Mexico 4 6. 9 18. 0 1. 9 Salt Creek SAPE 1 San Pedro Parks New Mexico 4 6. 2 10. 2 0. 7 San Pedro Parks WHIT 1 White Mountain New Mexico 3 6. 9 13. 7 1. 1 White Mountain WHPE 1 Wheeler Peak New Mexico 3 6. 6 10. 4 0. 6 Wheeler Peak; Pecos LOST 1 Lostwood North Dakota 5 8. 1 19. 6 1. 9 Lostwood THRO 1 Theodore Roosevelt North Dakota 4 7. 9 17. 7 1. 6 Theodore Roosevelt CRLA 1 Crater Lake NP Oregon 3 8. 0 13. 7 1. 0 Gearhart Mountain; Crater Lake; Diamond Peak; Mountain Lakes HECA 1 Hells Canyon Oregon 3 8. 4 18. 6 1. 7 Hells Canyon KALM 1 Kalmiopsis Oregon 4 9. 5 15. 5 1. 0 Kalmiopsis MOHO 1 Mount Hood Oregon 4 8. 5 14. 9 1. 1 Mount Hood STAR 1 Starkey Oregon 4 9. 0 18. 6 1. 6 Eagle Cap; Strawberry Mountain THSI 1 Three Sisters Wilderness Oregon 5 8. 9 15. 3 1. 1 Three Sisters; Mount Jefferson; Mount Washington
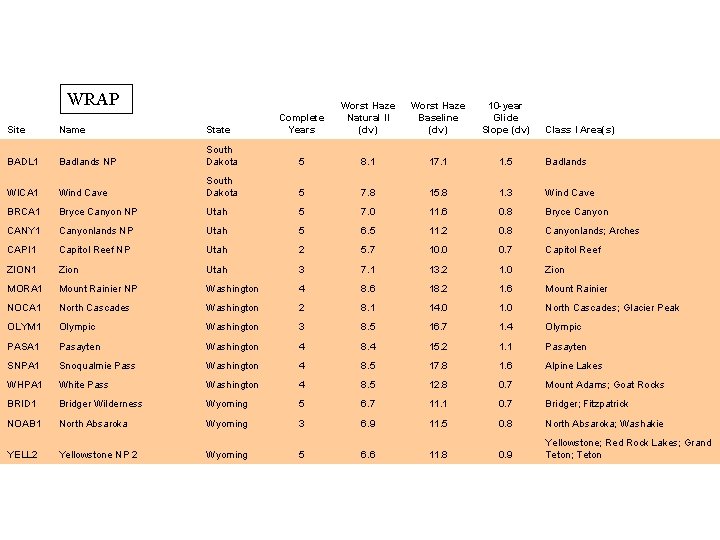
WRAP Complete Years Worst Haze Natural II (dv) Worst Haze Baseline (dv) 10 -year Glide Slope (dv) Site Name State Class I Area(s) BADL 1 Badlands NP South Dakota 5 8. 1 17. 1 1. 5 Badlands WICA 1 Wind Cave South Dakota 5 7. 8 15. 8 1. 3 Wind Cave BRCA 1 Bryce Canyon NP Utah 5 7. 0 11. 6 0. 8 Bryce Canyon CANY 1 Canyonlands NP Utah 5 6. 5 11. 2 0. 8 Canyonlands; Arches CAPI 1 Capitol Reef NP Utah 2 5. 7 10. 0 0. 7 Capitol Reef ZION 1 Zion Utah 3 7. 1 13. 2 1. 0 Zion MORA 1 Mount Rainier NP Washington 4 8. 6 18. 2 1. 6 Mount Rainier NOCA 1 North Cascades Washington 2 8. 1 14. 0 1. 0 North Cascades; Glacier Peak OLYM 1 Olympic Washington 3 8. 5 16. 7 1. 4 Olympic PASA 1 Pasayten Washington 4 8. 4 15. 2 1. 1 Pasayten SNPA 1 Snoqualmie Pass Washington 4 8. 5 17. 8 1. 6 Alpine Lakes WHPA 1 White Pass Washington 4 8. 5 12. 8 0. 7 Mount Adams; Goat Rocks BRID 1 Bridger Wilderness Wyoming 5 6. 7 11. 1 0. 7 Bridger; Fitzpatrick NOAB 1 North Absaroka Wyoming 3 6. 9 11. 5 0. 8 North Absaroka; Washakie YELL 2 Yellowstone NP 2 Wyoming 5 6. 6 11. 8 0. 9 Yellowstone; Red Rock Lakes; Grand Teton; Teton