Natural Hazards and Disaster Lab 5 Seismic Exercises

Natural Hazards and Disaster Lab 5: Seismic Exercises • Review terminology • Earth structure • Exercise 1: Loma Prieta 1989 epicenter and magnitude • Exercise 2: Haiti 2010 http: //earthquake. usgs. gov/eqcenter/rece nteqsus/Maps/US 10/32. 42. -125. -115. php

Laboratory Exercise: Earthquakes See Classes 4 and 5 on Earthquakes are caused by the sudden release of stored energy when an active fault slips. Most faults are in the upper, brittle part of Earth’s crust and are related to tectonic plate boundaries - such as: • Thrust and reverse faults that push crustal blocks upward (e. g. , Himalayas) • Strike-slip faults that have mostly horizontal motion (e. g. , San Andreas) • Extensional faults that allow crustal blocks to slide apart (e. g. , Greece) • Oblique-slip fault systems with displacement that is neither completely horizontal nor entirely vertical (e. g. , Sumatra) • Earthquakes are also caused by crustal flexing in plate interiors (e. g. , New Madrid) and by the movement of magma beneath volcanoes. Large meteor impacts can also cause earthquakes, but these events are relatively rare.

Laboratory Exercise: Earthquakes Earthquake terminology • • When a fault ruptures because stresses across the fault plane exceed the strength of the material, the rupture point within the crust is called the focus (also known as focal point) of the released energy, which travels radially outward in the form of seismic waves. The point on Earth’s surface above the focus is called the epicenter, and the vertical distance from the epicenter to the focus is called the focal depth. P and S waves - Seismic energy is released as compressional waves (P-waves), which can travel through both solids and liquids, and as shear waves (S-waves), which have a side-to-side motion and cannot travel through liquids. P-waves, and the vertical and horizontal planes of S-wave motion, are recorded by seismograms as seismographs at seismic stations around the world. The most damage to property is caused by large-amplitude surface shear waves that can violently shake the ground for several seconds or even minutes. P waves travel faster than S waves. Average P wave velocity in the upper part of the mantle is on the order of 8 km/s while S wave velocity is more like 5 km/s. Therefore it is possible to use their respective arrival times at different seismic stations around the world to estimate both the location and magnitude of the earthquake, a process known as First Motion study. Even though the speed of seismic waves varies according to the depth of an earthquake and the types of crustal rock that the waves travel through, the time interval between the first arrival of P and S waves, usually expressed in seconds, allows for a good estimate of the epicenter – provided that at least 3 different seismic station locations are used to triangulate the epicenter’s location. Earthquake magnitude (expressed as Mw) is an estimate of the energy released, using a base 10 logarithmic scale (i. e. , an Mw 7. 0 releases ten times more energy than an Mw 6. 0 earthquake). Magnitude can be roughly estimated from the maximum amplitude of S waves that are recorded at a known distance from the epicenter.

Laboratory Exercise: Earthquakes A simplified version of a seismogram, showing the first P-wave arrival time, the first S-wave arrival time, and the S-P time interval, all given in seconds. Also note that the amplitudes of P and S-waves is measured in millimeters on this graph.

Laboratory Exercise: Earthquakes Real seismograms for the March 11, 2011 Tohoku, Japan, Mw=9. 0 earthquake.
 At which depths do the S and P-wave")
Laboratory Exercise: Earthquakes Q 1. (a) At which depths do the S and P-wave velocities change suddenly? (b) How are the S-wave and P-wave velocities changing at these depth? (For example, ‘wave velocity decreasing’). Q 2. Why does the S-wave velocity drop to zero at a depth of 2900 km? Q 3. (a) In what way is the P-wave velocity plot different from the S-wave velocity plot between the Earth’s surface and 2900 km depth? (b) In what way is the P-wave velocity plot similar to the S-wave velocity plot between the Earth’s surface and 2900 km depth? Q 4. Where on the graph are (1) the crust, (2) the mantle, (3) the outer core, (4) the inner core Q 5. What are the properties of the different layers labelled 1 -4 in the diagram below? On this diagram the crust is shown thicker than it really is, so that it can be seen. For layer 1, the answer is: (1) ‘P- and S-waves pass through the crust, so it is solid. ’
 A little more than 0 km, at 2900")
Laboratory Exercise: Earthquakes Q 1. (a) A little more than 0 km, at 2900 km and at about 5100 km. (b) Both P- and S-waves show rapid increase in velocity just below the surface (beneath the crust), varying but rising velocities to almost 1000 km depth, then slowly increasing velocities to 2900 km. S- and Pwave velocities drop significantly between about 100 and 250 km depth. In the zone between 2900 km and 5100 km the S-wave velocity is zero Q 2. Wave velocity drops to zero at 2900 km depth, as this is where liquid core starts, and S- (shear) waves cannot travel through liquids. Q 3. (a) P-wave velocity has a higher value and a greater gradient than the S wave velocity plot. P-wave velocity reduces sharply at 2900 km depth but not to zero as S-wave velocity does. (b) The shape of the P-wave and S-wave velocity curve is very similar. Q 4. 1 crust to 20 km, (2) mantle between 20– 2900 km, (3) outer core between 2900– 5100 km, (4) inner core between 5100– 6500 km. Q 5. 2 P-waves travel faster through mantle than S-waves. Mantle is solid 3 S-waves cannot travel through outer core so it is liquid 4 P-and S-waves travel through inner core so it is solid.

Laboratory Exercise: Earthquakes EXERCISE 1: Loma Prieta, California (Adapted from lab exercise of Dr. Gary Novak, Cal State University, Los Angeles) This exercise uses seismic records obtained from three separate seismic stations to estimate (a) the epicenter, and (b) the magnitude of an earthquake that occurred near San Jose, California in 1989. A. Seismogram from Eureka, California seismic station. C. Seismogram from Las Vegas, Nevada seismic station. P-waves travel faster than S-waves, therefore the time for P-waves to travel a specific distance (e. g. , 200 km) is less than the time taken for S-waves to travel the same distance. S-wave minus P-wave (S–P) travel times as measured on a seismogram give the distance of the seismic station to the epicenter. B. Seismogram from Elko, Nevada seismic station.

Laboratory Exercise: Earthquakes EXERCISE 1: Loma Prieta, California (Adapted from lab exercise of Dr. Gary Novak, Cal State University, Los Angeles) This exercise uses seismic records obtained from three separate seismic stations to estimate (a) the epicenter, and (b) the magnitude of an earthquake that occurred near San Jose, California in 1989. A. Seismogram from Eureka, California seismic station. C. Seismogram from Las Vegas, Nevada seismic station. Epicenter estimation 1. To obtain the earthquake’s epicenter, first measure and record the S-P intervals on each of the three seismograms. The S-P interval for: Eureka: _____ Elko: ______ Las Vegas: _____ B. Seismogram from Elko, Nevada seismic station.

Laboratory Exercise: Earthquakes EXERCISE 1: Loma Prieta, California (Adapted from lab exercise of Dr. Gary Novak, Cal State University, Los Angeles) This exercise uses seismic records obtained from three separate seismic stations to estimate (a) the epicenter, and (b) the magnitude of an earthquake that occurred near San Jose, California in 1989. Epicenter estimation 1. To obtain the earthquake’s epicenter, first measure and record the S-P intervals on each of the three seismograms. The S-P interval for: Eureka: _____ Elko: ______ Las Vegas: _____ 2. Use the data you just obtained, together with the S-P travel time graph, to estimate the distance from each seismograph to the epicenter. The distance of the epicenter to: Eureka: ____ Elko: _____ Las Vegas: _______

The S-P interval for: Eureka: _____ Elko: ______ Las Vegas: _____ The distance of the epicenter to: Eureka: ____ Elko: _____ Las Vegas: _______

Laboratory Exercise: Earthquakes EXERCISE 1: Loma Prieta, California (Adapted from lab exercise of Dr. Gary Novak, Cal State University, Los Angeles) This exercise uses seismic records obtained from three separate seismic stations to estimate (a) the epicenter, and (b) the magnitude of an earthquake that occurred near San Jose, California in 1989. Epicenter estimation 1. To obtain the earthquake’s epicenter, first measure and record the S-P intervals on each of the three seismograms. The S-P interval for: Eureka: _____ Elko: ______ Las Vegas: _____ 2. Use the data you just obtained, together with the S-P travel time graph, to estimate the distance from each seismograph to the epicenter. The distance of the epicenter to: Eureka: ____ Elko: _____ Las Vegas: _______ 3. Plot the three seismic stations on the map of California and Nevada. For each station, draw a circle centered on the station with a radius equal to the epicentral distance you have calculated for that station. In the ideal case, the three circles should intersect at the earthquake’s epicenter. In reality, they may not all intersect at exactly the same point due to slight errors in measuring the S-P intervals from the seismograms and/or reading the distances from the S–P graph, or differences in rock types that the waves passed through on their way to the seismic stations. But you should be able to get a good idea of the epicenter’s location. The location of the Loma Prieta earthquake is close to: ___________

Submit this Page with your results The S-P interval for: Eureka: _____ Elko: ______ Las Vegas: _____ The distance of the epicenter to: Eureka: ____ Elko: _____ Las Vegas: _______ The location of the Loma Prieta earthquake is close to: ___________

Laboratory Exercise: Earthquakes EXERCISE 1: Loma Prieta, California (Adapted from lab exercise of Dr. Gary Novak, Cal State University, Los Angeles) This exercise uses seismic records obtained from three separate seismic stations to estimate (a) the epicenter, and (b) the magnitude of an earthquake that occurred near San Jose, California in 1989. The Richter Earthquake Magnitude Nomogram. The standard ‘reference earthquake’ used for this instrument is M=3. 0. Although the Richter magnitude scale is nowadays replaced by the Moment Magnitude (Mw) scale (see your text for details), the nomogram gives a good first approximation of the magnitude of an earthquake. Additional data from multiple seismic stations, and incorporation of the known geology in the region to refine the P- and S-wave speeds, would allow more precise magnitude calculations. 4. To obtain the earthquake’s magnitude, we can use an instrument called a nomogram, which is a simple graph that correlates the amplitude of the S-waves with distance from, and magnitude of, an earthquake (see figure on the left). A standard reference earthquake on the nomogram has Mw 3. 0 with 1. 0 mm of maximum S-wave amplitude on a seismogram at an epicentral distance of 100 km. Using the nomogram, draw a line linking the maximum S-wave amplitude and computed distance from the epicenter for each of the three Loma Pieta seismograms. The three lines should all intersect in the same position on the magnitude scale. Errors in your measurements of amplitude and/or distance may cause the lines to intersect in a region of the nomogram instead of at a point. The 1989 Loma Prieta earthquake magnitude is estimated as: Mw _____.

A. Seismogram from Eureka, California seismic station. C. Seismogram from Las Vegas, Nevada seismic station. The maximum s-wave amplitude is: Eureka: __280____ Elko: ______ Las Vegas: _____ B. Seismogram from Elko, Nevada seismic station.

Submit this Page with your results The distance of the epicenter to: Eureka: ____ Elko: _____ Las Vegas: _______ Maximum s-wave amplitude in mm: Eureka: ____ Elko: _____ Las Vegas: _______ The 1989 Loma Prieta earthquake magnitude is estimated as: Mw _____.

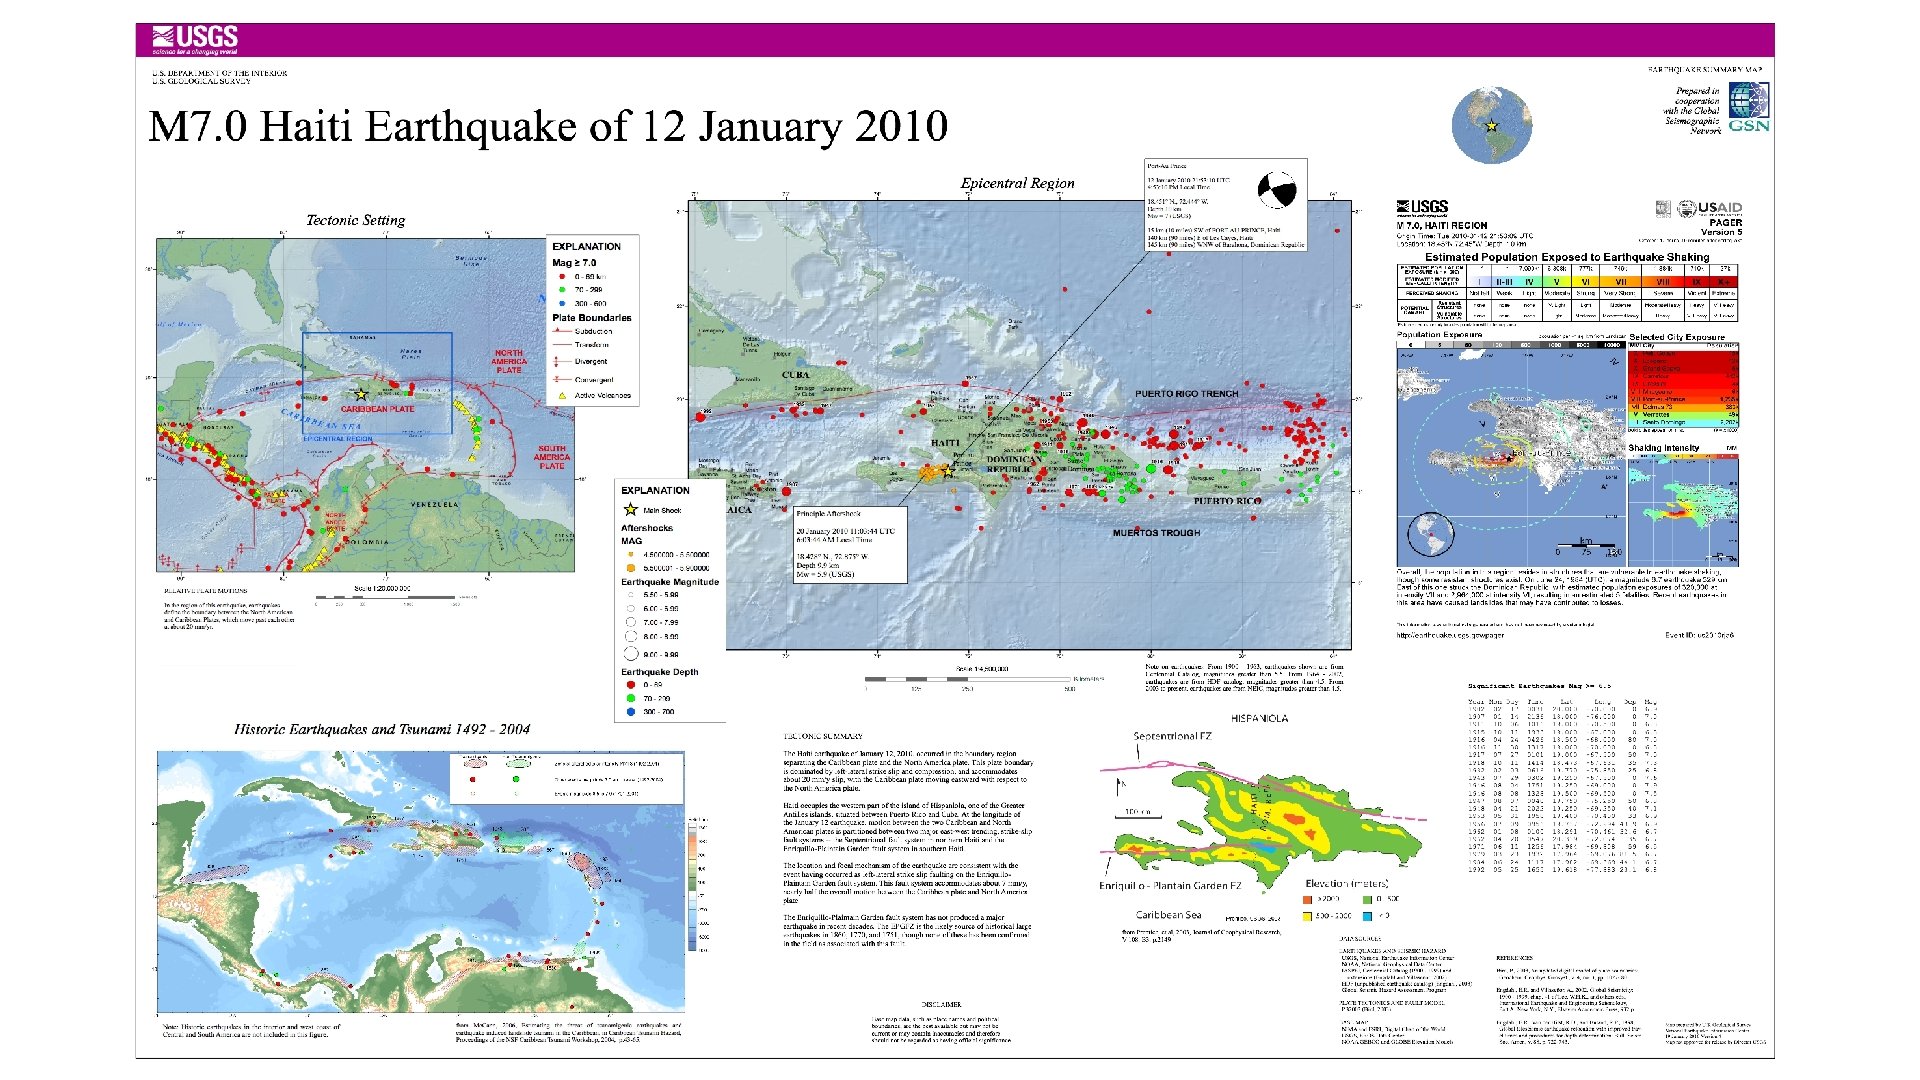
Laboratory Exercise: Earthquakes EXERCISE 2: HAITI, January 12, 2010 Complete the following exercises using the accompanying USGS poster. 1. The first figure on the poster illustrates the complex tectonic setting of the Caribbean Plate (strictly, a microplate) and the different types of plate boundary (i. e. , compressional, extensional, or strike-slip) that exist around its margins. The red lines represent the location of plate boundaries as they intersect the Earth’s surface. • Examine the boundary between the Caribbean Plate and the South Atlantic Plate to the north of Trinidad and Tobago, and east of Puerto Rico. The teeth on the plate boundary line indicate that this is a predominantly compressional boundary, with the South American Plate subducting beneath the Caribbean Plate. • (a) Give at least two pieces of evidence on the map (other than the red line with the teeth) that can justify the interpretation of a compressional plate boundary north of Trinidad-Tobago. • (b) Now examine the Caribbean Plate boundary southwest of Nicaragua. What type of plate boundary is this? • (c) What evidence is there on the map to support your answer in (b) above? 2. The epicenter of an earthquake on January 12, 2010 Mw 7. 0 is indicated by the yellow star, near the city of Port-au-Prince, Haiti, on the island of Hispaniola. The more detailed map of Hispaniola and the small map beneath it show two major strike-slip fault zones that run more -or-less east-west through the island: the Septentrional fault zone (SFZ) in the north and the Enriquillo-Plantain Garden fault zone (EPGFZ) in the south. The main shock of January 2010 and its several aftershocks, including a Mw 5. 9 event, are thought to have occurred along the EPFZ. (a) Using the Significant Earthquake data from the poster, calculate the average Recurrence Interval (R) of earthquakes larger than M w 6. 5 that have affected Hispaniola during the recorded interval of 1902 to 1992. R = N/n, where N is number of years recorded and n is number of events in N years (b) Was the January 2010 earthquake overdue, ‘on-time, ’ or earlier than anticipated, based on your calculated R? What does this tell us about using the recurrence interval to predict when the next big earthquake will occur? 3. The January 12, 2010 earthquake was not the largest to have occurred in the region in the past century. Discuss why that one was particularly devastating for Haitians.
- Slides: 18