National Weatherization Assistance Program Evaluation David Carroll Jackie


 of")

 – – WAP Budget = $250 million")


 442")
 636 Ceiling insulation Floor insulation Air leakage reduction")
 • Floor insulation (2 bags) • Air leakage")


 640")
 • Floor insulation (R-25 over garage) •")

 1170")
 • Garage ceiling (10” dense-pack) • Air")

 2426 • Uninsulated slopes and side attics brought up to R-19 and")


 Net")


 – Emissions Markets –")
 Rate (Ton/MMBtu) Value")
 Rate (Ton/MMBtu) Value ($/Ton) Total Benefits")
 Rate (Ton/MMBtu) Value ($/Ton) Total")


- Slides: 81
National Weatherization Assistance Program Evaluation David Carroll Jackie Berger NEUAC Conference June 10, 2013
Presentation Outline • Evaluation Overview – WAP 2008 / ARRA 2010 – Research Tasks and Reporting Status • Field Studies – Process – Performance • Energy Impacts – Energy Savings / Cost Effectiveness • Non-Energy Impacts – Client – Societal • Summary 2
Program and Evaluation Overview 3
What is WAP? The Weatherization Assistance Program has been in operation for over thirty years and is the nation’s largest single residential energy efficiency program. It’s primary purpose, established by law, is “…to increase the energy efficiency of dwellings owned or occupied by low-income persons, reduce their total residential energy expenditures, and improve their health and safety, especially lowincome persons who are particularly vulnerable such as the elderly, the persons with disabilities, families with children, high residential energy users, and households with high energy burden. ” 4
WAP Logistics • DOE: Grants to states and territories • States: Grants to local weatherization agencies – sometimes supplementing with LIHEAP, State, and/or Utility funds • Local Agencies: Deliver services – sometimes coordinating with LIHEAP, Local and/or Utility SBC programs 5
WAP Services • Typical Weatherization Measures – Air Sealing: Attics, ducts, windows – Insulation: Attics, walls, rim joists – Furnace: Tune-up, repairs, replacement • Other Energy Efficiency Measures – Water Heating: Pipe wrap, showerheads – Electric Measures: Refrigerators, CFLs – Air Conditioning: Tune-up, repairs, sealing 6
WAP Services • Energy efficiency measures need a savings to investment ratio (SIR) of 1. 0 or greater • Spending limits mean that sometimes measures with a SIR > 1. 0 are not installed 7
WAP Services • Health and Safety Measures – Combustion Appliances: Furnace, Water Heater, Stove/Oven, Dryer – Moisture Management: Kitchen and Bathroom Ventilation, Dryer Vents • Health and Safety measures are subject to limits identified in each state WAP Plan 8
WAP Funding • WAP pre-ARRA (PY 2008) – – WAP Budget = $250 million Annual Goal = 100, 000 homes Limit on Average Investment = $3, 000 per home Income Limit = 150% of poverty (or 60% state median) • ARRA Funded WAP – – ARRA Budget = $5 billion Accomplishments = Over 1 million homes weatherized Limit on Average Investment = $6, 500 per home Income Limit = 200% of poverty 9
Evaluation Goals • Impact – – Energy Savings: Measure gas, electric, fuel oil, and LPG savings Cost Savings: Measure first year and measure life savings Nonenergy Benefits: Client and societal Cost-Effectiveness: Energy and nonenergy benefits • Process – Administrative: Document program implementation – Field Studies: Observe audits, installation, and inspections – Case Studies: Identify innovative approaches to weatherization 10
Evaluation Activities • States/Agencies – Grantee Survey – 51 States and the District of Columbia – Subgrantee Survey – 900 Agencies delivering services – Client Data: Collected information for about 60, 000 clients • Energy Data – Gas Data: 30, 000 clients in 400 gas utilities – Electric Data: 50, 000 clients in 1, 000 utilities – Fuel Oil/LPG: Metering studies 11
Evaluation Activities • Field Studies – – – Indoor Air Quality Study: On-site measurement in 500 homes Field Process Study: Observations in 19 agencies nationwide Case Studies: Observations of ten innovative programs Performance Study: Assessment of under/over performance SERC Studies: New technology assessments WIPP Studies: Innovative approaches assessments • Surveys – Occupants: 1, 125 treatment, 800 comparison – Weatherization Staff : 350 auditors, 260 crew chiefs, and 260 crew 12
Evaluation Timing • PY 2008 Evaluation – Program Year: April 2008 – March 2009 – Data Collection and Analysis: May 2010 to January 2011 – Reporting: Summer 2013 • ARRA Evaluation – Program Year: April 2010 – March 2011 – Data Collection and Analysis – July 2012 to June 2013 – Reporting: Fall 2013 13
Field Process Study 14
Field Process Study Tasks • Social Scientists – One week observation at agency • Weatherization manager and staff interviews • Observations –intake, audit, installation, final inspection – Written agency summary report • Weatherization Experts – 3 -Week Observations at Agency • Observations – audit, installation, final inspection – Post Observation Data Entry • Training • Monthly update calls • Final debriefing 15
Field Process Study Focus • • Audit approach and implementation Energy education delivery Measure installation/operation of crews Post-weatherization quality assurance inspection approach and implementation • Client interaction • Interactions among agency staff • Implications for management, procedures, and training 16
Field Process Study Approach • Go beyond anecdotes • Quantify findings across all visits – Develop check lists and rating scales – Train weatherization experts to implement consistently • Enrich data with descriptive information – Examples used to illustrate and clarify – Not used to draw conclusions • Make recommendations for program improvement based on prevalent issues 17
Field Process Study Challenges • Program differs in every state – how to assess jobs? • Consistent implementation of assessment tool – Design, training, data review • Remaining observers, rather than trainers, coaches, mentors 18
Field Process Study Observations Audit Measure Installation Final Inspection Total Number of Observations Social Wx Expert Total Scientist 43 112 155 45 114 159 37 91 128 125 317 442 19
Audit Findings • • • Opportunities Utilize energy bills Increase client engagement Identify client-specific opportunities for reducing energy use Auditor understanding of pressure boundaries Auditor understanding of testing purpose and procedures Conduct worst case draft testing • • Strengths Respect and concern for clients Explanation of WAP program and process Use of data collection forms Auditors meet with contractors to explain audit findings and work scope 20
Installation Findings • • • Opportunities Increased use of blower door when air sealing Respect for clients’ homes (booties, covering furniture) Crew member safety Increased assessment of HVAC contractors Explain CFLs when installing Client education • • Strengths Crew flexibility and dedication Crew problem solving Some very high quality work Experienced HVAC contractors 21
Final Inspection Findings Opportunities • Increased client education • – Explain measures installed – Reinforce client action plan • Improved testing quality • Increased assessment of installation quality • Reduced use of auditor to conduct final inspection – additional perspective • • • Strengths Good job when following work order closely Time saved when contractor attends Information to clients – who to call if they have problems Referrals to additional assistance programs 22
Recommendations Training • • • Energy bill utilization – to assess needs and educate clients Building science fundamentals Critical thinking – assessing unique situations Combustion safety testing Zonal pressure testing IR camera use Ventilation assessment Safe work practices – worker safety and lead safe work Interviewing skills – how to understand the client’s needs Client education Equipment Needs • • GPS IR camera Boroscope and fiber optic scope and video Personal safety equipment Management Opportunities • • • Standards and procedures Policy manuals Forms and checklists 23
Performance Study Note: Slides Prepared by Scott Pigg, Energy Center of Wisconsin 24
Study Overview • Study Design / Implementation – Focus on Single Family Homes – Identify Energy Savings Outliers – Develop Geographic Clusters – Sample 20 Clusters Nationwide – Recruit and Inspect 6 Homes Per Agency – Document Findings for Individual Homes – Summarize Findings for Population 25
Study Overview • Question – What factors lead to under/ overperformance relative to the model? – – – Program Targeting? Treatment Protocols? Measure Selection? Installation Quality/Completeness? Measurement Error? Client Take-Back/Give-Back? • Answer – Yes … but how much of each? 26
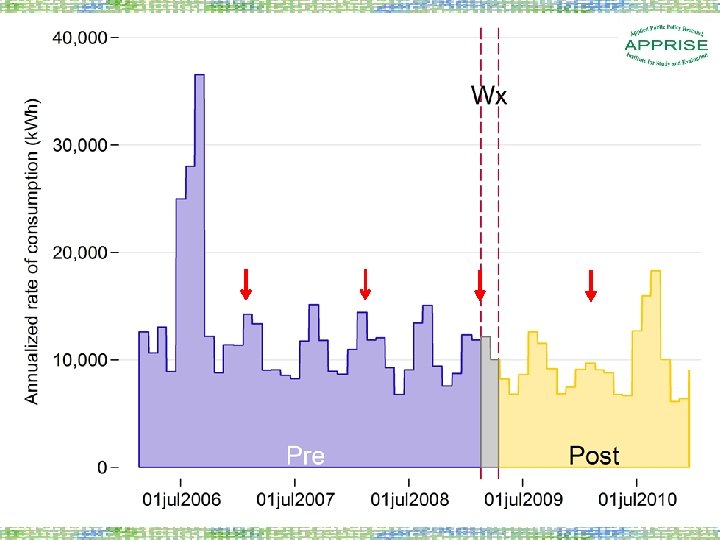
Case 1: -28% savings
2348 -0038 (ID) 442
• • 7012 --0118 (MO) 636 Ceiling insulation Floor insulation Air leakage reduction from 2, 000 to 1, 500 CFM 50 Heating system replacement
• Ceiling insulation (4 bags) • Floor insulation (2 bags) • Air leakage reduction from 2, 000 to 1, 500 CFM 50 (measured 2, 100 at time of visit) • Heating system replacement (gas heater broke year before Wx) …and client reported keeping thermostat set higher after Wx (for health reasons)
Logged indoor temperatures from the WAP IAQ study
Net change in indoor temperature following Weatherization: +0. 27 ± 0. 23 F
Case 2: -15% savings
7012 -0118 (MO) 640
• Attic insulation (R-11 to R-38) • Floor insulation (R-25 over garage) • Air leakage reduction from 3, 030 to 2, 200 CFM 50 • Ill-defined pressure thermal/pressure boundary • Significant duct leakage • Electric space heater use
Case 6: 40% savings
8377 -0255(MN) 1170
• Attic insulation (R-5 to R-38) • Garage ceiling (10” dense-pack) • Air leakage reduction from 2, 040 to 1, 300 CFM 50
Case 7: 52% savings
5666 -0367(WI) 2426 • Uninsulated slopes and side attics brought up to R-19 and R-38 • Wall insulation (interior blow) • Condensing furnaces (2) • Air leakage reduction from 4, 890 to 3, 940 CFM 50
• Client reduced temperature from 77 to 70 F • Upstairs no longer occupied or heated • Some electric space heat use (more prior to Wx)
Pre-weatherization Gas Consumption 2, 430 therms/yr 1, 170 therms/yr 1, 140 therms/yr 420 therms/yr 270 therms/yr 442 therms/yr
Preliminary Observations • We found that… – Homes with low pre-usage have low savings / but you need to serve some of these homes anyway. – Good work in homes with savings potential leads to high savings – Doing only part of the job leads to missed savings / and sometimes savings opportunities are missed. – Behavior change goes both ways / cold homes get heated / comfortable homes reduce settings 44
Energy Impacts Note: Slides prepared by David Carroll, APPRISE; Michael Blasnik, Blasnik & Associates; and, Greg Dalhoff, Dalhoff Associates, LLC 45
Study Scope • Primary Focus – Detailed analysis of Program Year 2008 • WX Program Year – 4/2008 to 3/2009 • State Program Year – 7/2008 to 6/2009 • Supplemental Information – Usage analysis only for Program Year 2007 • Preliminary Information – Usage analysis for clients served in the first half of Program Year 2009
Logistical Challenges • What clients were served by the program? – Collection of client account information from 51 grantees and 400 subgrantees for PY 2007, 2008, and 2009 clients • What services did those clients receive? – Collection of detailed information on service delivery for program year 2008 for about 19, 000 clients • What is the energy usage of the home before and after weatherization? – Collection of usage data for 57, 000 clients from 4/1/2006 through 3/31/2011.
Usage Data Requirements • PY 2008 Clients – Weatherized between 4/2008 and 6/2009 – Pre-weatherization usage = 12 months prior to weatherization (as early as 4/2007 through 3/2008) – Post-weatherization usage = 12 months after weatherization (as late as 7/2009 through 6/2010) – Data required for analysis of PY 2008 from April 2007 through June 2010 = 39 Months of Usage Data • PY 2007 Clients – Need data from 4/06 through 6/09 • PY 2009 Clients – Need data from 4/08 through 6/11
Usage Data Collection • Natural Gas Main Heat – – Sample of 15, 000 clients per program year Total sample of 45, 000 clients for PY 07, PY 08, and PY 09 Requested data from 368 gas utilities for 45, 000 clients Received data from 71% of utilities for 30, 000 clients (67%) • Natural Gas and Electric Main Heat – – Sample of 19, 000 clients per program year Total sample of 57, 000 clients for PY 07, PY 08, and PY 09 Requested data from 984 electric suppliers for 57, 000 clients Received data from 74% of utilities for 37, 000 clients (67%)
Analysis Challenges • Differences in Weather from Pre-Program Year to Post -Program Year – Use of PRISM (variable base degree day) approach to compare “Weather Normalized” consumption for the two periods • Other factors affecting low income households – Use of a Comparison Group • PY 2008 clients serve as a comparison group for PY 2007 analysis • PY 2009 clients serve as a comparison group for PY 2008 analysis • PY 2007/08 clients served as comparison group for PY 2009 • Attrition from incomplete data or inconsistent data – Use of ORNL model – Use of Fixed Effects regression model
Climate Zones
Gas / SF / Cold Climate vs. Moderate Climate Pre. WX Usage (therms) Net Savings (therms) Savings Percent Cold Climate 1125 209 19% Moderate Climate 868 140 16%
Measure Package Findings – Gas / SF / Cold Climate Percent of Clients Pre. WX Usage (therms) Net Savings (therms) Savings Percent No Major Measures 11% 1052 88 8% Attic Insulation 24% 1036 133 13% Attic + Air Sealing (>1000 cfm 50) 10% 1258 200 16% Attic + Wall Insulation 10% 927 180 19% Attic + Wall + Seal 12% 1216 287 24% Attic/Wall/Seal/Furnace 4% 1180 442 37%
Gas Savings by Major Measures
Pre-WAP Gas Use Avg 08 = 1020 Avg 1989 = 1334
Pre. WX Usage Level Findings – Gas / SF / Cold Climate Pre WX Usage Bin Percent of Clients Pre. WX Usage (therms) Net Savings (therms) Savings Percent Less than 750 therms 19% 614 81 13% 750 -<1000 28% 879 141 16% 1000 -<1250 21% 1124 214 19% 1250 -<1500 15% 1366 278 20% 1500+ 17% 1888 389 21%
Electric Baseload Savings Gas Heat / SF / Cold Climate Percent Pre. WX Net Savings of Clients Usage (k. Wh) Cold Climate Savings Percent 100% 8, 895 666 8% - Refrigerator replaced 19% 9, 287 1, 169 13% - No refrigerator replace 81% 8, 884 549 6%
Single Family Site-Built Findings by Fuel Type – Cold and Moderate Climates Percent of Clients in Region Htg Fuel Savings ($) Elec Savings ($) ECM Cost ($) SIR Natural Gas 65% 3, 034 535 2, 241 1. 6 Fuel Oil 20% 7, 453 515 2, 632 3. 0 Natural Gas 39% 2, 107 675 2, 521 1. 1 Fuel Oil 8% 7, 319 849 3, 464 2. 4 Region and Heating Fuel Cold Moderate
SIR by Number of Major Measures for Gas Heated Houses in the Cold Region Htg Fuel Savings ($) Elec Savings ($) Total Savings ($) ECM Cost ($) SIR None 757 476 1, 233 1, 771 0. 70 One 2, 246 347 2, 593 2, 174 1. 19 Two 3, 376 436 3, 812 2, 623 1. 45 Three 4, 297 832 5, 129 3, 385 1. 52 All Four 6, 112 891 7, 002 5, 343 1. 31 Number of Major Measures Major measures include wall attic insulation, air sealing, and heating system replacement
SIR by Expenditure Level for Gas Heated Houses in the Cold Region Htg Fuel Savings ($) Elec Savings ($) Total Savings ($) ECM Cost ($) SIR 0/1000 1, 623 273 1, 896 640 2. 96 1000/2000 2, 449 469 2, 918 1, 509 1. 93 2000/3000 2, 697 601 3, 299 2, 494 1. 32 3000/4000 3, 323 215 3, 539 3, 497 1. 01 >=4000 4, 523 922 5, 445 5, 331 1. 02 Expenditures ($)
Client Impacts 61
Impact Examples • Dwelling Quality – Indicators of dwelling quality issues that affect client health • Affordability – Indicators related to the client’s ability to pay home energy bills • Behaviors – Indicators of client knowledge or behaviors that affect energy use • Health – Indicators of client health status and their relationship to dwelling quality 62
Dwelling Quality Indicators Pre-Audit Incidence Post-WX Incidence Percent Change Home sometimes at unhealthy temperature 20% 9% -55% Observed standing water in home 33% 19% -42% Frequent mildew odor or musty smell 29% 16% -45% Home somewhat or very infested with insects 25% 17% -32% Home has CO monitor 41% 74% +80% Indicator 63
Affordability Indicators Pre-Audit Incidence Post-WX Incidence Change Got disconnect notice 45% 33% -26% Had natural gas, electricity, or bulk fuel service terminated 18% 9% -50% Went without food to pay energy bills 34% 23% -33% Went without food in the last four weeks 9% 6% -33% Used high interest loan to pay energy bills 20% 12% -40% Indicator 64
Behavior Indicators Pre-Audit Incidence Post-WX Incidence Change Use cooking stove exhaust fan regularly 40% 49% +22% Oven sometimes used to heat home 13% 8% -38% Air filter changed more than once a year 71% 79% +11% Close drapes in summer to block sun 68% 70% +3% Used cross-ventilation to cool home in summer 38% 36% -5% Indicator 65
Health Indicators Pre-Audit Incidence Post-WX Incidence Change Needed medical attention / home too hot or too cold 7% 3% -57% Child too hot or too cold to study 9% 4% -55% Didn’t fill RX to pay energy bill 26% 18% -31% Missed more that one week of work 25% 23% -8% Missed more than one week of school 40% 36% -10% Indicator 66
Client Impact Summary • Dwelling Quality – healthier temperature, fewer moisture issues, more CO monitors • Affordability – Fewer terminations, increased ability to pay for food, reduced high-interest loans • Behaviors – Safer cooking and heating practices • Health – Reduced medical needs, increased ability to study in home, increased ability to pay for medication 67
Societal Impacts 68
Societal Benefits • Environmental – Energy Use Reduction = Avoided Emissions – Benefits = Health / Climate Change / Eco-system • Economic – Weatherization = Economic Activity – Benefits = Jobs / Taxes / Less Unemployment • Social – Weatherization = Improved Housing Quality – Benefits = Neighborhood Effects 69
Environmental Benefits • Climate Change – Reduction in CO 2 Emissions – Benefit Estimation = Defined by OMB • Health – Reductions in SOx, NOx, PM 2. 5 – Benefit Estimation = APEEP Model • Eco-System – Reductions in Energy Production Impacts (Local) 70
Avoided Emissions • Natural Gas, Propane, Fuel Oil – EPA Emissions Factors & AP 42 Files – (Compilation of Air Pollutant Emission Factors) • Electric Power Plants – SOx, NOx, and CO 2 for Power Plants by Egrid Region – PM 2. 5 Emissions from EPA National Emissions Inventory • Methodological Note: Electric power plant emissions have declined over time. 71
Avoided Emissions Value • Options (Schweitzer and Tonn – 2002) – Emissions Markets – Comprehensive Estimation of Benefits • C 02 Valuation – OMB Specified Value • SOx, NOx, PM 2. 5 – National Research Council Report (2010) – APEEP Model (County Level Impacts 72
State Level Example Natural Gas and Propane First Year Savings (MMBtu) Rate (Ton/MMBtu) Value ($/Ton) Total Benefits Benefit/Home CO 2 93, 817 0. 06862745 $21. 40 $137, 782. 74 $34. 27 NOX 93, 817 0. 00004608 $11, 848. 89 $51, 222. 23 $12. 74 PM 2. 5 93, 817 0. 00000093 $143, 388. 60 $12, 529. 14 $3. 12 SO 2 93, 817 0. 00000029 $51, 468. 68 $1, 420. 19 $0. 35 VOC 93, 817 0. 00000270 $13, 743. 64 $3, 476. 30 $0. 86 Total $206, 430. 60 $51. 34 Lifetime Savings (MMBtu) Rate (Ton/MMBtu) Value ($/Ton) Total Benefits Benefit/Home CO 2 1, 864, 679 0. 06862745 $21. 40 $2, 738, 518. 77 $681. 05 NOX 1, 864, 679 0. 00004608 $11, 848. 89 $1, 018, 074. 20 $253. 19 PM 2. 5 1, 864, 679 0. 00000093 $143, 388. 60 $249, 024. 53 $61. 93 SO 2 1, 864, 679 0. 00000029 $51, 468. 68 $28, 227. 23 $7. 02 VOC 1, 864, 679 0. 00000270 $13, 743. 64 $69, 093. 69 $17. 18 Total $4, 102, 938. 42 $1, 020. 38
State Level Example Electricity First Year Savings (MMBtu) Rate (Ton/MMBtu) Value ($/Ton) Total Benefits Benefit/Home CO 2 12, 740 0. 27319754 $21. 40 $74, 485. 94 $18. 52 NOX 12, 740 0. 00029436 $5, 521. 18 $20, 705. 77 $5. 15 PM 2. 5 12, 740 0. 00002972 $53, 960. 76 $20, 434. 62 $5. 08 SO 2 12, 740 0. 00040409 $27, 696. 43 $142, 588. 35 $35. 46 Total $258, 214. 68 $64. 22 Lifetime Savings (MMBtu) Rate (Ton/MMBtu) Value ($/Ton) Total Benefits Benefit/Home CO 2 210, 172 0. 27319754 $21. 40 $1, 228, 752. 40 $305. 58 NOX 210, 172 0. 00029436 $5, 521. 18 $341, 571. 38 $84. 95 PM 2. 5 210, 172 0. 00002972 $53, 960. 76 $337, 098. 41 $83. 83 SO 2 210, 172 0. 00040409 $27, 696. 43 $2, 352, 199. 32 $584. 98 Total $4, 259, 621. 51 $1, 059. 34
State Level Example Fuel Oil First Year Savings (MMBtu) Rate (Ton/MMBtu) Value ($/Ton) Total Benefits Benefit/Home CO 2 4, 864 0. 07971906 $21. 40 $8, 298. 52 $2. 06 NOX 4, 864 0. 00006489 $11, 848. 89 $3, 739. 97 $0. 93 PM 2. 5 4, 864 0. 00000144 $143, 388. 60 $1, 005. 76 $0. 25 SO 2 4, 864 0. 00025955 $51, 468. 68 $64, 982. 09 $16. 16 Total $78, 026. 34 $19. 40 Lifetime Savings (MMBtu) Rate (Ton/MMBtu) Value ($/Ton) Total Benefits Benefit/Home CO 2 95, 412 0. 07971906 $21. 40 $162, 771. 97 $40. 48 NOX 95, 412 0. 00006489 $11, 848. 89 $73, 357. 99 $18. 24 PM 2. 5 95, 412 0. 00000144 $143, 388. 60 $19, 727. 49 $4. 91 SO 2 95, 412 0. 00025955 $51, 468. 68 $1, 274, 596. 59 $316. 98 Total $1, 530, 454. 04 $380. 62
State Level Example Total Savings for All Fuels Combined First Year Total Benefits Benefit/Home CO 2 $220, 567. 19 $54. 85 NOX $75, 667. 98 $18. 82 PM 2. 5 $33, 969. 52 $8. 45 SO 2 $208, 990. 64 $51. 97 VOC $3, 476. 30 $0. 86 Total $542, 671. 63 $134. 96 Lifetime Total Benefits Benefit/Home CO 2 $4, 130, 043. 14 $1, 027. 12 NOX $1, 433, 003. 57 $356. 38 PM 2. 5 $605, 850. 43 $150. 67 SO 2 $3, 655, 023. 13 $908. 98 VOC $69, 093. 69 $17. 18 Total $9, 893, 013. 96 $2, 460. 34
Evaluation Outputs • Evaluation – Estimation by State and Building Type – Reporting at the Climate Zone and National Level • Analysis – Comparison of State / Region /Nation – Comparison by Type of Power Plant • Output – Guidance for States in terms of state-level emissions levels and valuation 77
Summary 78
Key Findings • Benefits – The WAP program … – – Transforms poorly performing and unsafe homes Results in cost-effective energy savings Furnishes non-energy benefits to clients Delivers non-energy benefits to the rest of society • The WAP program could be improved by… – Continuing to invest in management tools, quality control, and training – Findings ways to target homes and services that result in the highest level of benefits to clients 79
Questions 80
Contact Jackie Berger, 609 -252 -8009 Jackie-berger@appriseinc. org David Carroll, 609 -252 -8010 david-carroll@appriseinc. org APPRISE 32 Nassau Street, Suite 200 Princeton, NJ 08540 81