National Health and Nutrition Examination Survey NHANES 2019
 2019 – 2020 Ryne Paulose, M. A.")


 #PSUs Target # examined")
 #PSUs Target #")

- Slides: 27
National Health and Nutrition Examination Survey (NHANES) 2019 – 2020 Ryne Paulose, M. A. , Ph. D. Acting NHANES Director September 18, 2020 NCHS Board of Scientific Counselors Meeting
• BSC Workgroup Meeting June 26 th • Discussed completing NHANES 2019 -2020 data collection and implications for starting NHANES 2021 -2022
BSC Workgroup Meeting June 26 th Tentative Opinions • NHANES should not complete additional sampling for the 2019 -2020 data. • NHANES 2017 -2018 and 2019 -2020 data should be combined to generate a larger dataset supporting better estimates. • Weight the combined 2017 -2020 data using the 2017 -2018 strata as a starting point and evaluate against historicallybased expectations.
After the BSC Workgroup meeting • No further consideration for completing the 2019 -2020 sample • Began planning for 2021 -2022 NHANES data collection • Began QC and editing of collected 2019 -2020 data for combining with 2017 -2018 data
NHANES Data 2017 – 2018 and 2019 – 2020
NHANES 2017 – 2018 Data Release Percent of 2017 -18 NHANES Data Files Released, In Process, or Not Yet Ready (n=152) • First set of 2017– 2018 data released in February 2020. 16% • As of September 1, nearly twothirds of all 2017 -18 data files have been released. 18% 66% # Not Ready # In Process # Released
NHANES 2019 – 2020 Data in process • Over one-quarter of the 20192020 data have begun or completed internal QC review and editing. Percent of 2019 -20 NHANES Data Files In Process (n=160) 27% # Not Ready # In Process
NHANES 2017 – 2020 Survey Weights
NHANES 2017 – 2020 Survey Weights • NCHS received draft weights September 2 nd • Weight creation: Combined 2017 -20 PSUs together, applied factors to account for not having a full sample, and then went through the same weighting process that was done for the final 2017 -18 weights (V 14).
Approach to creating the 2017 – 2020 sampling weights GREG-Adjusted Weights V 2 V 3 V 5 V 6 V 7 V 8 V 7_ b V 9 V 10 V 11 V 12 V 13 V 14 2017− 2020 Added 18 PSUs from 2019 -20 to the 2017 -18 data collection X Created factors to adjust base weights for 48 completed PSUs in a 60 -PSU sample design X GREG adjustment to income and population age 20+ GREG adjustment to NCHS urbanicity GREG adjustment to education NR adjustment using same variables as in 201516 to create cells Adding variables to include in NR adjustment X X Raking to 16 race/ethnicity/PSU size cells Raking to 47 race/ethnicity/sex/age group cells Raking to 28 race/ethnicity/sex/education cells Raking to 10 tract-level household income cells X X X X X X X X X X X X X Adjusting NR separately within each PSU Raking to 74 race/ethnicity/sex/age group cells Raking to 32 race/ethnicity/sex/education cells X X X X X
Approach to creating the 2017 – 2020 sampling weights GREG-Adjusted Weights V 2 V 3 V 5 V 6 V 7 V 8 V 7_ b V 9 V 10 V 11 V 12 V 13 V 14 2017− 2020 Added 18 PSUs from 2019 -20 to the 2017 -18 data collection X Created factors to adjust base weights for 48 completed PSUs in a 60 -PSU sample design X GREG adjustment to income and population age 20+ GREG adjustment to NCHS urbanicity GREG adjustment to education NR adjustment using same variables as in 201516 to create cells Adding variables to include in NR adjustment X X Raking to 16 race/ethnicity/PSU size cells Raking to 47 race/ethnicity/sex/age group cells Raking to 28 race/ethnicity/sex/education cells Raking to 10 tract-level household income cells X X X X X X X X X X X X X Adjusting NR separately within each PSU Raking to 74 race/ethnicity/sex/age group cells Raking to 32 race/ethnicity/sex/education cells X X X X X
Approach to creating the 2017 – 2020 sampling weights GREG-Adjusted Weights V 2 V 3 V 5 V 6 V 7 V 8 V 7_ b V 9 V 10 V 11 V 12 V 13 V 14 2017− 2020 Added 18 PSUs from 2019 -20 to the 2017 -18 data collection X Created factors to adjust base weights for 48 completed PSUs in a 60 -PSU sample design X GREG adjustment to income and population age 20+ GREG adjustment to NCHS urbanicity GREG adjustment to education NR adjustment using same variables as in 201516 to create cells Adding variables to include in NR adjustment X X Raking to 16 race/ethnicity/PSU size cells Raking to 47 race/ethnicity/sex/age group cells Raking to 28 race/ethnicity/sex/education cells Raking to 10 tract-level household income cells X X X X X X X X X X X X X Adjusting NR separately within each PSU Raking to 74 race/ethnicity/sex/age group cells Raking to 32 race/ethnicity/sex/education cells X X X X X
Approach to creating the 2017 – 2020 sampling weights GREG-Adjusted Weights V 2 V 3 V 5 V 6 V 7 V 8 V 7_ b V 9 V 10 V 11 V 12 V 13 V 14 2017− 2020 Added 18 PSUs from 2019 -20 to the 2017 -18 data collection X Created factors to adjust base weights for 48 completed PSUs in a 60 -PSU sample design X GREG adjustment to income and population age 20+ GREG adjustment to NCHS urbanicity GREG adjustment to education NR adjustment using same variables as in 201516 to create cells Adding variables to include in NR adjustment X X Raking to 16 race/ethnicity/PSU size cells Raking to 47 race/ethnicity/sex/age group cells Raking to 28 race/ethnicity/sex/education cells Raking to 10 tract-level household income cells X X X X X X X X X X X X X Adjusting NR separately within each PSU Raking to 74 race/ethnicity/sex/age group cells Raking to 32 race/ethnicity/sex/education cells X X X X X
How were these factors created? • Normally, a 4 -year sample would have 60 PSUs divided evenly into 15 strata, with 4 PSUs in every stratum – But, because the 18 PSUs completed in 2019− 2020 came from a different sample design, some of the 2017− 2018 strata did not have any additional PSUs, and some had as many as 4 additional PSUs • As a result, the 48 total PSUs are divided into 15 strata, where the strata contain between 2 and 6 PSUs. – As a result, the factors were created as 4 divided by the number of PSUs in the stratum. For strata with only 2 PSUs, the factor would be 2. For strata with 6 PSUs, the factor would be 0. 67.
QC of the 2017 − 2020 Sampling Weights • A similar approach to that used for the 2017− 2018 NHANES nonresponse bias and sampling variability assessments: – Comparisons to ACS – Benchmarking to NHIS – Examinations of temporal trends in key health outcomes – Comparison of response rates across subgroups; R-indicator analyses; and level of effort analyses, etc.
Balanced on education and income, as expected, but off on population size
NHANES Data Release 2017 – 2020
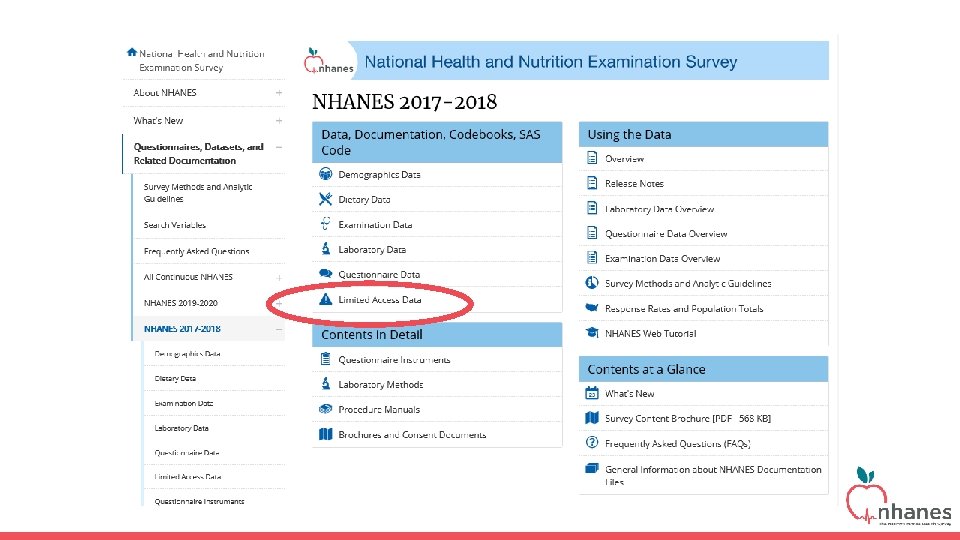
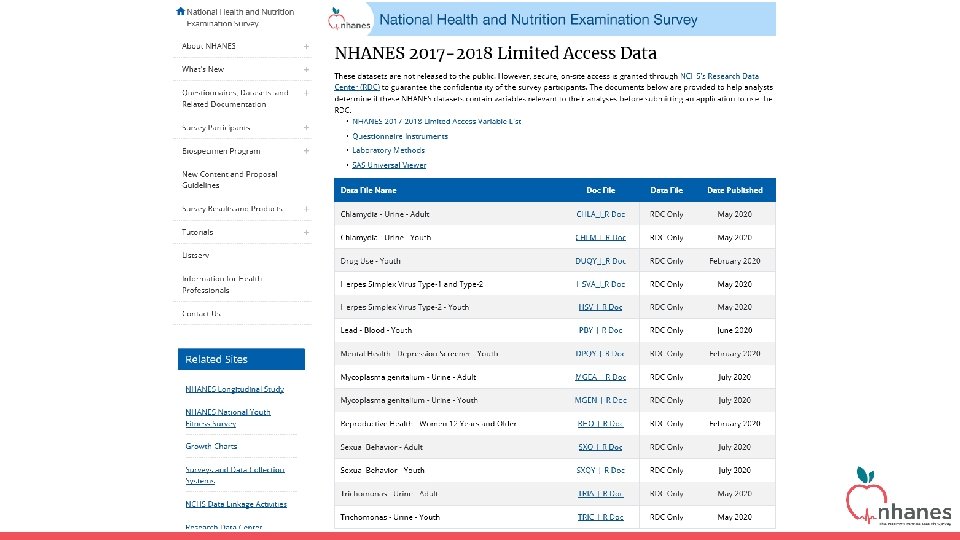
https: //www. cdc. gov/rdc/
NHANES 2017 – 2020 Next Steps
NHANES next steps • Continue with the data QC and editing of 2017 -18 and 2019 -20 data • Continue with the evaluation of the 2017 -20 survey weights • Develop a plan for data release through the RDC
NHANES 2021– 2022
1 Day 56 Stand closes Day 14 MEC opens - 2 to 4 years Sample Selection 5 4 NHANES Operational Cycle 3 Day 1 Stand Opens: In-person screening and interviewing 2 - 3 to 6 mo. Field Listing
NHANES 2021 -2022: Various Restart Options Start Date (for interviewing) #PSUs Target # examined End Date (last exam) April 1, 2021 30 10, 000 April 2023 May 14, 2021 30 10, 000 June 2023 July 2021 30 10, 000 July 2023 28 10, 000 June 2023 26 10, 000 April 2023
NHANES 2021 -2022 : Various Restart Options Start Date (for interviewing) #PSUs Target # examined End Date (last exam) April 1, 2021 30 10, 000 April 2023 May 14, 2021 30 10, 000 June 2023 July 2021 30 10, 000 July 2023 28 10, 000 June 2023 26 10, 000 April 2023 15 5000 or more January 2023 or later December 2021 /January 2022
Questions? • https: //www. cdc. gov/nchs/nhanes