National Emergency Laparotomy Audit The 5 th report


")
 = XX% Regional =")

 = XX% Regional")


- Slides: 43
National Emergency Laparotomy Audit The 5 th report Please edit/delete slides for your own local use as required; these slides aim to support local teams in presenting their own data to multidisciplinary teams
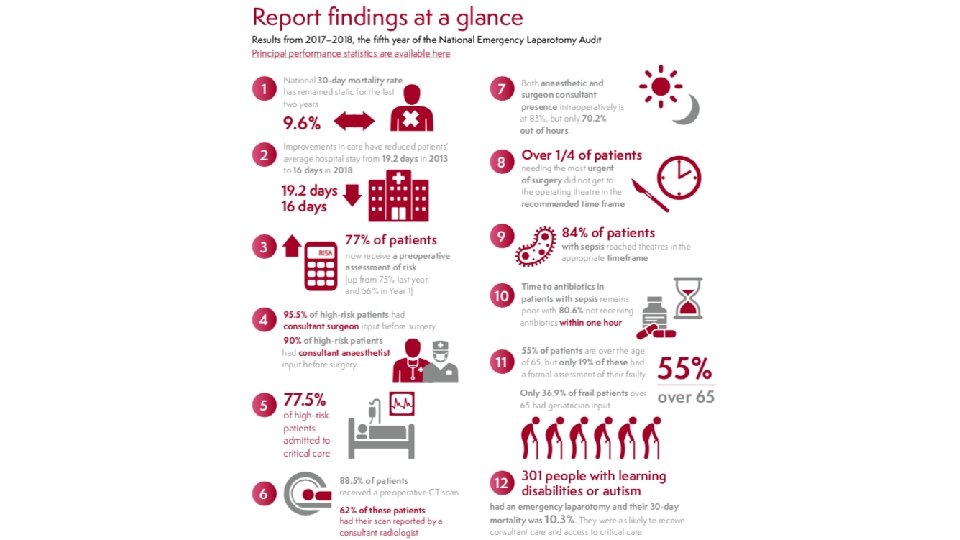
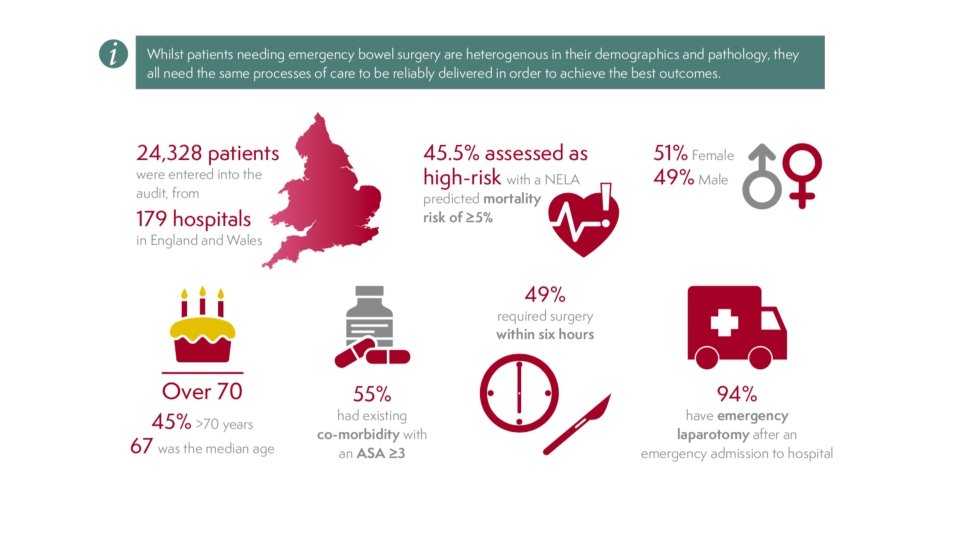
5 th NELA report; 24, 328 patients • NELA Database now 160, 000 patients in total • 5 th Report published December 2019
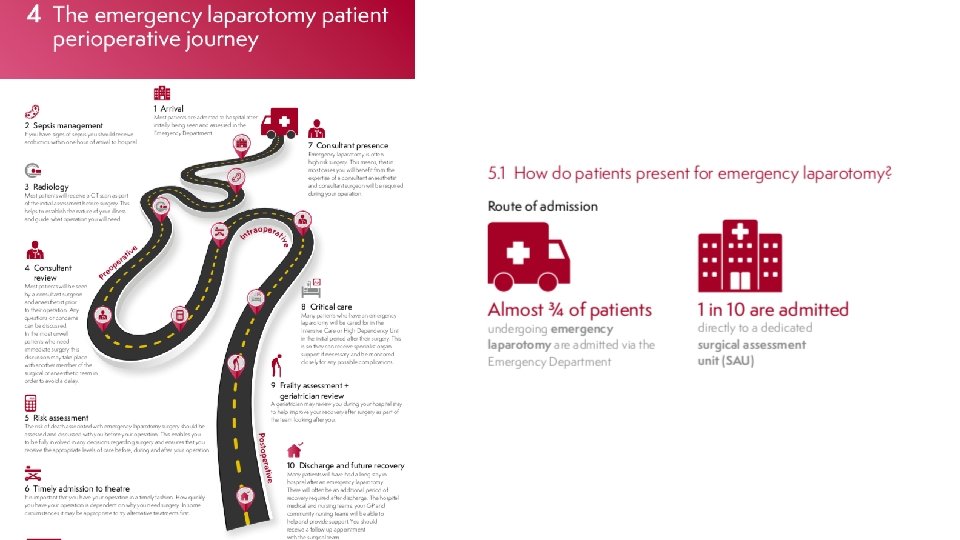
Indications for Emergency Laparotomy
Surgical findings
Mortality: National
Mortality: Local 30 day risk adjusted mortality = XX %
Funnel Plot of risk adjusted ONS 30 -day mortality
Hospitals with the lowest 30 -day mortality
Length of Stay: National Lo. S = 16 days
Length of Stay: Local National Lo. S = 16 days Local Lo. S = XX days
5 th NELA report – the key standards
Data Ascertainment: National 178 hospitals were included in this metric. Overall case ascertainment was 84% (increased from year 4, 82. 7%). Overall 104 hospitals were rated green and 22 were red National case ascertainment – 84%
Data Ascertainment: Local 178 hospitals were included in this metric. Overall case ascertainment was 84% (increased from year 4, 82. 7%). Overall 104 hospitals were rated green and 22 were red National case ascertainment – 84% Regional case ascertainment = YY %
CT Reported before Surgery: National: 88% patients have a preoperative CT scan
CT Reported before Surgery: Local National: 88% patients have a preoperative CT scan Local results = XX % Regional results = YY %
CT Discrepancy Rates: National
CT Discrepancy Rates: National Overall discrepancy rate = 5. 3%
Preop Risk Assessment: National
Preop Risk Assessment: Local preoperative risk assessment = XX% Regional preoperative risk assessment = YY%
Arrival to Theatre: National arrival in a timescale appropriate to surgery = 82. 4%
Arrival to Theatre: local National arrival in a timescale appropriate to surgery = 82. 4% Local hospital arrival in a timescale appropriate to surgery = XX%
Preop Consultant Input: National
Preop Consultant Input: Local National Both 85. 7% Surgeon 95. 4% Anaesthetist 88. 8% Intensivist 67. 5% (risk>10%) Local XX XX Regional YY YY
Consultant involvement by risk category
Consultant Presence In Theatres: National
Consultant Presence In Theatres: local Both Surgeon Anaesthetist National 85. 5% 93. 7% 90. 1% Local XX XX XX Regional YY yy yy
Post op Critical Care: National
Post op Critical Care: Local National Admission if 77. 5% risk >5% Local XX Regional yy
Geriatric and frailty - National
Mortality and Lo. S – National (patients over 65)
Geriatric and frailty - Local geriatric reviews (proportion of patients) = XX% Regional = YY%
Assessment of frailty - National
Assessment of frailty - local Local frailty assessment (proportion of patients) = XX% Regional = YY%
Antibiotics in Suspected Sepsis Median time to antibiotics = 3. 5 hours in patients with suspected sepsis on admission 80% patients with sepsis required immediate or urgent surgery; 84% of these arrived in theatres in appropriate time frame
Unplanned Events; return to theatre 9% patients return to theatre 3% - planned 5. 4% unplanned
Unplanned admission to critical care
Sharing data with teams
The Recommendations
Thank You To everyone involved in caring for patients undergoing emergency laparotomy To everyone involved in collecting the data