National Conference on Agriculture for Rabi Campaign 2013

National Conference on Agriculture for Rabi Campaign – 2013 On 24 th & 25 th September, 2013 at PUSA Complex, New Delhi Govt. of West Bengal Department of Agriculture

WEST BENGAL : AN OVERVIEW PART-I Geographical Area Nos. of Agricultural Districts Nos. of Agricultural Blocks 88752 sq. Km. 18 335 Nos. of Gram Panchayets Nos. of Mouza / Village 3354 40782 Population (2011 Census) 9, 15, 94, 000 Population Density(2011 Census) 1029 / Sq. Km. Agro-Climatic Zones 6 Nos. Gross Cropped Area(2011 -12) 9352952 ha Cultivable Area (2011 -12) 5700848 ha Net Area Sown(2011 -12) 5198146 ha 62% of Net Cropped Area Irrigated Area Total Nos. of Agricultural holdings Size of average Land Holding 7123000 Nos 0. 77 ha / Holding 2
 179. 93 Total Food")
WEST BENGAL : AN OVERVIEW PART-II Cropping Intensity (2011 -12) 179. 93 Total Food Grains Production (2011 -12) 160. 09 Lakh MT Estimated Total Food Grains Production (2012 -2013, 4 th Advance Estimate) 165. 11 Lakh MT Target of Total Food Grains Production (2013 -2014) 172. 30 Lakh MT Summer Rice Productivity (2011 -12) 3174 Kg / ha Estimated Summer Rice Productivity (201213) 3372 Kg / ha Target of Summer Rice Productivity (20132014) 3425 Kg / ha 3

West Bengal : Placing Issues in Perspective • Has 8% of India’s population with 2. 7% of the total area, • Population Density (1029 per Sq. Km) puts tremendous pressure on land & Natural Resources, • Marginal and small farmers constitute nearly 96% of the 71. 23 lakh holdings, (2010 -11 census) 4

West Bengal Agriculture : Significant milestones 1 st position in Rice production First position in Vegetables Production, Second position in Potato Production, Third in Flowers and seventh in Fruits Production, Cropping intensity of 179. 93% (2011 -12) 5

Estimated Requirement of Crops in West Bengal During 12 th Plan Period – Part-A In Lakh MT Cereals Pulses Food Grains 144. 89 166. 95 12. 87 179. 82 923. 89 146. 15 168. 41 12. 98 181. 39 2015 -16 931. 98 147. 43 169. 88 13. 10 182. 98 2016 -17 940. 35 148. 75 171. 70 13. 21 184. 61 Year Population (Lakh) Rice 2013 -14 915. 94 2014 -15

Estimated Requirement of Crops in West Bengal During 12 th Plan Period - Part-B In Lakh MT Year Population (Lakh) Oil Seeds Potato 2013 -14 915. 94 16. 55 50. 98 2014 -15 923. 89 16. 69 51. 43 2015 -16 931. 98 16. 84 51. 88 2016 -17 940. 35 16. 99 52. 34
 for the year 2011 - 2013 Region June")
. Rainfall Analysis (m. m. ) for the year 2011 - 2013 Region June July 2013 2011 2012 2013 September (Upto 15 th) Actual (% Dep. ) 2011 2012 2013 Normal 2012 Actual (% Dep. ) Normal 2011 Normal Actual (% Dep. ) August Actual (% Dep. ) 2011 2012 2013 Sub. Himalayan West Bengal 454 425 (-6) 552 (22) 405 (-11) 635 610 (-4) 641 (1) 531 (-16) 458 454 (-1) 279 (-39) 421 (-8) 221 74 (-67) 211 (-5) 229 (4) Gangetic West Bengal 256 374 (46) 139 (-46) 229 (-10) 318 229 (-28) 303 (-5) 239 (-25) 311 427 (37) 225 (-28) 377 (21) 135 127 (-6) 173 (28) 100 (-27) West Bengal 322 391 (21) 277 (-14) 288 (-11) 425 356 (-16) 416 (-2) 336 (-21) 360 436 (21) 243 (-33) 392 (9) 164 109 (-34) 186 (13) 143 (-13)

KHARIF ASSESSMENT – 2013 A=Area in ’ 000 ha, P= Production in ’ 000 mt, Y= Yield in Kg/ha Crops 2012 -2013 (4 th 1 st Estimate 2013 -14 Estimate) A P Y 4216. 055 10881. 683 2581 4290. 00 11203. 500 2612 Kharif Maize 40. 588 96. 769 2384 45. 00 117. 00 2600 Kharif Pulses 54. 096 36. 865 681 63. 850 49. 925 782 Jute 576. 709 8228. 161 (‘ 000 bales) 14. 27 (bales) 550. 00 8112. 50 (‘ 000 bales) 14. 75 (bales) Mesta 6. 696 82. 671 (‘ 000 bales) 12. 35 (bales) 7. 00 87. 50 (‘ 000 bales) 12. 50 (bales) Sugarcane 16. 077 1685 104808 20. 00 21000 105000 Kharif Rice 9

RABI PLANNING - 2013 A=Area in ’ 000 ha, P= Production in ’ 000 mt, Y= Yield in Kg/ha Crops 4 th Advanced Estimates RABI 2012 -2013 RABI PLANNING (TARGET)’ 2013 -14 A P Y Summer Rice 1210 4080 3372 1500 5137. 5 3425 Wheat 322 960 2817 350 1004. 5 2870 Rabi Maize 65 320 4923 80 400. 00 5000 Rabi Pulses 168. 42 171. 492 1018 200 210. 00 1050 Food Grains 1768. 38 5482. 842 3100 2134 6752. 00 3170 Oilseeds 717. 339 821. 06 1145 750 870. 00 1160 Potato 386. 607 11598. 21 30000 400 18200 32000 10

Progress on Kissan Credit Card and Credit Flow Year Item Target Achievement 2012 -13 KCC (Nos. ) 10, 000 1000215 Credit Flow (Rs. In crore) 23500. 00 17, 000. 00 (72. 3%) KCC (Nos. ) 12, 000 1, 80, 000(1 st Qrt) Credit Flow (Rs. In crore) 37100. 00 7120 (20%) (1 st qtr) 2013 -14 Source: Lead Bank - UBI 11

NATIONAL FOOD SECURITY MISSION 2013 -14

Area of Operation…. NFSM – Rice NFSM – Wheat 1. Jalpaiguri 2. Coochbehar 3. Uttar Dinajpur 4. South 24 Pgrs. 4. Dakshin Dinajpur NFSM-Pulse All the 17 Districts 5. Purulia 6. Howrah 7. Purba Medinipur 8. Paschim Medinipur 13
 Component Approved Outlay")
Fund Statement under NFSM during 2012 -13 ( Rs in Lakh) Component Approved Outlay Unspent Balance of 2011 -12 As per AUC Accrued Interest up to 2011 -12 Fund Released by GOI during 2012 -13 Total Fund Available during 2012 -13 Expenditure during 2012 -13 Unspent Balance of 2012 -13 as on 01. 04. 13 NFSM – Rice 3662. 85 336. 60 280. 85 2840. 18 3457. 63 2601. 69 855. 94 NFSM – Wheat 831. 84 89. 12 -- 604. 57 693. 69 684. 78 8. 91 NFSM – Pulse 897. 49 92. 63 -- 757. 05 849. 68 653. 74 195. 94 A 3 P 540. 00 127. 28 -- 277. 72 405. 00 306. 49 98. 51 Publicity -- 20. 58 -- -- 20. 58 TOTAL 5932. 18 666. 21 280. 85 4479. 52 5426. 58 4246. 70 1179. 88
 Approved Outlay by")
Fund Statement under NFSM during 2013 -14 ( Rs in Lakh) Approved Outlay by GOI Additional Action Plan for Unspent Balance as on 01. 04. 13 approved by GOI Revised Action Plan approved by GOI during 2013 -14 (2+3) Total Fund Released by GOI till date (1 st & 2 nd Installment) Expenditure during 2013 -14 up to July, 2013 Remarks 1 2 3 4 5 6 7 NFSM – Rice 3799. 98 715. 96 4515. 94 2485. 86 1017. 6081 94 DC during Kharif out of 149 DCs NFSM – Wheat 721. 57 187. 34 908. 91 672. 78 - Yet to be started Component NFSM – Pulse 1291. 1685 104. 771 1395. 939 167. 00 2. 566 To be conducted during Rabi Summer A 3 P 898. 60 - 898. 60 35. 89 - -Do- TOTAL 6711. 3185 1008. 071 7719. 3895 3361. 53 1020. 1741

District wise No. of Hybrid Rice Cluster DC during 2013 -14 under NFSM-Rice Sl. No. District No. of DC @ 100 ha Seed Requirement (MT) 1 Coochbehar 6 9. 0 2 Jalpaiguri 10 15. 0 3 Uttar Dinajpur 5 7. 5 4 Purulia 10 15. 0 5 Paschim Medinipur 10 15. 0 6 Purba Medinipur 4 6. 0 7 Howrah 4 3. 0 8 South 24 Parganas 6 9. 0 55 79. 5 Total

District wise No. of HYV Cluster DC during 2013 -14 under NFSM-Wheat Sl. No. District WHEAT Seed Requirement No. of Cluster DC @100 ha (including Additional DCs) in Variety MT 1 Coochbehar 2 20. 0 PBW-343 2 Jalpaiguri 5 50. 0 PBW-343 3 Uttar Dinajpur 4 40. 0 PBW-343 4 Dakshin Dinajpur 1 10. 0 PBW-343 Total 12 120. 0

District wise No. of HYV Cluster DC during 2013 -14 under NFSM-Pulse Sl. District No. of DCs @ 100 ha Total Seed Requirement in MT 1 3. 0 1 Coochbehar 2 Jalpaiguri 2. 5 7. 5 3 Uttar Dinajpur 2. 5 7. 5 4 Dakshin Dinajpur 1 3. 0 5 Maldah 8 24. 0 6 Murshidabad 16 48. 0 7 Nadia 13 39. 0 8 Birbhum 6 18. 0 9 Purulia 4. 5 13. 5 10 Paschim Medinipur 1 3. 0 11 Purba Midnapur 1 3. 0 12 Bankura 3 9. 0 13 Bardhaman 6. 5 19. 5 14 North-24 Parganas 1 3. 0 15 South-24 Parganas 2 6. 0 16 Howrah 9 15. 0 17 Hooghly 2 6. 0 80. 00 237 TOTAL

District wise & Crop wise Allotment of A 3 P units (@ 100 ha each) under NFSM – Pulse for Implementation in West Bengal during 2013 -14 Sl. No. Crop District wise No. of Units (@ 100 Ha each) of A 3 P Maldah Murshidabad Nadia Birbhum Purulia Total 1. Black gram 5 - 17 - 6 28 2. Lentil 3 60 42 10 2 117 3. Gram - 20 - 10 2 32 8 80 59 20 10 177 TOTAL
 2013 -14")
Bringing Green Revolution to Eastern India (BGREI) 2013 -14

SLSC APPROVED ACTION PLAN FOR 2013 -14 Financial Sl. Outlay (Rs. Intervention No. in lakh) 1 Block Demonstration 10027. 6554 2 Asset Building Activities 1412. 1000 3 Site Specific Activities 2587. 2446 4 Marketing Support 1100. 0000 TOTAL 15127. 0000
 Progress of Block Demonstration during 2013 -14 Sl. No. Agro-eco situation Targets as")
I) Progress of Block Demonstration during 2013 -14 Sl. No. Agro-eco situation Targets as approved by SLSC Achievement Physical (ha. ) Financial (Rs. in lakh) PADDY I. Kharif 1 Up-land 30300 2157. 5138 30300 - 2 Shallow Lowland 87400 6192. 9404 86200 - 3 Medium Deep Water 9700 687. 2062 9700 - II. Boro 4 Irrigated HYV 50200 532. 1200 - - 5 Hybrid Rice 3500 70. 8750 - - Total Paddy B WHEAT Total (Rice + Wheat) 181100 9640. 6554 126200 - 18000 387. 0000 - - 199100 10027. 6554 126200 -
 RATE OF")
B. Asset Building Activity SL. NO. INTERVENTION S PHYSICA L (NO. ) RATE OF ASSISTANCE (Rs. ) APPROVED FINANCIAL OUTLAY (Rs. in lakh) 1 PUMP SETS 14121 10000 1412. 10 C. Site Specific Activity: Sl. No. Intervention Approved Financial Outlay (Rs. in lakh) 1 Construction of irrigation channel 800. 0000 2 Electrification of Pump Set @ Rs. 8000/- 1687. 2000 3 Monitoring & Documentation 100. 0446 TOTAL 2568. 1150 D. MARKETING SUPPORT: SL. NO. 1 INTERVENTIONS PHYSICAL (NO. ) UNIT COST (Rs. in lakh) APPROVED FINANCIAL OUTLAY (Rs. in lakh) KRISHAK BAZAR 2 550 (approx) 1100. 00
 2013 -14 Department of Agriculture Government of West Bengal")
Rashtriya Krishi Vikas Yojana (RKVY) 2013 -14 Department of Agriculture Government of West Bengal

Outlay and Expenditure on Agriculture and Allied Sectors compared to total Annual Plan size. State: West Bengal Annual Plan Year Total State Plan Expenditure (A. E. /R. E. /B. E. ) Rs. In Crore Outlay/ Expdt. for Agric. & Allied sector (Excluding RKVY) GOI release of RKVY fund Expenditure of Agriculture & Allied Sectors as % of Total Plan Outlay 2007 -08 (A. E. ) 9073. 09 357. 81 54. 93 3. 94 2008 -09 (A. E. ) 10396. 90 503. 20 147. 38 4. 84 2009 -10 (A. E. ) 12121. 59 597. 36 147. 38 4. 93 2010 -11 (A. E. ) 11784. 94 674. 95 335. 98 5. 73 2011 -12 (A. E. ) 21029. 67 867. 62 486. 65 4. 13 2012 -13 (R. E. ) 23029. 19 1137. 89 374. 58* 4. 94 2013 -14 (R. E. ) 26674. 00 **1390. 47 NA 5. 21 N. B. - * GOI Allocation was Rs. 464. 81 Crore but released Rs. 374. 58 Crore including Sub-schemes. ** State Nodal Department has mooted a proposal to Finance Deptt. for enhancement of outlay under Agri & Allied sector to the tune of Rs. 1600 crore in lieu of Rs. 1390. 47 crore.

Allocation, release and U/C of RKVY fund during XI Plan Period and 2012 -13 State – West Bengal Year Allocation 2007 -08 2008 -09 2009 -10 2010 -11 2011 -12 Total (11 th Plan) 2012 -13 Release by GOI (Rs. in crore) Release by UC Deptt. submitted 54. 93 147. 38 476. 15 486. 65 1312. 49 54. 93 147. 38 335. 98 486. 65 1172. 32 54. 93 147. 38 335. 98 486. 65 1172. 32 464. 81 374. 58 317. 01 *Figure shown under RKVY includes RKVY (Normal) & Sub-schemes (viz. BGREI, NMPS, NVIUC & INSIMP)

GOI Allocation & Release under RKVY & Sub-schemes during 2013 -14 For WEST BENGAL Sl. No. Name of the Project/subschemes 1 2 a b c d RKVY (Normal) RKVY Sub-scheme BGREI NVIUC (Vegetable cluster) INSIMP (Nutri-cereal) NMPS Total Allocation (Rs. In crore) Released (Rs. In crore) 334. 10 153. 08 151. 27 4. 35 0. 02 14. 40 504. 14 75. 64 2. 18 0. 01 7. 20 238. 11
 Sl. No. Name of the projects/ schemes")
SYNOPSIS OF RKVY SCHEMES/ PROJECTS (AGRICULTURE DEPARTMENT) Sl. No. Name of the projects/ schemes (Stream-I) 2013 -14 SLSC Approved Outlay (Rs. In Lakh) 1 Production of quality seeds 1325. 60 2 Infrastructure development of State Agril. Farms/ Research Stations/ SAU Farms for agricultural development in West Bengal. 210. 80 3 Initiatives for Crop Development in West Bengal 567. 40 4 Support to Plant Protection & Integrated Pest Management 5 Support to Soil Health & Integrated Nutrient Management 6 Farm Mechanization 21. 30 432. 50 6000. 00 Total 8557. 60 N. B. - 1 st Instalment of fund for RKVY Stream – I projects has been released by Go. I, the Nodal Deptt. is expected to release the fund soon.
 Sl. No. Name of the project/schemes (Stream –")
SYNOPSIS OF RKVY SCHEMES/PROJECTS (AGRICULTURE DEPARTMENT) Sl. No. Name of the project/schemes (Stream – II) 2013 -14 SLSC Approved outlay (Rs. in Lakh) 1 Infrastructure Development of Agril. Training Centres & Research Institutes. 271. 61 2 Agri- Research Projects for providing support to growth & development of agriculture and allied sectors in the State. 224. 98 3 Support to Extension functionaries for facilitating Agricultural Extension & mass campaign in the state of West Bengal 480. 57 4 Strengthening of Govt. Agricultural Farms for Seed Production 1135. 232 5 Integrated Farming system approach-Demonstration cum training center for agriculture and allied sectors. 50. 00 6 Comprehensive Development of Kumari Kanan Integrated Farm in Purulia District 50. 00 7 Special programme for Agricultural Development of Darjeeling district under GTA. 242. 50 Total N. B. - 1 st Instalment of fund for RKVY Stream – II projects has been released to the implementing agencies. 2454. 89
 2013 -14")
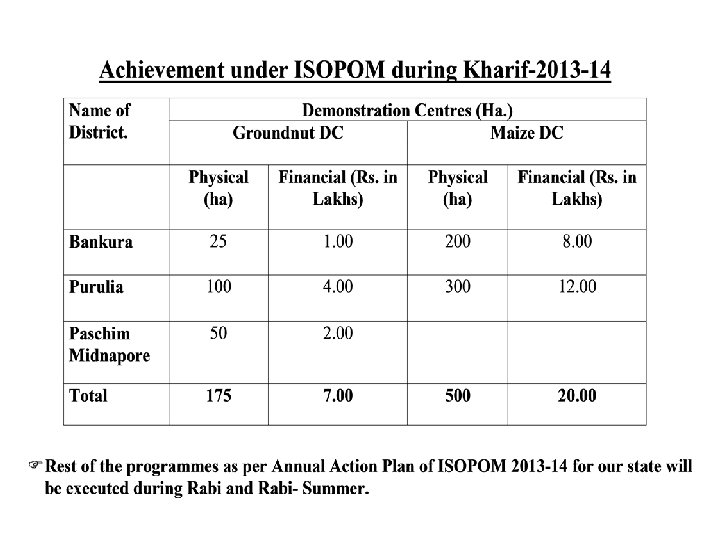
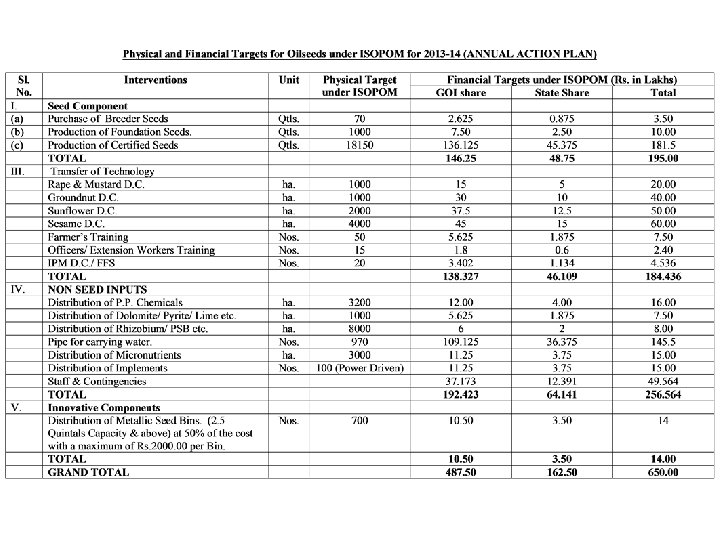
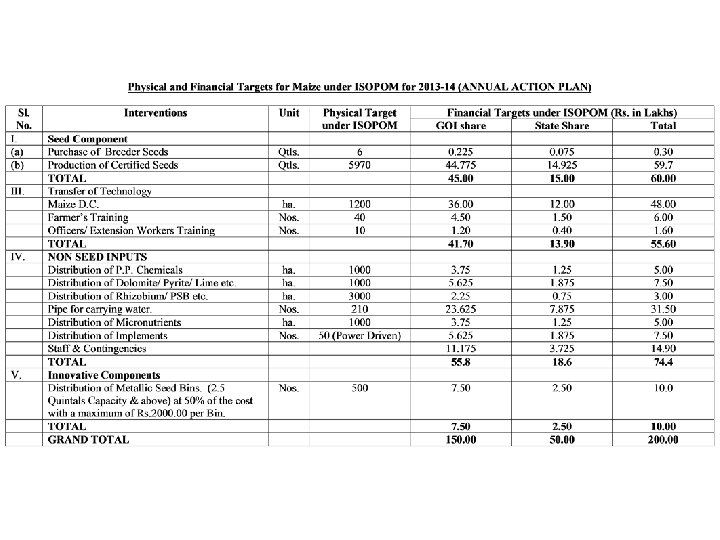
INTEGRATED SCHEME OF OILSEEDS, PULSES, OILPALM AND MAIZE (ISOPOM) 2013 -14

 FOR THE YEAR (2013 -14) UPTO JULY")
PROGRESS REPORT ON SOIL TESTING LABORATORIES (STLs) FOR THE YEAR (2013 -14) UPTO JULY 2013 Soil Testing Laboratories under: 1. State Govt. 2. Public undertaking Sector 3. Private Sector Total No. of Laboratories Static Mobile Total 10 8 18 Nil Nil Nil 10 8 18 Annual Analyzing Capacity No. of samples Analyzed for nutrients Capacity utilized (%) No. of Distt. having STL No. of Distt. not having STL 104000 13533 13. 7 10 9 7 104000 13533 13. 01 10 9 7 Progress of distribution of Soil Health Cards: Period Kharif 2013 up to July 2013 Rabi 2013 -14(Target) No. of cards made available to farmers 13533 104000 No. of STL having AAS

Proforma-9 Progress Report on Fertilizer Quality Control Laboratories for the year 2013 -14 (up to July 2013) Fertilizer Quality Control Laboratory under: 1. State Govt. 2. Public Undertaking Sector 3. Private Sector Total No. of Laboratories Annual Analyzing Capacity 3 4500 Nil Nil 3 No. of samples Analyzed Capacity utilized (%) No. of FQCL having AAS 949 Nil 21. 0 Nil 3 Nil Nil Nil 4500 949 21. 0 3

Hybrid Maize Seed Production: HQPM 1, HQPM 5,
 OF DIFFERENT CROPS DURING 2012 -2013 AND TARGET DURING 2013")
SEED REPLACEMENT RATE (SRR) OF DIFFERENT CROPS DURING 2012 -2013 AND TARGET DURING 2013 -2014 IN WEST BENGAL. Sl. No. Name of Crop 2011 – 2012 (%) 2012 – 2013(%) 2013 – 2014 (Target) 1. Paddy 33. 6 34. 0 35. 0 2. Wheat 43. 4 45. 7 47. 0 3. Maize 29. 0 30. 0 33. 0 4. Gram 26. 9 27. 92 33. 0 5. Kalai(Urd) 35. 6 36. 47 37. 0 6. Moong 33. 6 33. 39 35. 0 7. Khesari 21. 1 22. 0 50. 22 8. Lentil 29. 6 29. 8 32. 99 9. Pigeon Pea 45. 0 46. 50 10. Ground-nut 40. 4 41. 0 44. 47 11. Mustard 41. 5 46. 19 50. 0 12. Sesame 34. 9 36. 91 37. 5 14. Potato 26. 7 27. 17 33. 04

Requirement and Availability of C/Q Seed for Rabi 2013 -14 & Target 2014 -15 2013 -14 Sl. No. CROP Requirement Production (Q) / Target 2014 -15 Deficit/Surplu Requiremen Production s(Q) t(Q) Availability / Deficit/Surplu s(Q) Availability 1. Paddy 560000 0 563000 - 2. Hybrid 2200 160 (-)2040 2300 210 (-)2090 Paddy 3. Maize 6000 - 4. Pulses 25735 25740 (+)5 25800 - 5. Ground- 17010 - 19350 - nut 6. Wheat 169200 160000 (-)9200 177600 - 7. Potato 2280000 1884000 (-)396000 2680000 2000000 (-)680000 8. Mustard 11220 16523 (+)5303 13310 16850 (+)3540 * After inclusion of the Pulse D/Cs under NFSM into Certification, the availability during 2014 -15 will increase as per area covered. (Quantity In Qtls)

Seed Certification

Seed Testing Status for 2012 -13 & Target for 2013 -14 Sl. Number Type of Seed samples 1. Service analyzed in 201213 576 1000 2. Certified 19695 20000 3. Official 2816 3000 4. Total 23087 24000 Target for 2013 -14

STATEMENT SHOWING THE STATISTICS OF THE ANALYSIS OF PESTICIDE SAMPLES FOR QUALITY CONTROL IN Quality Control & Insecticide Control Laboratory Sl. No. 1 Name of 2010 -11 2011 -12 the States Sample Mis /UTs analyzed branded (%) Sample analyzed 718 West Bengal 2012 -13 (Upto March 2013 -14(upto Aug 2014) 2013) 512 5 (0. 98) 417 3 (0. 72) Mis branded (%) 11(1. 53) Sample Mis analyzed branded (%) 242 1(0. 41)

PROGRESS OF FARM MECHANISATION SCHEMES DURING 2012 -13 Schem Target for e 2012 -13 (Rs. in Crore) RKVY 19. 071 BGRE I 53. 15 Up to date Achievement of 2012 -13 (Rs. in Crore) 14. 70 37. 59 Nos. of Farm Machinery Distributed so far Tractor-132 Power tiller-1517 Power reaper-97 Zerotillege-2 Pumpset-6625 Tractor-249 Power tiller-2820 Power reaper-190 Zerotillege-06 Pumpset-21715 Rate of Subsidy (Rs. ) Tractor. Power Tiller. Power Reaper. Zero Tillage Machine Pump set- : 45, 000/: 40, 000/: 15, 000/: 10, 000/- Name of Scheme : Financial Support scheme for Farm Mechanisation (FSSM)”

PROGRESS OF FARM MECHANISATION SCHEMES DURING 2012 -13 Scheme TARGET Uptodate Achievement NFSM Rs. 8. 573 Crore Rs. 3. 33884 Crore No. of Machinery Distributed Tractor-11 No. Power Tiller 179 Pump set 2382 Power Reaper - 23

• Target for 2013 -14 • Target for FSSM 2013 -14: Rs. 84. 77725 Crores • Target for Small Farm Implements: Rs. 20 Crores
 in")
Budget for Farm Mechanization for 2013 -14 under Sub-Mission on Agricultural Mechanization (SMAM) in West Bengal Sl No Scheme/Component Target for 2013 -14 (Rs. in Lakh) 1 Establishment of Farm Machinery Bank for Custom Hiring. 2 Promotion & Strengthening of Agricultural Mechanization through 6676. 00 Training, Testing and Demonstration. a) Demonstration Component 693. 60 b) Outsourcing of Training Subsidy for selected Agril. Machinery and Equipment 82. 875 7870. 00 4 Input Subsidy to small & marginal farmers for adopting suitable Farm Mechanisation 3000. 00 5 Enhancing farm productivity at village level by introducing appropriate Farm Mechanization in selected villages 600. 00 6 Post Harvest Technology & Management TOTAL 3 69. 65 18922. 475

Requirement And Availability Of Fertilizers During Rabi, 2013 -14 IN MT Sl. No. Fertilizers Potential Requirement Assessed Requirement [Finalized In ‘Zonal Conference Rabi 2013 -14] 1. UREA 8, 90, 180 8, 90, 000 2. DAP 2, 84, 363 2, 50, 000 3. MOP 2, 16, 440 2, 16, 000 4. SSP 2, 92, 474 4, 000 5. NPK Complexes 6, 49, 320 5, 50, 000 23, 32, 777 23, 06, 000 TOTAL

Status Of Quality Control Of Fertilizers During 2013 -14 Sl. No No. of Laboratory Annual Capacity Samples Received Samples Analysed Found Nonstandard 3 1011 927 144 4500

Consumption Of Fertilizers During Rabi 2012 -13 Fertilizers Consumption In MT UREA 868507 281571 233111 64 5216 136543 476992 DAP SSP MAP AS MOP NPK COMPLEX

Use of bio-fertilizers, organic manures , Compost & green manure during Rabi 2012 -13 BIOFERTILIZER ORGANIC MANURE VERMI COMPOST RURAL & CITY COMPOST GREEN MANURING 1650 43. 35 23. 95 87. 7 685100 MT LAKH MT HA
 Zinc Sulphate Ferrous Sulphate Copper")
USE OF MICRONUTRIENTS DURING RABI 2012 -13 (in MT) Zinc Sulphate Ferrous Sulphate Copper Sulphate Borax/ Boric Acid Manganese Sulphate Magnesium Others Sulphate. In. MT 4400 175 398 3585 295 2600 6491

ATMA –West Bengal: Present Status 1 SEWP – 2013 -14 IDWG approved Submitted to GOI 2 Provisional AUC, 2012 -13 Submitted to GOI 3 Annual Progress Report 2012 -13 Submitted to GOI SEWP Cumulative Progress Report up to Submitted to GOI 4 31/07/2013 5 Statement of Expenditure, 2012 -13 Submitted to GOI Fund for the Year 2013 -14 is yet to be released to West Bengal.
 Unspent opening balance as on 01/04/2013 1542.")
Financial Statement: 2013 -14 (Up to 31/08/2013) Unspent opening balance as on 01/04/2013 1542. 93909 Central Share 1031. 23173 State Share 90. 55588 Funds received from DAC Nil Release of State’s Matching Share Nil Total Expenditure as on 31/08/2013 Central Share 968. 452 877. 89612 State Share 90. 55588 Unspent closing balance as on 01/09/2013 574. 48709 Central Share 153. 33561 State Share Nil Fund for the Year 2013 -14 is yet to be release to West Bengal.

Financial Achievement: 2012 -13 and Target 2013 -14 Sl No. ACTIVITIES Utilized during 2012 -13 (Lakh Rs. ) Proposed for 2013 -14 under SEWP (Lakh Rs. ) 1 Training of Farmers 489. 38 1164. 710 2 Demonstration 81. 300 377. 520 3 Exposure Visit of Farmers 142. 080 230. 450 4 Mobilization of Farmers’ Groups 42. 630 199. 300 5 Farm Information Dissemination 58. 640 190. 000 6 Agril. Tech. Refinement, Validation & Adoption 64. 070 210. 960 7 Farm School 105. 500 346. 837 8 Innovative Activities 55. 630 173. 000 9 Administrative Expenses 638. 008 2088. 86 10 Farmers’ Friend Nil 804. 08 11 Developing SREP Nil 47. 500 12 SAMETI level Activities 92. 732 129. 580 13 State level Activities Nil 210. 130 1769. 970 6172. 927 TOTAL

Physical Achievement: 2012 -13 and Target 2013 -14 Sl No. ACTIVITIES Achievement during 2012 -13 Target for 2013 -14 under SEWP 1 Training of Farmers 57884 mandays 128093 mandays 2 Demonstration 2032 no. DCs 6864 no. DCs 3 Exposure Visit of Farmers 3683 mandays 38930 mandays 4 Mobilization of Farmers’ Groups 287 groups 774 groups 5 Farm Information Dissemination 412 leaflets/ booklets 650 leaflets/ booklets 6 Agril. Tech. Refinement, Validation & Adoption 16448 mandays 35550 mandays 7 Farm School 315 FSs 1038 FSs 8 Farmers Award 210 farmers & 29 groups 1029 farmers & 95 groups 9 Kissan Mela / Exhibition 5 nos. 19 nos. 10 Farmers’ Friend Nil 20102 nos. 11 Developing SREP Nil 19 12 SAMETI level Activities 87 courses 80 courses

SPECIALISTS AND FUNCTIONARY SUPPORT, 2013 -14 Sl. no. Name of the post No. ofpost Recruitment position Not recruited 16 posts filled up through Secondment 36 posts filled up through Secondment 19 posts filled up through Secondment. Process initiated for recruitment Recruited -2 (Coochbehar , Malda) , Advt. published -4 (Burdwan. Nadia, North 24 Paraganas & Howrah) 1 State Coordinator 1 2 Project Director, District 18 3 Deputy PD, District 38 4 Accountant Clerk, District Computer Programmer, District 19 6 BTM, Block 347 7 S M S at Block 694 8 9 Deputy Director, SAMETI Accountant Clerk, SAMETI Computer Programmer, SAMETI Farmers Friend at Village 5 10 11 19 Recruited - 57 (12 in Coochbehar, 30 in South 24 Paraganas & 15 in Malda). Advt. published -4 (Burdwan. Nadia, North 24 Paraganas & Howrah) Recruited -2 (Siliguri ATMA dist). Advt. published -4 (Burdwan. Nadia, North 24 Paraganas & Howrah) 8 1 Filled up through Secondment 1 Process going on. 20102 Not recruited.

Contingent Plan-2013 -14 • Under post kharif season, crops like Black Gram, Maize will be grown. • Promotion of Khesari, Toria, like crop will also increase area & production of Pulse & Oilseed crops even under rainfed condition. • Rabi crops like Wheat, Mustard, Lentil, Maize, Groundnut & Summer crops like Sesame and Moong are the best suited crops under West Bengal situation.

Challenges & Strategies ………. . Challenges: 1. Departure of rainfall from normal rhythm particularly in rainy months, 2. Reduced span of winter period to grow cold loving Rabi crops resulting restricted VRR, 3. More than 64% of the Geographical Area is under cultivation with 180% cropping intensity & putting pressure on natural resources. 4. High cost of Phosphatic & Potassic fertilizer facilitates imbalanced NPK ratio in soil(2. 92: 1. 6: 1. 0).

Strategies: 1. Under Low area & High productivity Zone, increased C/Q Seed availability from increased Seed Certification Programme. 2. Under High area & low productivity zone, increased Mechanization with Zero Till machine & use of quality seed. 3. Utilization of potential Rice fallow areas under Relay(poira) cropping of Lentil, Khesari, Toria & mustard. 4. Integrated Planning for supply of Quality Resources to the production systems. 5. Increased production of Vermicompost, other low cost indigenous nutrient sources & increased employment generation, 6. Reducing the Gap of IPC & IPU. 7. Better income realization by farmers with market linkage

‘ ‘Area Expansion’. – Strategic Technological Tools : 1. Farm Mechanization with Zero/Minimal seed-drill to utilize residual moisture for timely sowing of Wheat, Pulses & Oilseeds. 2. Extension of Intercropping, Mixed cropping, Relay cropping of Pulse, Oilseed & Maize to low lying Rice Fallow & upland field during Early/Rabi and Rabi season respectively, 3. Expansion of irrigation potential & reducing the gap between IPC & IPU through micro irrigation, Reduction of conveyance loss, Soil & Water conservation and Dry land & rainfed farming, & to convert cultivable Waste land to cultivated Land. 4. Research with new crops & varieties & under diversified soil and changing climatic condition for improved SRR & VRR.

‘‘Vertical Expansion’ through ‘Productivity Augmentation’. – – – – Strategic Technological Tools : Increased Seed &Variety Replacement rate. Expanding SRI Boro Area & with saved water resources, increasing irrigated Wheat, Pulse, Oilseed & Maize cultivation. Training , Extension & e-Governance. Farm mechanization : Electrical pumps, Zero till seed drill, Tractor, Power. Tiller, Drum Seeder , Delivery Pipe etc. Soil Health Management & Soil Test based nutrient Management, INM & IPM, Resource conservation technology: Mulching, Efficient irrigation Conveyance , to holding size of the farmers.

‘Better income’ realization by farmers – Providing alternative input production capacity to farmers through: Azolla/Vermi/Compost/Green/Leaf manuring – Demonstration & research on Integrated Farming System with livelihood support, – Selection of popular market crops and varieties, – Better provision of Storage and linking post harvest processing to Agro-Industries in PPP mode for value addition – Reducing cost of production: production Stress on location specific technology development integrating the ITKs. – Providing bio-fertilizers, bio-pesticides etc to combat high cost P & K Fertilizers &synthetic pesticides.

Prioritised Issues of West Bengal • Due to Climatic aberration during Kharif & Rabi, early Duration Rabi Varieties of Wheat, Lentil, Mustard, Khesari (Lathyrus), Groundnut, Sunflower with high yield potentiality under the region and availability of Quality/Certified seeds and it’s integration with Seed Rolling Plan. • Intensified Mechanisation programme with funding support as per choice of farmers for high area with low productivity zone. • Resource conservation technology with Zero Till/FIRB or other technological Tools for Rabi crops like Wheat, Rice, Maize, Pulses & Oilseeds. • Marketing infrastructure for increased price realization • Micro-Irrigation facility with rational subsidies under all the Departments. • Value addition through Intensified Post Harvest Management Programme including Food Processing. • Establishment of Custom Hiring Service for farm mechinaries.
- Slides: 64