
National Association of Residential Property Managers REPORTS What






- Slides: 28
National Association of Residential Property Managers® REPORTS • What do they say about your business? • The Panel • • Wendell Davis, MPM, CRB, GRI Mike Nelson, MPM, GRI Dave Holt, MPM, CPM Robert Machado, MPM, CPM
Wendell Davis, RMP, MPM, CRB, GRI Executive Vice President Watson Realty Corp. , CRMC
Sustainability and Growth • Balance sheet • Profit and Loss (P & L)
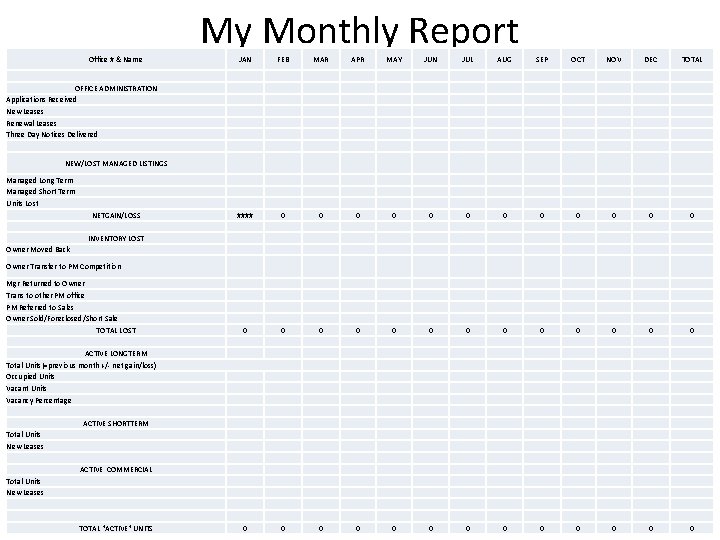
My Monthly Report Office # & Name JAN FEB MAR APR MAY JUN JUL AUG SEP OCT NOV DEC TOTAL #### 0 0 0 0 0 0 0 0 0 0 OFFICE ADMINISTRATION Applications Received New Leases Renewal Leases Three Day Notices Delivered NEW/LOST MANAGED LISTINGS Managed Long Term Managed Short Term Units Lost NETGAIN/LOSS INVENTORY LOST Owner Moved Back Owner Transfer to PM Competition Mgr Returned to Owner Trans to other PM office PM Referred to Sales Owner Sold/Foreclosed/Short Sale TOTAL LOST ACTIVE LONGTERM Total Units(=previous month +/- net gain/loss) Occupied Units Vacant Units Vacancy Percentage ACTIVE SHORTTERM Total Units New Leases ACTIVE COMMERCIAL Total Units New Leases TOTAL "ACTIVE" UNITS
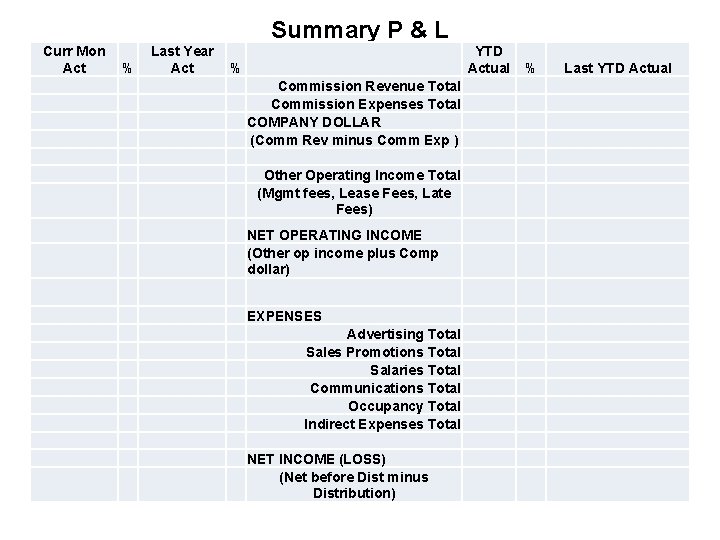
Summary P & L Curr Mon Act % Last Year Act % YTD Actual Commission Revenue Total Commission Expenses Total COMPANY DOLLAR (Comm Rev minus Comm Exp ) Other Operating Income Total (Mgmt fees, Lease Fees, Late Fees) NET OPERATING INCOME (Other op income plus Comp dollar) EXPENSES Advertising Total Sales Promotions Total Salaries Total Communications Total Occupancy Total Indirect Expenses Total NET INCOME (LOSS) (Net before Dist minus Distribution) % Last YTD Actual
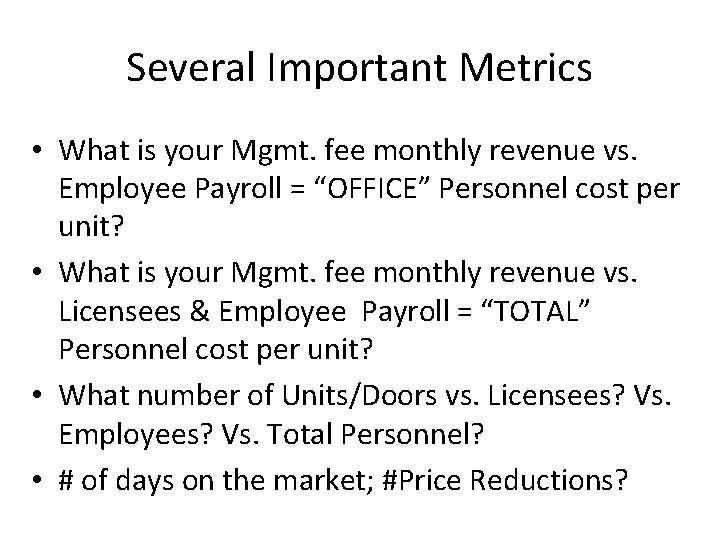
Several Important Metrics • What is your Mgmt. fee monthly revenue vs. Employee Payroll = “OFFICE” Personnel cost per unit? • What is your Mgmt. fee monthly revenue vs. Licensees & Employee Payroll = “TOTAL” Personnel cost per unit? • What number of Units/Doors vs. Licensees? Vs. Employees? Vs. Total Personnel? • # of days on the market; #Price Reductions?
Mike Nelson GRI®, MPM®, RMP® President
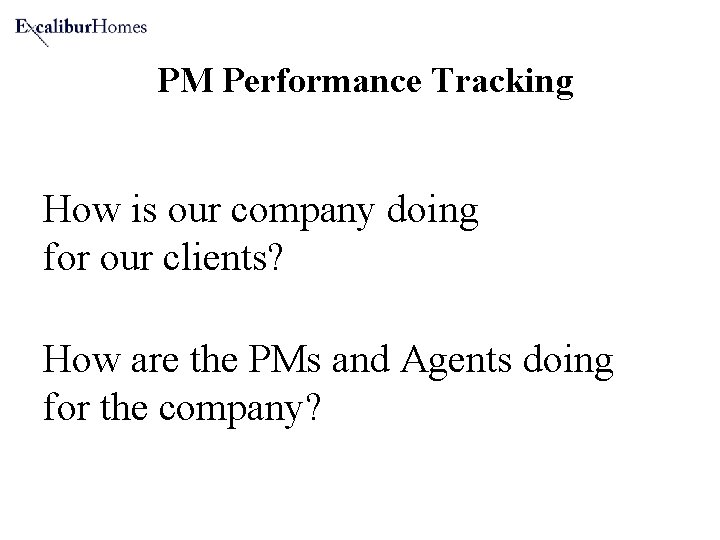
PM Performance Tracking How is our company doing for our clients? How are the PMs and Agents doing for the company?
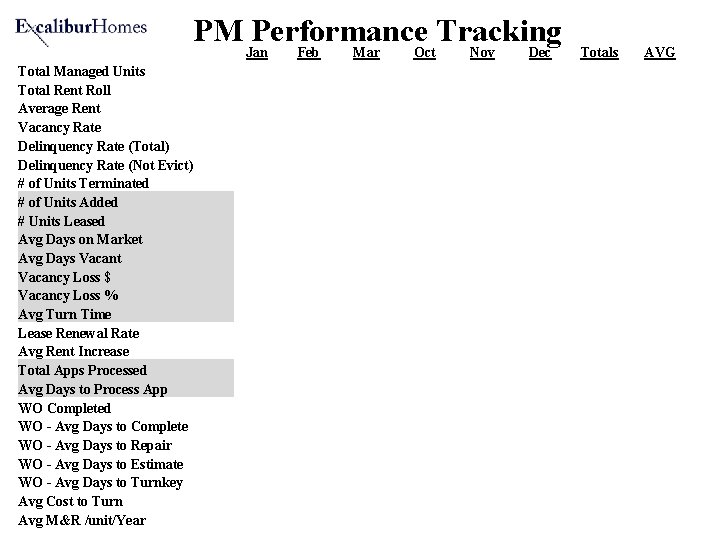
PM Performance Tracking Jan Total Managed Units Total Rent Roll Average Rent Vacancy Rate Delinquency Rate (Total) Delinquency Rate (Not Evict) # of Units Terminated # of Units Added # Units Leased Avg Days on Market Avg Days Vacant Vacancy Loss $ Vacancy Loss % Avg Turn Time Lease Renewal Rate Avg Rent Increase Total Apps Processed Avg Days to Process App WO Completed WO - Avg Days to Complete WO - Avg Days to Repair WO - Avg Days to Estimate WO - Avg Days to Turnkey Avg Cost to Turn Avg M&R /unit/Year Feb Mar Oct Nov Dec Totals AVG
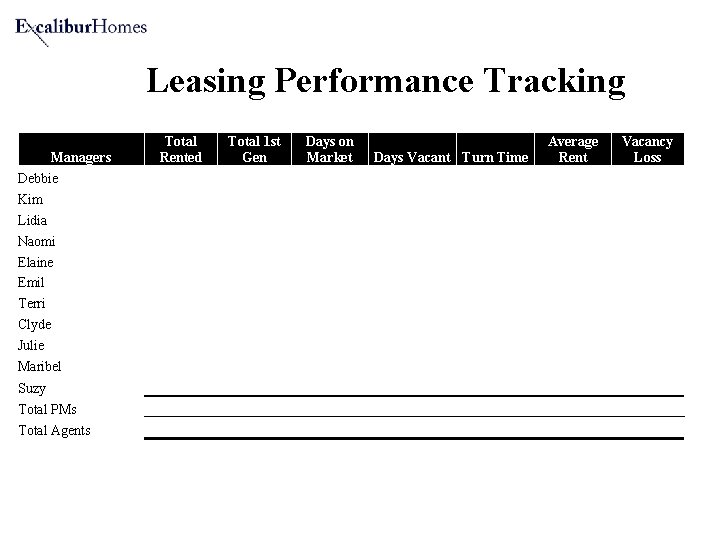
Leasing Performance Tracking Managers Debbie Kim Lidia Naomi Elaine Emil Terri Clyde Julie Maribel Total Rented Total 1 st Gen Days on Market Average Rent Days Vacant Turn Time Vacancy Loss Suzy Total PMs Total Agents
Company Tracking How is our company doing? (check your temp) P & L – comparing current mo/year to previous mo/year Are we growing as expected? Is our Income per Unit what we expected? What percentage of Gross is going to Payroll?
Company Performance Tracking Jan Feb Mar Oct Nov Dec YTD Actual Actual Budget Budget Difference Difference Management Fees Leasing Fees Renewal Fees Other Fees (Actual) Other Fees (Budget) Total (Actual) Total (Budget) Total Difference Total (Projected @ $___/unit/mo) Average Income Per Unit (Actual) Average Income Per Unit (Budget) Average
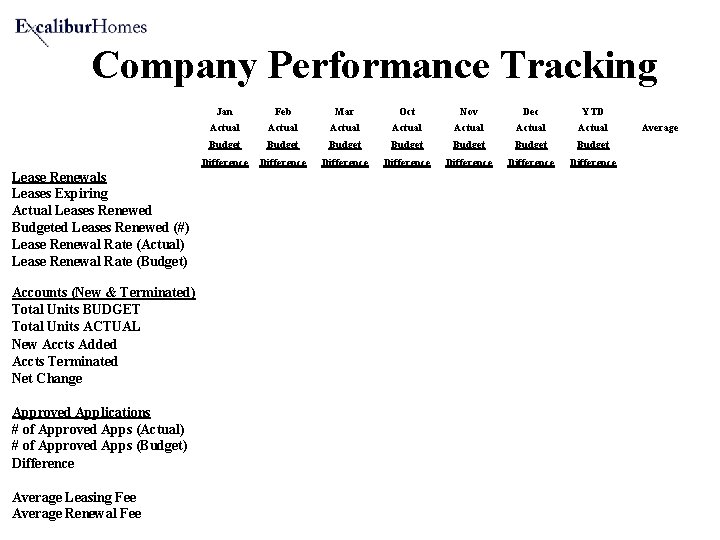
Company Performance Tracking Jan Feb Mar Oct Nov Dec YTD Actual Actual Budget Budget Difference Difference Lease Renewals Leases Expiring Actual Leases Renewed Budgeted Leases Renewed (#) Lease Renewal Rate (Actual) Lease Renewal Rate (Budget) Accounts (New & Terminated) Total Units BUDGET Total Units ACTUAL New Accts Added Accts Terminated Net Change Approved Applications # of Approved Apps (Actual) # of Approved Apps (Budget) Difference Average Leasing Fee Average Renewal Fee Average
David Holt, CPM, MPM President R. P. Management, Inc. CRMC 14
Marginal Net Worth The lifetime value of a client • Compute Average sale and profit per sale • Compute how much additional profit a unit is worth to you based on how long they stay with you • Compute what a unit costs by dividing the marketing cost by the # of units it produces. • Figure how many units a manager or team needs to manage
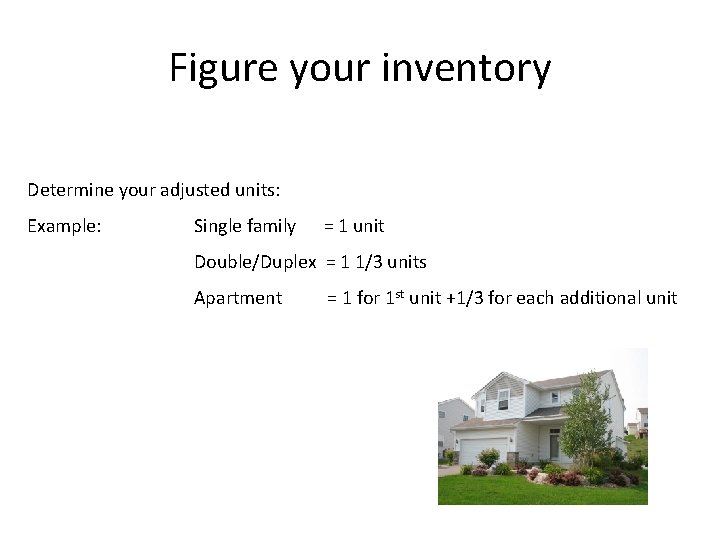
Figure your inventory Determine your adjusted units: Example: Single family = 1 unit Double/Duplex = 1 1/3 units Apartment = 1 for 1 st unit +1/3 for each additional unit
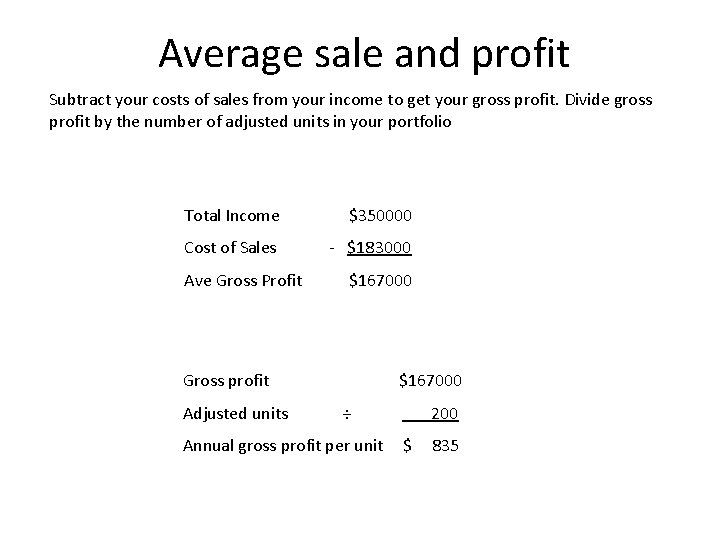
Average sale and profit Subtract your costs of sales from your income to get your gross profit. Divide gross profit by the number of adjusted units in your portfolio Total Income $350000 Cost of Sales - $183000 Ave Gross Profit $167000 Gross profit Adjusted units $167000 ÷ 200 Annual gross profit per unit $ 835
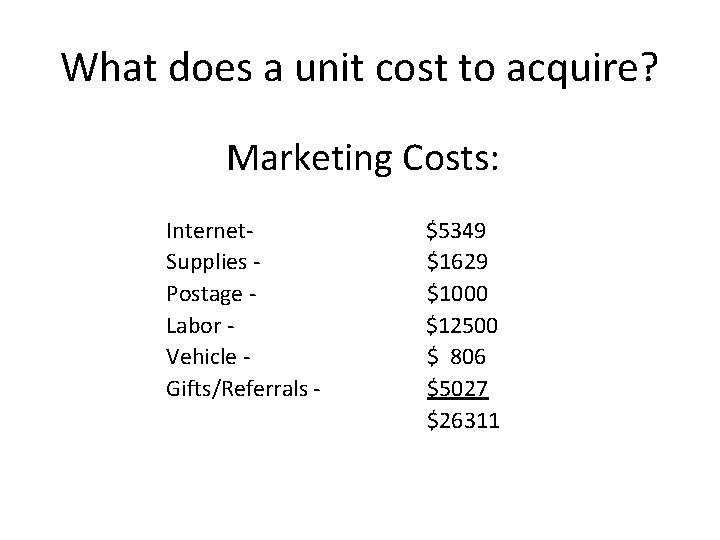
What does a unit cost to acquire? Marketing Costs: Internet- Supplies - Postage Labor Vehicle Gifts/Referrals $5349 $1629 $1000 $12500 $ 806 $5027 $26311
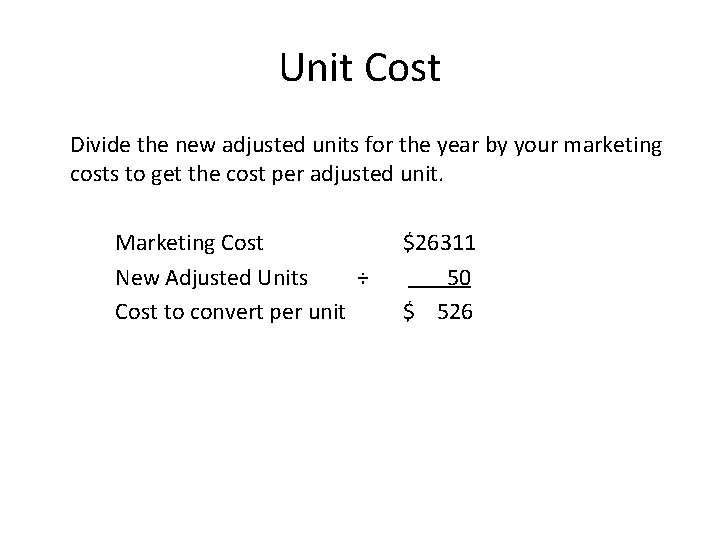
Unit Cost Divide the new adjusted units for the year by your marketing costs to get the cost per adjusted unit. Marketing Cost New Adjusted Units ÷ Cost to convert per unit $26311 50 $ 526
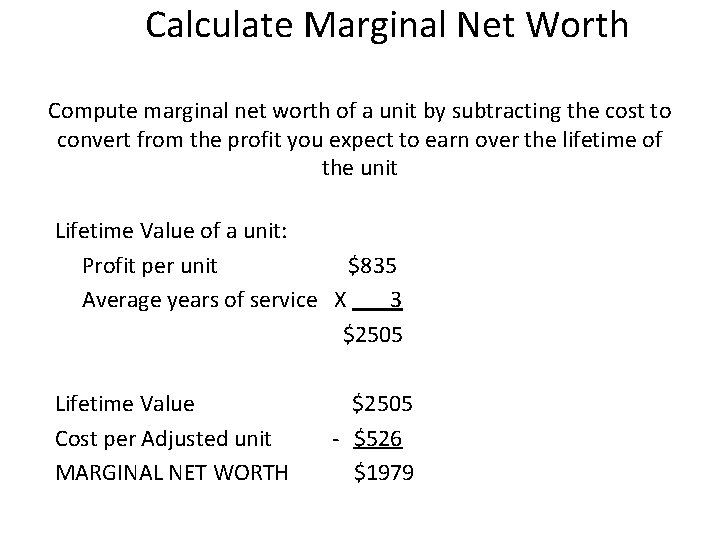
Calculate Marginal Net Worth Compute marginal net worth of a unit by subtracting the cost to convert from the profit you expect to earn over the lifetime of the unit Lifetime Value of a unit: Profit per unit $835 Average years of service X 3 $2505 Lifetime Value $2505 Cost per Adjusted unit - $526 MARGINAL NET WORTH $1979
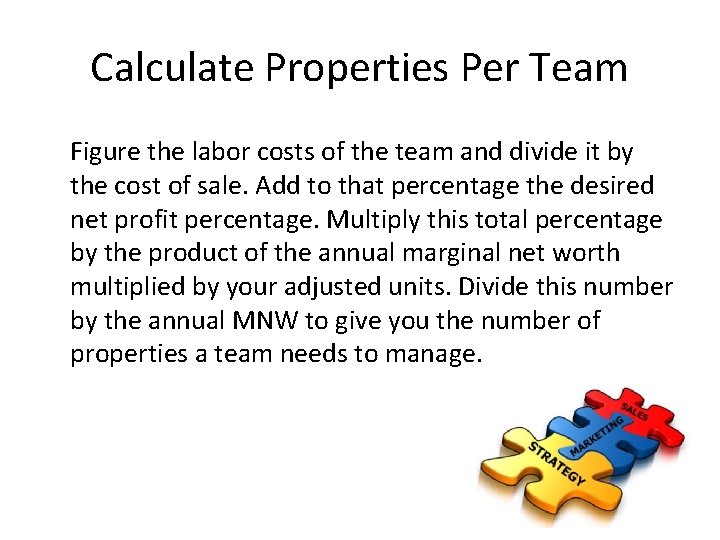
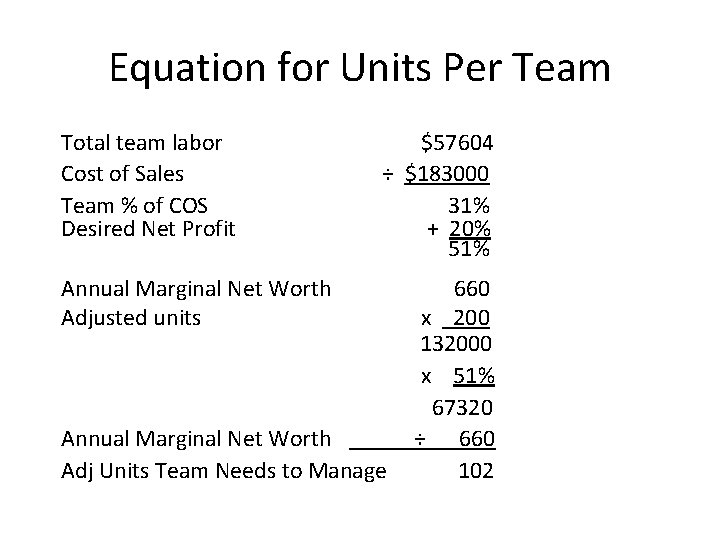
Calculate Properties Per Team Figure the labor costs of the team and divide it by the cost of sale. Add to that percentage the desired net profit percentage. Multiply this total percentage by the product of the annual marginal net worth multiplied by your adjusted units. Divide this number by the annual MNW to give you the number of properties a team needs to manage.
Equation for Units Per Team Total team labor Cost of Sales Team % of COS Desired Net Profit Annual Marginal Net Worth Adjusted units $57604 ÷ $183000 31% + 20% 51% 660 x 200 132000 x 51% 67320 Annual Marginal Net Worth ÷ 660 Adj Units Team Needs to Manage 102
Robert A. Machado, CPM, MPM President, RAM Commercial Enterprises, Inc. dba: Home. Pointe Property Management RAM Property Services
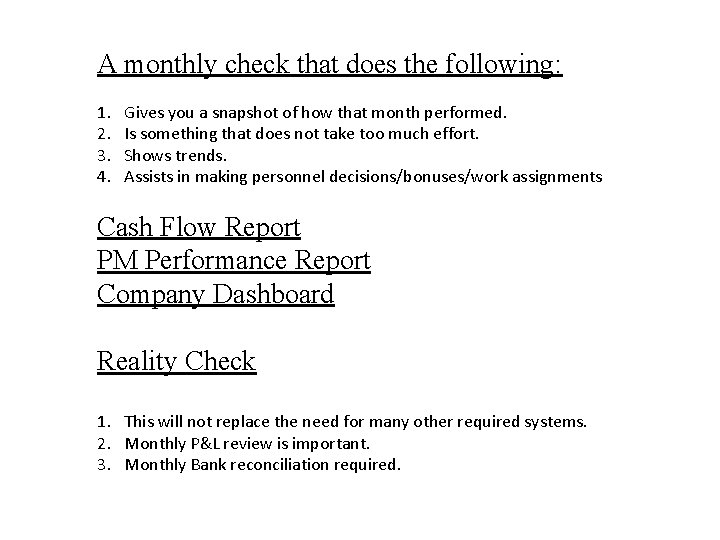
A monthly check that does the following: 1. 2. 3. 4. Gives you a snapshot of how that month performed. Is something that does not take too much effort. Shows trends. Assists in making personnel decisions/bonuses/work assignments Cash Flow Report PM Performance Report Company Dashboard Reality Check 1. This will not replace the need for many other required systems. 2. Monthly P&L review is important. 3. Monthly Bank reconciliation required.
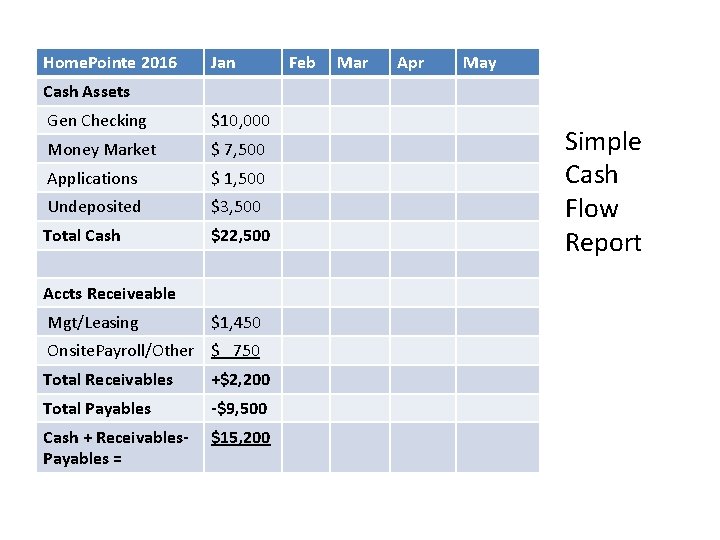
Home. Pointe 2016 Jan Feb Mar Apr May Cash Assets Gen Checking $10, 000 Money Market $ 7, 500 Applications $ 1, 500 Undeposited $3, 500 Total Cash $22, 500 Accts Receiveable Mgt/Leasing $1, 450 Onsite. Payroll/Other $ 750 Total Receivables +$2, 200 Total Payables -$9, 500 Cash + Receivables. Payables = $15, 200 Simple Cash Flow Report
Property Manager Performance Report
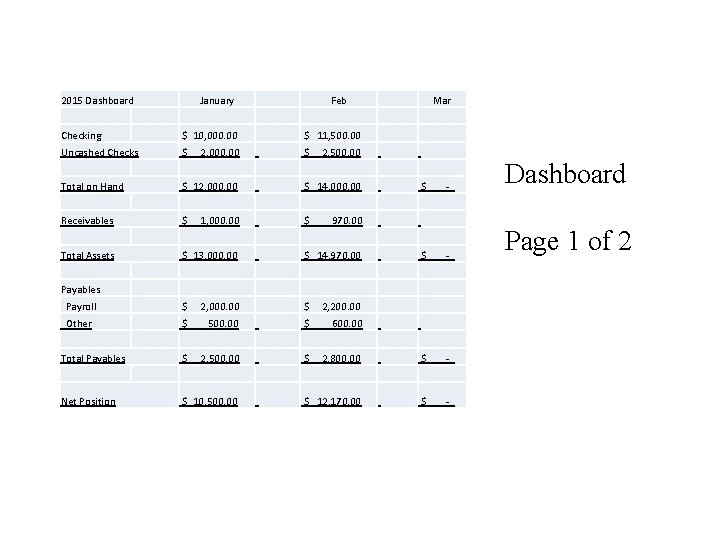
2015 Dashboard January Feb Mar Checking $ 10, 000. 00 $ 11, 500. 00 Uncashed Checks $ 2, 000. 00 $ 2, 500. 00 $ 12, 000. 00 $ 14, 000. 00 $ - $ 1, 000. 00 $ 970. 00 $ 13, 000. 00 $ 14, 970. 00 $ - Payables Payroll $ 2, 000. 00 $ 2, 200. 00 Other $ 500. 00 $ 600. 00 $ 2, 500. 00 $ 2, 800. 00 $ - $ 10, 500. 00 $ 12, 170. 00 $ - Total on Hand Receivables Total Assets Total Payables Net Position Dashboard Page 1 of 2
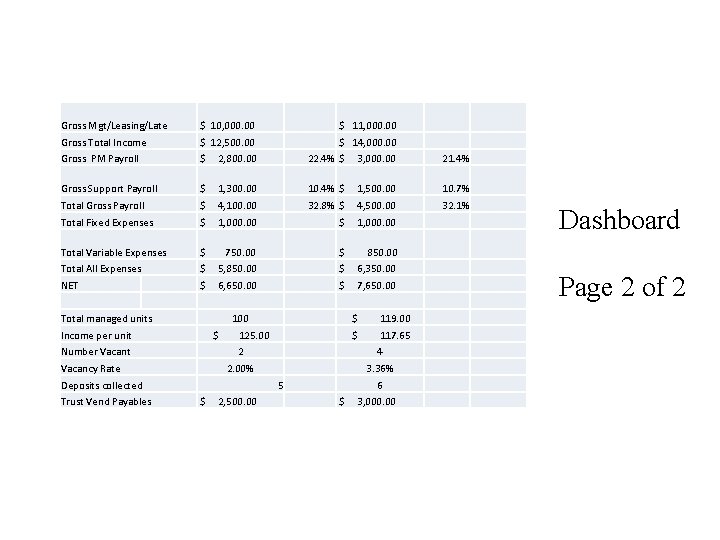
Gross Mgt/Leasing/Late $ 10, 000. 00 $ 11, 000. 00 Gross Total Income $ 12, 500. 00 $ 14, 000. 00 Gross PM Payroll $ 2, 800. 00 22. 4% $ 3, 000. 00 21. 4% Gross Support Payroll $ 1, 300. 00 10. 4% $ 1, 500. 00 10. 7% Total Gross Payroll $ 4, 100. 00 32. 8% $ 4, 500. 00 32. 1% Total Fixed Expenses $ 1, 000. 00 Total Variable Expenses $ 750. 00 $ 850. 00 Total All Expenses $ 5, 850. 00 $ 6, 350. 00 NET $ 6, 650. 00 $ 7, 650. 00 Total managed units Dashboard Page 2 of 2 100 $ 119. 00 Income per unit $ 125. 00 $ 117. 65 Number Vacant 2 4 2. 00% 3. 36% 6 Vacancy Rate Deposits collected Trust Vend Payables 5 $ 2, 500. 00 $ 3, 000. 00