Nathan asked his classmates to estimate the number

Nathan asked his classmates to estimate the number of hours they spend doing homework each week. The following data shows the results of his survey. 9, 4, 8, 2, 7, 3, 5, 6, 1, 4, 7, 6, 8, 5, 6, 7, 11, 14, 6 1. Make a dot plot for the data set. 2. Determine a) the spread of the data b) the mean of the data c) the standard deviation of the data

Frogs • With your eyes closed, pick 10 frogs. • How many of them are blue? • Put your number on the dotplot.

Athletes’ salaries http: //www. spotrac. com/nfl/rankings/

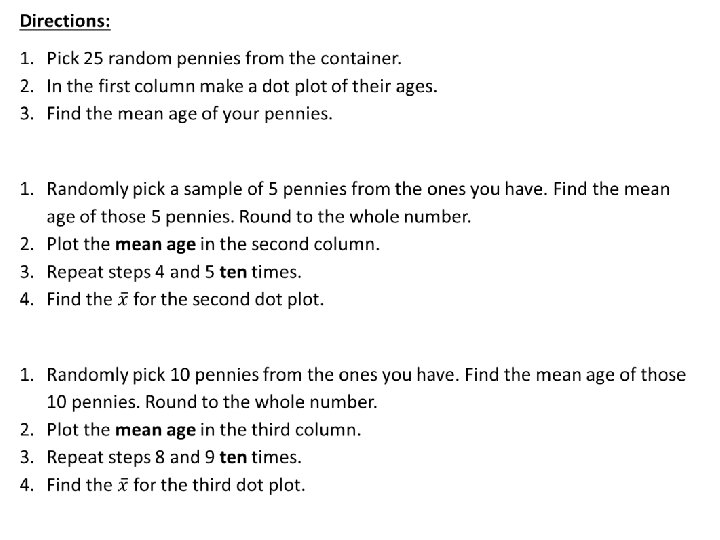
Penny Lab You should have in your possession 25 pennies, your calculator, and a small container.

Sampling Distributions http: //onlinestatbook. com/stat_sim/sampling_dist/index. ht ml
 b) c) d) e) What was the Population?")
Warm Up - Penny Lab a) b) c) d) e) What was the Population? What was the Sample? What kind of sampling technique did we use(SRS, Stratified, Cluster, Systematic)? What was the parameter? What was the statistics?

SAMPLING DISTRIBUTIONS Chapter 17

Parameter A Parameter is a number that describes the population. o A parameter always exists but in practice we rarely know it’s value o Greek letters used for parameters μ for mean σ for standard deviation ρ for proportions

Examples If we wanted to compare the IQ’s of all American and Asian males it would be impossible, but it’s important to realize that μAmericans and μasian exist.

Statistics

Examples

Do you believe in ghosts? 2005 the Harris Poll 889 adults– 40% 2005 CBS News poll 808 adults – 48% Which poll was correct? How can we explain the difference?

Do you believe in ghosts? Let’s run a simulation http: //www. rossmanchance. com/applets/One. Prop. htm

Sampling distribution What would happen if we could take every possible sample of the same size from a given population

http: //onlinestatbook. com/stat_sim/sampling_dist/

http: //onlinestatbook. com/stat_sim/sampling_dist/

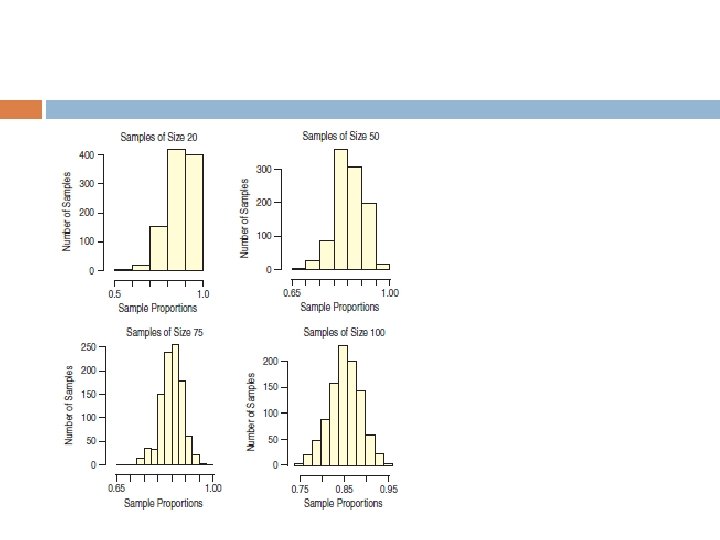
Central Limit Theorem When we are looking at sample means, their distribution will be approximately normal, no matter what shape the population was.

Two Pathways of Inference
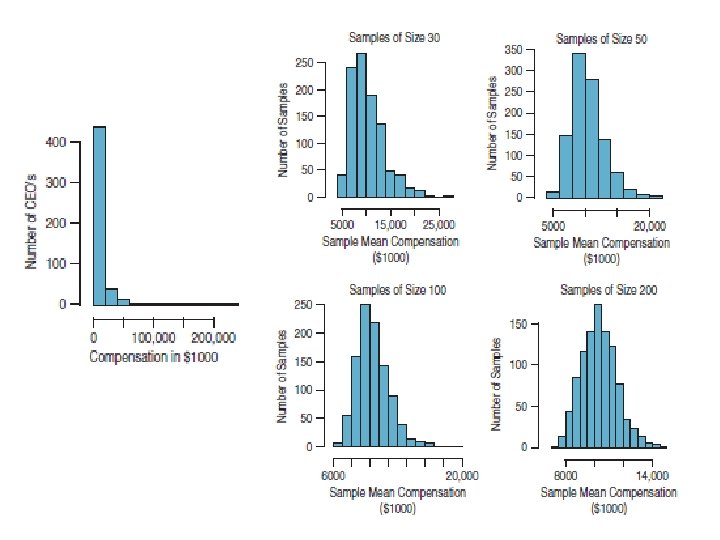

µ = 10, 307 σ = 17, 964 n mean 30 50 100 200 st. dev.

Example 1 Conditions: p = • Random Condition q = • Independence Conditionn = • <10% Condition • Success/Failure Condition

Example 2 The Center for Disease Control and Prevention report that 22% of 18 -year-old women in the United States have a body mass index (BMI) of 25 or more —a value considered by the National Heart Lung and Blood Institute to be associated with increased health risk. As part of a routine health check at a large college, the physical education department usually requires students to come in to be measured and weighed. This year, the department decided to try out a selfreport system. It asked 200 randomly selected female students to report their heights and weights (from which their BMIs could be calculated). Only 31 of these students had BMIs greater than 25.

Example 2 Conditions Random Condition Independence Condition 10% Condition Success/Failure Condition

Example 2 Conditions Random Condition Independence Condition 10% Condition Success/Failure Condition Observed proportion

Example 3 Assume that 30% of students at a university wear contact lenses. We randomly pick 100 students. What’s the appropriate model for the sampling distribution? Specify the name of the distribution, the mean, and the standard deviation. Be sure to verify that the conditions are met.

Example 3 Conditions Random Condition Independence Condition 10% Condition Success/Failure Condition What’s the approximate probability that more than one third of this sample wear contacts?

Example 4 p. 464 #39

Example 4 p. 464 #39 Conditions: • Random • Independent • <10% of population • Big enough

Example 5 p. 464 #44

Example 5 p. 464 #44

Example 5 p. 464 #44

Example 5 p. 464 #44

Warm Up Assume that 25% of students at a university wear contact lenses. We randomly select 200 students. What is the distribution of the proportion of students who wear contact lenses? A) N(. 25, . 433) B) N(. 25, . 0009) C) N(. 25, . 75) D) N(. 25, . 1875) E) N(. 25, . 031)

Extra

CENTRAL LIMIT THEOREM Chapter 17

Do you believe in ghosts? 2005 the Harris Poll 889 adults– 40% 2005 CBS News poll 808 adults – 48% How can we explain the difference?

Do you believe in ghosts? Let’s run a simulation http: //www. rossmanchance. com/applets/One. Prop. htm

http: //onlinestatbook. com/stat_sim/sampling_dist/

http: //onlinestatbook. com/stat_sim/sampling_dist/

Central Limit Theorem When we are looking at sample means, their distribution will be approximately normal, no matter what shape the population was.

Inference theory, methods, and practice of forming judgments about the parameters of a population, usually on the basis of random sampling

Two Pathways of Inference

Example 1 Conditions: • Random Condition • Independence Condition • <10% Condition • Success/Failure Condition

Warm Up Assume that the duration of human pregnancy can be described by Normal model with mean 266 days and standard deviation 16 days. For a random sample of 100 women, describe the appropriate sampling distribution model (shape, center, and spread).

Warm Up In a large population of adults, the mean IQ is 112, with a standard deviation of 20. Suppose 200 adults are randomly selected for a market research campaign. What is the probability that the sample mean IQ is greater than 110? A) 0. 922 B) 0. 579 C) 0. 079 D) 0. 421

Two Pathways of Inference

But… You aren’t taking a bunch of samples…you’re only going to take 1! and we want it to predict the parameter We already know some ways to get a good sample Inference is using our sample statistic to predict our parameter with a certain degree of confidence.

Sampling distribution p

Conditions To make and use the model we need to check conditions Random/representative sample Independent <10% of population (not too big) Success/Fail np≥ 10 nq≥ 10 (not too small)
- Slides: 52