NASA Design Team Tiltrotor Aircraft Vertical Takeoff Rescue


 Amphibious")


-415 a = 0. 5 airfoil was selected for")


 Fuel")


- Slides: 51
NASA Design Team Tiltrotor Aircraft Vertical Takeoff Rescue Amphibious Firefighting Tiltrotor 1
Group Members Ryan Berg Alex Carra Michael Creaven Joseph Diner Meagan Hom Ryan Paetzell Jason Smith Alan Steinert James Tenney Bryant Tomlin 2
RFP Purpose: Rescue Missions, and Aerial Firefighting Vertical Take Off and Landing (VTOL) Amphibious Landing and Take Off Range of 800 nm 50 passengers Cruise of 300 kts 3
Conventional Concept 4
Quad Rotor Concept 5
Dual Fuselage Concept 6
Reasoning Weight Quad-Rotor Dual Fuselage Conventional 8 7 6 5 4 3 1. 82 1. 41 2. 52 1. 15 1 1. 16 1. 07 1. 11 1. 09 2 1 1 1 2 6 12 8 6 4 3 57. 23 2 3 3 39. 29 3 1 1 1 2 1 36 1 3 2 1 1 2 111 168. 23 55 94. 29 74 110 Power Required (VTOL) L/D (Cruise @ 10, 000 ft) Fuel Weight Disk Loading Max Bending Moment CG Movement Quantitative TOTAL Ease of operation Water stability Rescue Operations System complexity Maintenance Service Life Qualitative TOTAL OVERALL TOTAL 7
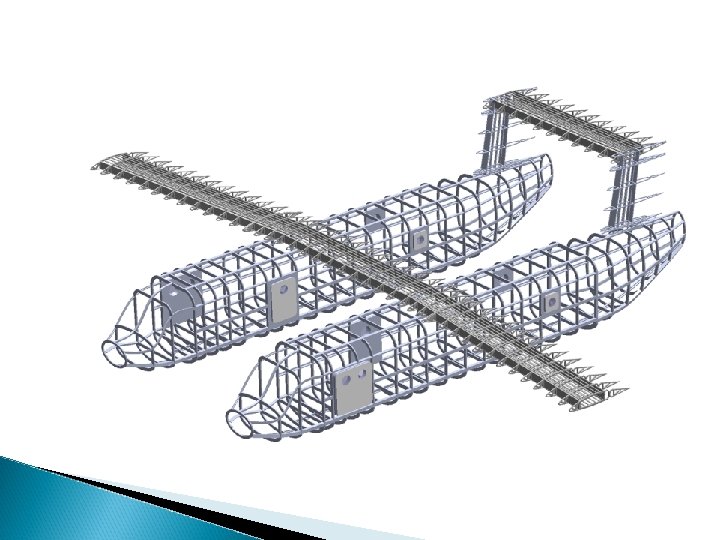
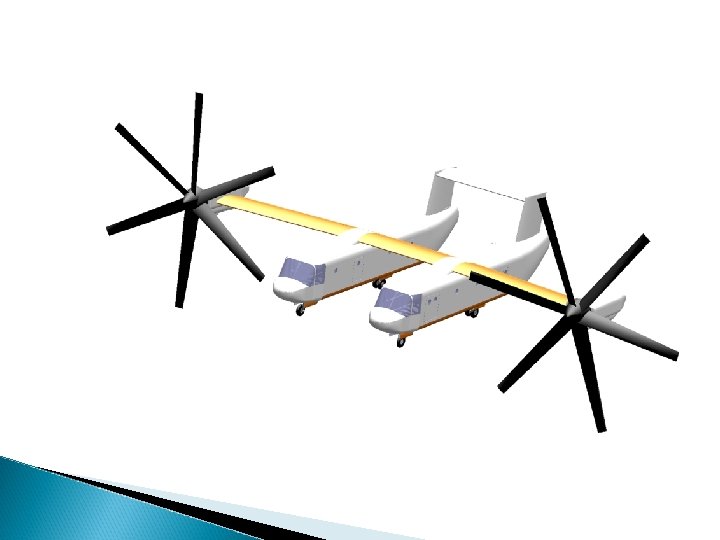
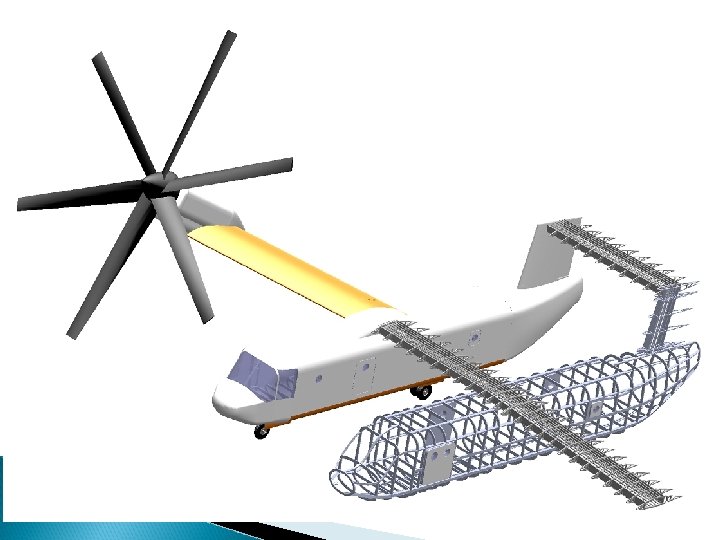
3 View Drawing of V. T. R. A. F. T. 8
V. T. R. A. F. T.
Specifications Wing Span = 76. 5 ft Wing Area = 625 ft 2 Cruise L/D = 12 Gross Takeoff Weight (VTOL) = 62, 460 lb Gross Takeoff Weight (short takeoff) = 70, 000 lb Fuel Weight = 10, 175 lb Max Power Available = 12300 shp Max Speed = 333 kts Rotor Diameter = 42 ft Range = 800 nm 10
Mission Profile 4 3 2 1 10 5 5 6 9 8 7 11 12 13 1 Vertical Takeoff (2100 ft/min) 2 Transition(30 sec) 3 Climb 4 Cruise 5 Glide down 6 Conversion 7 Landing 8 Vertical Takeoff (2100 ft/min) 9 Transition 10 Climb 11 Cruise 12 Glide down 13 Conversion 14 Landing 14 11
Engine: Rolls- Royce AE 1107 C-Liberty Turboshaft Shp 6150 Dimensions 78. 1 by 43. 2 in Weight 971 lbs 14 stage compressor/2 stage high and 2 stage low pressure turbine Self- lubricating system for VTOL operation Maximum Thrust Produced: 77053 lb Thrust Produced in VTOL: 6950 lb (Rolls- Royce) 12
Nacelle Design 13
Gearbox Configuration 14
Rotor Design Airfoil r/R XN 25 0. 06 Radius 21 ft XN 18 0. 12 Number of blades 6 XN 12 0. 5 Chord 2. 97 ft XN 08 0. 75 Twist 39 deg (-48 deg inboard/-30 deg outboard) XN 06 0. 99 Material Fibrous Composite with titanium alloy abrasion strip Disk Loading 21. 98 lb/ft 2 Solidity 0. 27 Figure of Merit 0. 81 Propeller Efficiency 0. 78 Coeff. Of Thrust 0. 02 Tip Speed Ratio 1. 78 Rotor airfoil sections and positions as fraction of rotor length (Romander) 15
Airfoil Selection • • NACA 65(216)-415 a = 0. 5 airfoil was selected for all three wings. Airfoil Characteristics: • High CL at 0 degrees AOA • Maintains performance characteristics even at low Reynolds number • Promotes laminar flow over middle wing Source: Raymer, Aircraft Design: A Conceptual Approach
Wing Sizing Planform Area = 625 ft 2 L/D in cruise was calculated over a range of wingspans using a MATLAB drag estimation program Max obtainable L/D = 12 Corresponding wing span = 76. 5 ft AR = 9. 36 17
Full Configuration Drag Estimation A drag estimation program provided by Dr. Gur was used to verify the calculated L/D for the aircraft. A basic VSP representation of the aircraft, as shown on the right, was analyzed at cruise conditions. An L/D value of 12. 5 was calculated by the program. 18
Aerodynamic Results 19
Stability and Control Roll rate 3. 0 o/sec per inch of stick Yaw rate 3. 0 o/sec per inch of stick Pitch rate 4. 5 o/sec per inch of stick A total of 6 in of stick Aircraft is Dynamically stable 7%MAC static margin Flaperons 35% chord and are deflected The rudder is a symmetrical airfoil (NACA-0012) and the rudder is located at 25% chord The horizontal tail is at an incidence angle of -1. 2 o, and the elevator is located at 35% chord Structural design of a rib with the Flaperon 20
Control Limits Angle of Attack -8 o to 12 o 21
Transition Nacelles rotate at 3 o per second ◦ Due to excessive vibrations in transition ◦ Pilot Safety Nacelle limits are 0 o to 100 o Transition 22
Water Stability Capable of takeoff in a sea state of up to 4. Sea State 4 ◦ Waves of 5 to 8 ft and wind speeds of 17 to 27 kts Determined through static wave analysis 23
Structures-Goals Design for Multiple Loading Conditions ◦ Aerodynamic Loading ◦ Vertical Takeoff/Helicopter Loads ◦ Water Loads Lightest Possible Structure ◦ Strut Braced Wing ◦ Composite Materials ◦ Wing Skin Tapering Simple Mediation of Aeroelastic Effects ◦ Static Wing Tip Deflection Constraints 24
V-n Diagram Maximum Load Factor: 3 Minimum Load Factor: -1 Cruise Speed: 300 kts Dive Speed: 405 kts CLmax= 1. 5 CLmin= -1. 0 26
Wing Loading Conditions With resulting shear and moment diagrams for traditional wing 27
Strut Feasibility Study Moment, ft-lb Vertical Takeoff 28
Strut Feasibility Study Moment, ft-lb Vertical Takeoff 29
Strut Feasibility Study Strut Braced wing divided into two sections due to large stresses imparted on the center wing Weight reduction from strut minimal due to center wing stresses Total SBW Weight: 5569 lb Weight Reduction: 170 lb Traditional Wing Thickness Flange Thickness Web Area Wing Box Wing Spar Weight # of Stringers Rib Spacing Area Stringer 0. 0475 ft 0. 0390 ft 0. 4191 ft 2 5739 lb 4 2 ft 0. 0035 ft 2 Strut Braced Wing (Outboard) 0. 019 ft 0. 018 ft 0. 1812 ft 2 1836 lb 4 2 ft 0. 001 ft 2 Strut Braced Wing (Inboard) 0. 095 ft 0. 021 ft 0. 7951 ft 2 2835 lb 9 1. 83 ft 0. 0025 ft 2 Strut N/A 0. 1 ft 2 454 lb N/A N/A 30
Wingbox Design Wingbox idealized as rectangle ◦ Rear Spar placed at 54. 3% chord ◦ Front Spar at 16. 6% chord MATLAB routine written to vary size of structural components Combination of structural components yielding the lightest structure selected Wing skin thickness tapered linearly from outboard wing root to tip ◦ Wing tip skin thickness 0. 005 ft Materials- ◦ PEEK/IM Carbon Fiber (0°, 90°, ± 45°)- Spars ◦ Cyanate Ester/HM Carbon Fiber (0°, 90°, ± 45°) 31
Wingbox Design Wing Skin tapering 0. 5 ft maximum tip deflection constraint Moments of inertia for each configuration checked versus contour plot Weight Reduction: 327 lb 32
Results Cross Sectional Area of Wingbox ◦ Root 0. 3156 ft 2 ◦ Tip 0. 2036 ft 2 Weight of Wingbox 2161 lb Maximum Tip Deflection : ◦ 0. 44772 ft (5. 37 in) 33
Validation Structural Solidworks CAD Model of outboard wing structure created Finite Element Analysis conducted using ANSYS v. 12 FEA results for tip deflection compared to MATLAB results 34
Validation 35
Fuselage Design Loading Conditions Aerodynamic Loading ◦ All weights assumed to be equally distributed or a point force ◦ Fuselage pinned at the center of lift Water Landing ◦ Fuselage must have a zero moment around the center of gravity ◦ Buoyancy Force must counteract the moment force around the center of gravity caused by the weight distribution 36
Fuselage Design Results Aerodynamic loading caused much larger moments Aero Load Factor=4. 5 Water Load Factor=8. 34 Aerodynamic loading case turned out to be the limiting case Final Calculated Values Bulkhead Spacing (ft) 3 Longeron Width (in) 3 Longeron Thickness (in) Skin Thickness (in) 0. 0629 0. 05 37
Cabin layout Can hold 50 passengers and 6 crew Two side doors Can carry standard 40 x 48 in pallet Uses new seats in V-22 from Golan Industries/Army Division Winches for cargo loading and rescue 38
Cockpit and Landing Gear Cockpit Utilizes electronic controls Features HUD Landing Gear Bicycle design 66. 3% TOGW on main wheels at 35° off CG Front tire Main tire Size 21 x 7. 25 -10 27. 75 x 8. 7514. 5 Speed Max Load (mph) (lb) 210 6400 Max Pressure (psi) 166 Max width Max diam. (in) 7. 2 21. 25 Wheel diam. (in) 10. 0 PLY Rating 12 225 320 8. 75 14. 5 24 21500 27. 75 1 2 3 4 5 6 7 8 9 10 11 12 Multifunctional Displays HUD Misc. Switches Standby Flight Display Flight director Altimeter and Airspeed Throttle Controls Control Pedals Control Stick Engine Instrument Alert Sys. ECS and Landing Gear Controls Lights, Icing and Radio Controls 39
Main Systems Flight Control Sys. Electrical Control Sys. ◦ Triple redundant FCCs ◦ FADEC and AFCS ◦ Four Honeywell 90 k. VA generators ◦ Hamilton Sundstrand Power System T-62 T-46 -2 APU ◦ Single lead acid battery, which provides 24 VDC Hydraulic Control Sys. Environmental Control Sys. Fuel System ◦ Oxygen-enriched air for crew breathing is provided at 6 stations ◦ GKN Aerospace deicing sys. ◦ 1000 gal of fuel in 18 tanks ◦ Fuel transfered between tanks to maintain balance ◦ Aerial and ground capabilities 40
Rescue and Firefighting Capabilities Rescue ◦ Goodrich 42305 rescue winch 600 lb of lift and 200 ft of useable cable length ◦ Can carry 36 litters ◦ Aeromedical bay in left fuselage Firefighting ◦ ◦ In water or hovering at 10 ft 1500 gal (750 gal in each fuselage) American Turbine AT-309 pumps released through a 20 x 35 in door 41
Recommendations for Further Study Water Tank Tests ◦ Water Ingestion ◦ Sea State Tests H-V Diagram Wind Tunnel Tests ◦ Aeroelastic Effects ◦ Interference Drag Downwash Verification 42
43
44
Questions 45
CFD Analysis of Airfoil 46
Cost RDT&E + Flyaway $ 52, 603, 400 Operation and Maintenance (per year) Fuel Cost $ 792, 947 Crew Cost $ 770, 964 Maintenance Costs $ 1, 277, 213 TOTAL $ 2, 841, 125 Methods described in Raymer Based mainly off empty weight, maximum speed, the desired production output in five years, number of flight test aircraft, cruise velocity and take off gross weight
V. T. R. A. F. T. 49
Strut Feasibility Study Addition of a strut can reduce structural weight but also increases aerodynamic drag Traditional and Strut Braced wings were designed to satisfy the loading conditions specified Weights for each design compared to judge the benefits 51