Name the following functions Quadratic Cubic Absolute Value

Name the following functions. Quadratic Cubic Absolute Value

Math III Support EQ: What characteristics of functions can we find by looking at a graph? Standard: MM 1 A 1 d

Relation Any set of input that has an output

Function A relation where EACH input has exactly ONE output

Key Terms

Making an Input-Output Table Figure 1 Figure 2 Figure 3 Figure 4 Figure 5 Figure 6

Domain and Range Domain: {1, 2, 3, 4, 5, 6} Range: {1, 3, 6, 10, 15, 21}

1. Look at the input and output table – Each input must have exactly one output. 2. Look at the Graph – The Vertical Line test = NO vertical line can pass through two or more points on the graph
, (4, 3), (5, 4), (6, 5)}")
Example 1: {(3, 2), (4, 3), (5, 4), (6, 5)}

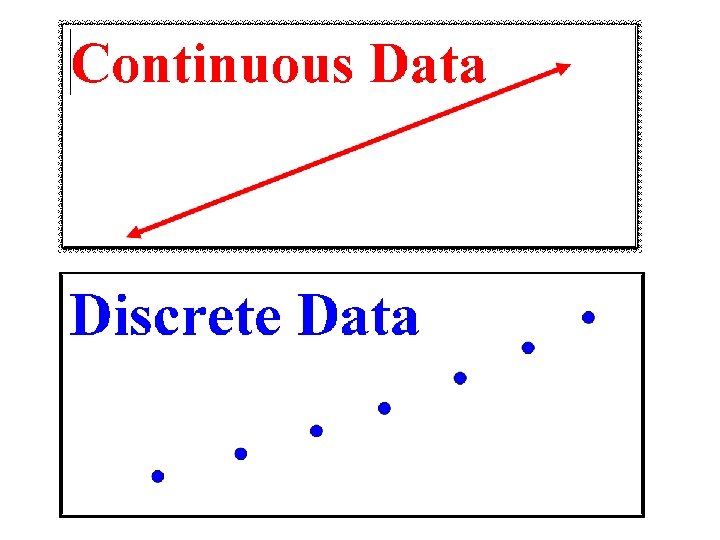
Domain & Range • Discrete graphs – you just LIST the domain and range • Continuous graphs – you use set notation
, (4, 6),")
Domain and Range: Points Find the domain and range: {(2, – 3), (4, 6), (3, – 1), (6, 6), (2, 3)} domain: {2, 3, 4, 6} range: {– 3, – 1, 3, 6}

Set Notation Uses: Is used when there is a open dot or the number is NOT included on the graph. Is used when there is a closed dot or when the number is included on the graph. Is used when one number is excluded.

Domain and Range: Graph

Domain and Range: Graph

Domain and Range: Graph Special case: When there is an open circle and closed circle on the same number – go with the closed circle.

Domain and Range: Graph

Domain and Range: Graph

Domain and Range: Graph

Maximum or Minimum Point • Max. Point – is the HIGHEST on the graph • Min. Point – is the LOWEST on the graph
")
Maximum or Minimum Value? Where? Max. Point (0, 4)
")
Maximum or Minimum Value? Where? Min. Point (-1, -9)

ZEROS are the same thing as the X-INTERCEPTS.
 and (3, 0)")
Name the zeros. (-4, 0) and (3, 0)
")
Name the Y-INTERCEPT. (0, -4)

Increasing and Decreasing To find where the graph is increasing and decreasing trace the graph with your FINGER from left to right. x-values ONLY!

Increasing & Decreasing MOVE LEFT TO RIGHT «If your finger goes UP, the graph is increasing. «If your finger goes DOWN, the graph is decreasing. «If your finger goes neither up or down…then the graph is CONSTANT.

Increasing & Decreasing Increasing: Decreasing:

Increasing & Decreasing Increasing: Decreasing:

Increasing and Decreasing Increasing: Decreasing:

Increasing and Decreasing Increasing: Decreasing:

End Behavior Is figuring out what the graph is doing as x approaches +�and as x approaches -�

End Behavior This is when you look at the LEFT and RIGHT “arm” of the graph.

End Behavior If the “arm” is going UP, then write +¸. If the “arm” is going DOWN, then write -¸. 2 special cases: square root & rational

Describe the End Behavior

Describe the End Behavior

Describe the End Behavior

Describe the End Behavior

Describe the End Behavior

Describe the End Behavior

Describe the End Behavior

Relation – Any set of input that has an output Function – Is a relation that every single input has exactly one output Input (x-coordinate) is also called the Domain Output (y-coordinate) is also called the Range

Characteristics of Functions Domain: Range: Intervals of Increase and Decrease: End Behavior: Max: Min:

Characteristics of Functions Domain: Range: Intervals of Increase and Decrease: End Behavior: Max: Min:

Characteristics of Functions Domain: Range: Intervals of Increase and Decrease: End Behavior: Max: Min:

Constant Rate of Change • The slope of a nonvertical line is the ratio of the vertical change (rise) to the horizontal change (run) between any two points on the line. • Find the slope between (2, 4) and (4, 8).

Rate of Change • The rate of change is the ratio of the change of one quantity to a change in another quantity. • Example: - The table shows the amount of water evaporating from a swimming pool on a hot day. Find the rate of change in gallons with respect to time.

Rate of Change • Where is the greatest rate of change on the graph? What is the value?
- Slides: 48