
Name something on this planet NOT connected to














- Slides: 91
Name something on this planet NOT connected to population.
How many humans share this beautiful Earth? 7, 527, 774, 211
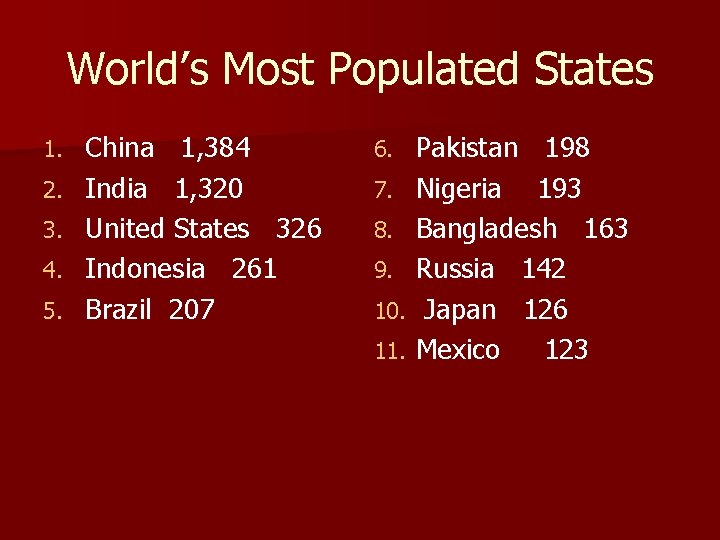
World’s Most Populated States 1. 2. 3. 4. 5. China 1, 384 India 1, 320 United States 326 Indonesia 261 Brazil 207 6. 7. 8. 9. 10. 11. Pakistan 198 Nigeria 193 Bangladesh 163 Russia 142 Japan 126 Mexico 123
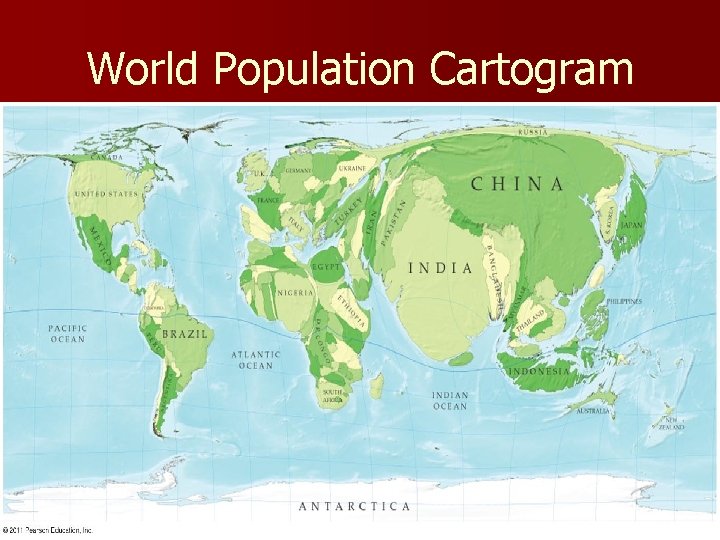
World Population Cartogram
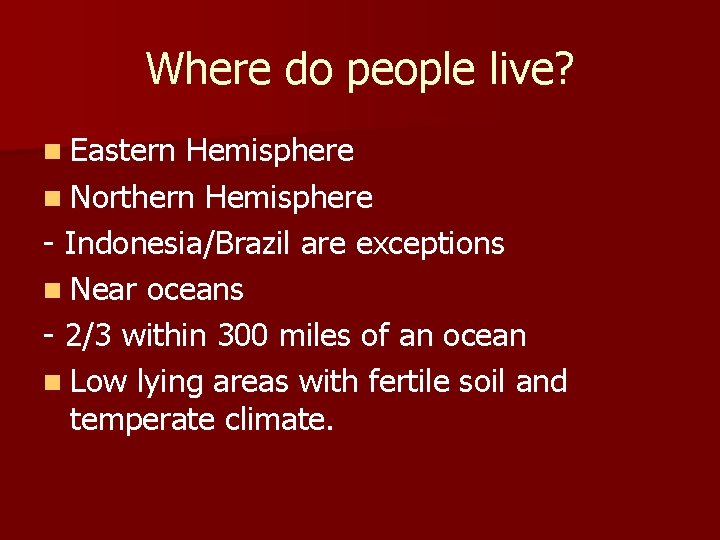
Where do people live? n Eastern Hemisphere n Northern Hemisphere - Indonesia/Brazil are exceptions n Near oceans - 2/3 within 300 miles of an ocean n Low lying areas with fertile soil and temperate climate.
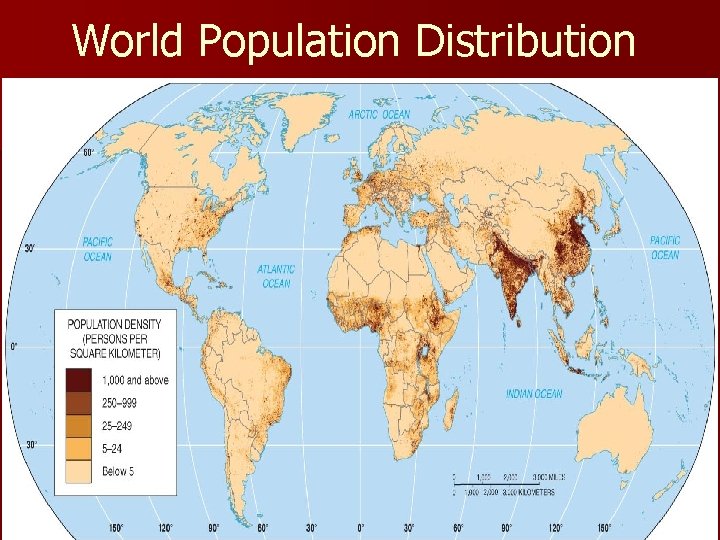
World Population Distribution Fig. 2 -2: World population is very unevenly distributed across the Earth’s surface and it can be compared to climate distribution.
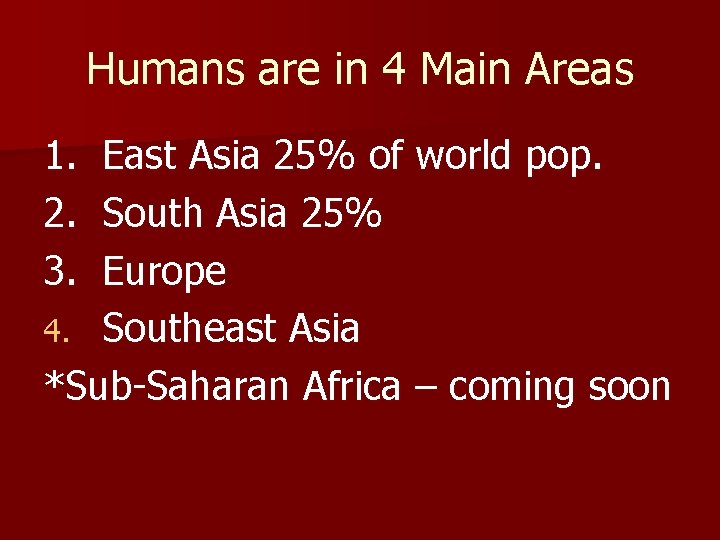
Humans are in 4 Main Areas 1. 2. 3. East Asia 25% of world pop. South Asia 25% Europe 4. Southeast Asia *Sub-Saharan Africa – coming soon
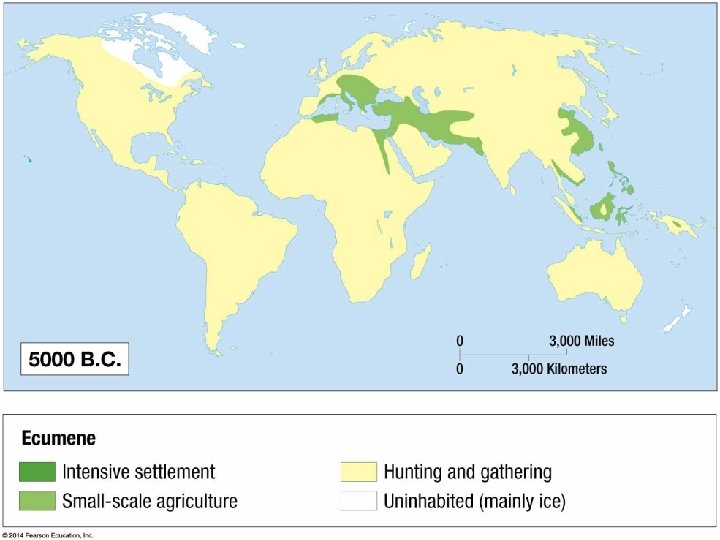
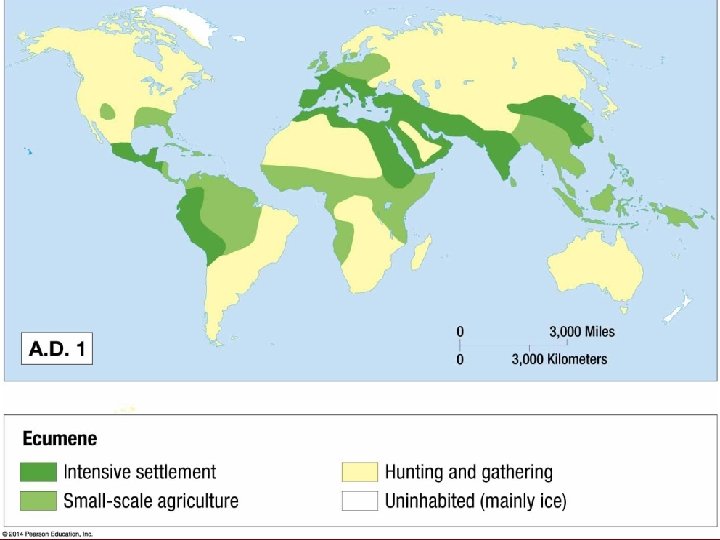
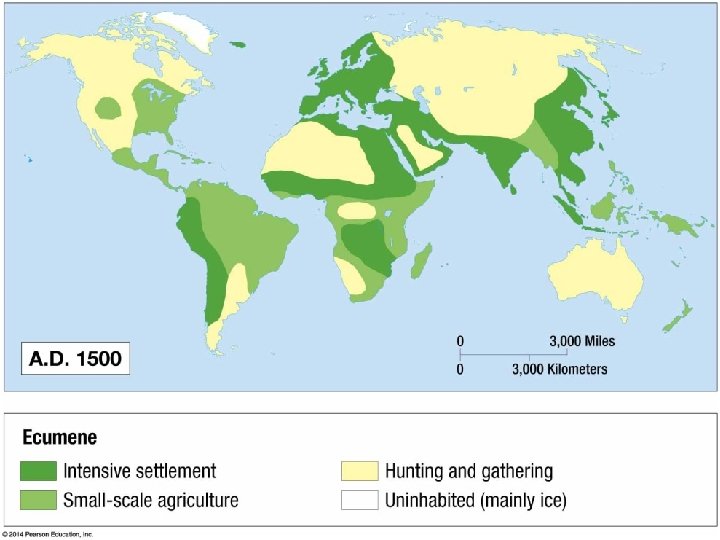
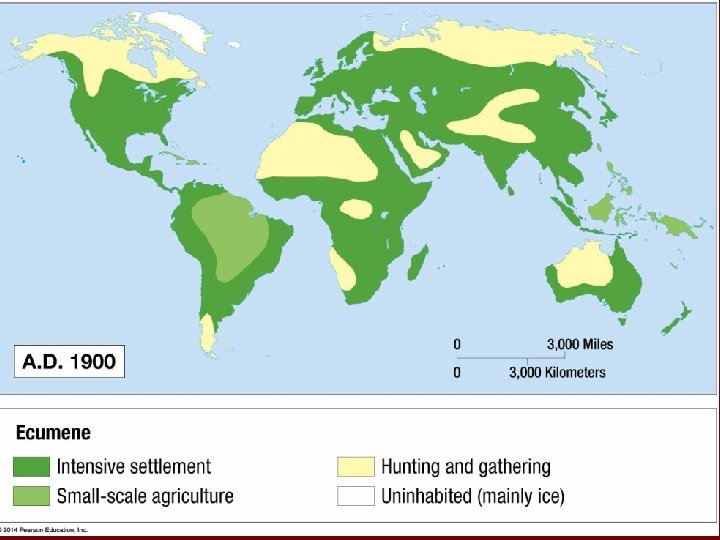
Ecumene Areas of permanent human settlement.
Fig. 2 -3: The ecumene, or the portion of the Earth with permanent human settlement, has expanded to cover most of the world’s land area.
Where do people NOT live? n. Dry Lands n. Wet Lands n. Cold Lands n. High Lands
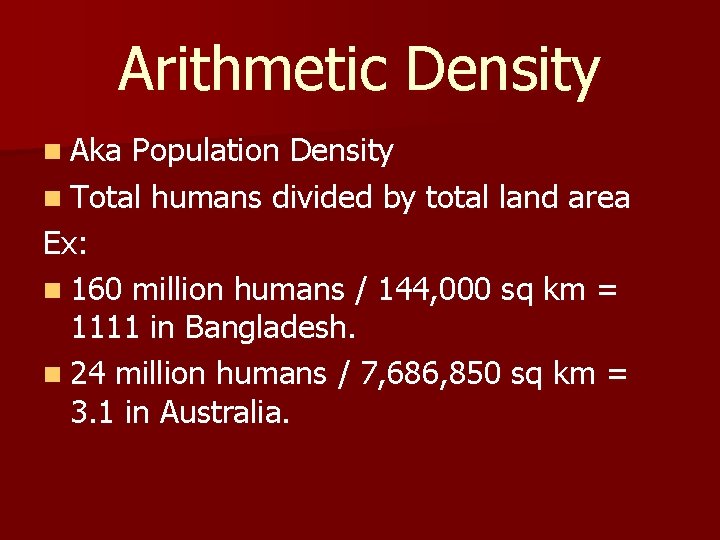
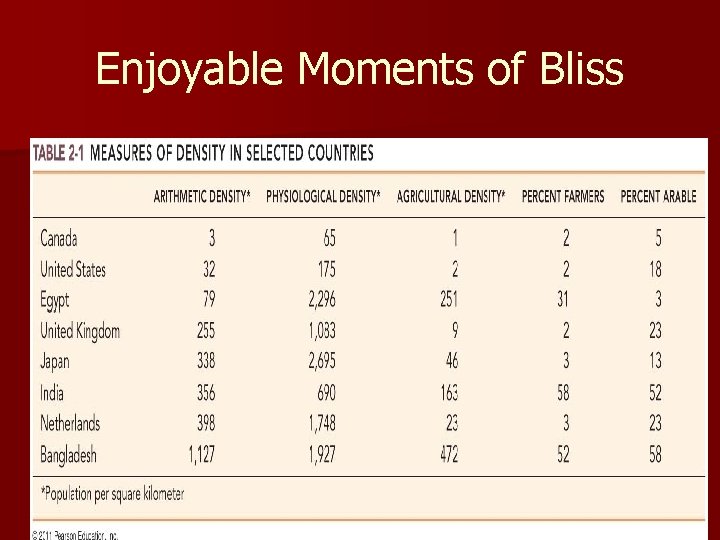
Arithmetic Density n Aka Population Density n Total humans divided by total land area Ex: n 160 million humans / 144, 000 sq km = 1111 in Bangladesh. n 24 million humans / 7, 686, 850 sq km = 3. 1 in Australia.
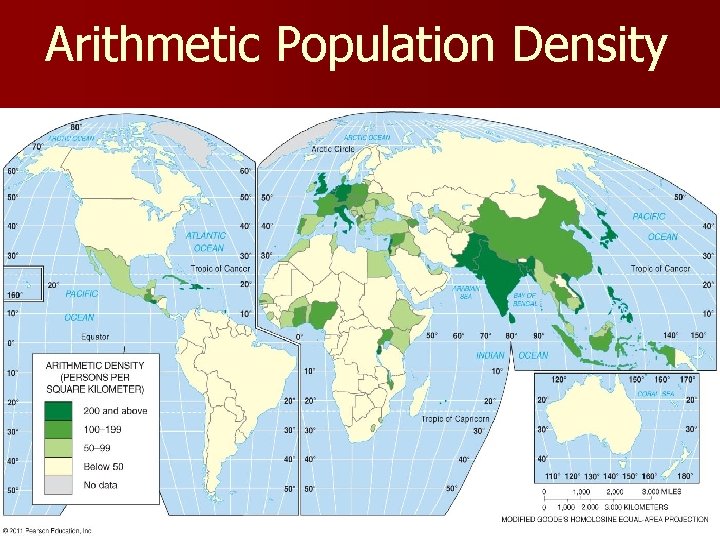
Arithmetic Population Density Fig. 2 -4: Arithmetic population density is the number of people per total land area. The highest densities are found in parts of Asia and Europe.
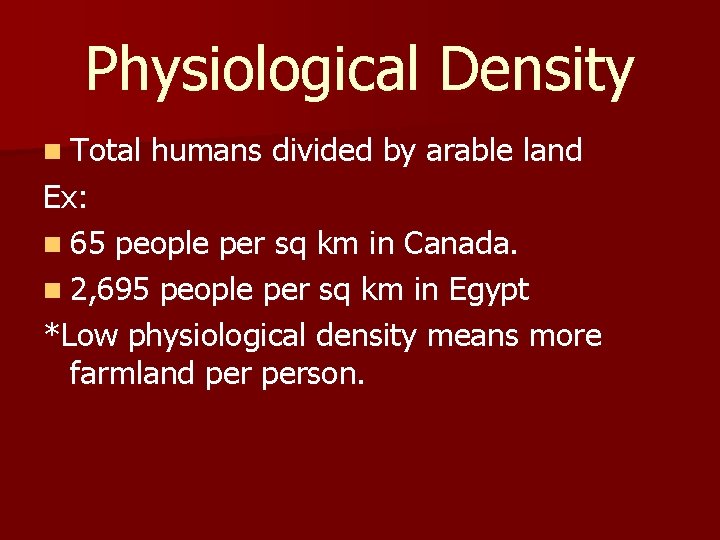
Physiological Density n Total humans divided by arable land Ex: n 65 people per sq km in Canada. n 2, 695 people per sq km in Egypt *Low physiological density means more farmland person.
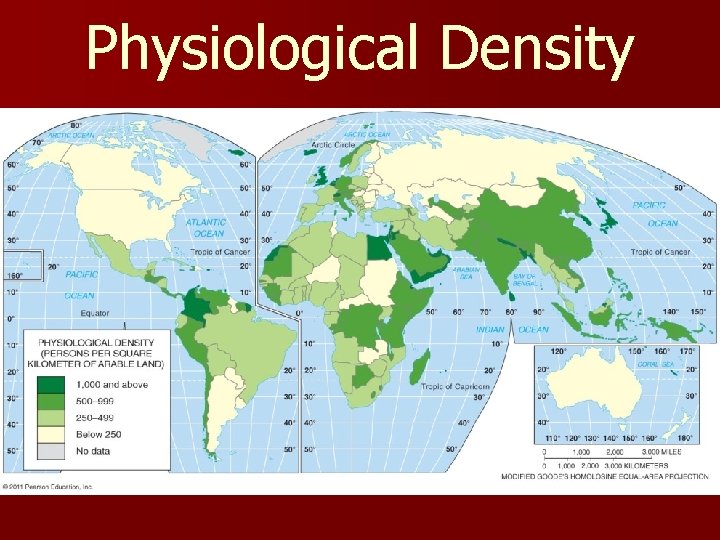
Physiological Density Fig. 2 -5: Physiological density is the number of people per arable land area. This is a good measure of the relation between population and agricultural resources in a society.
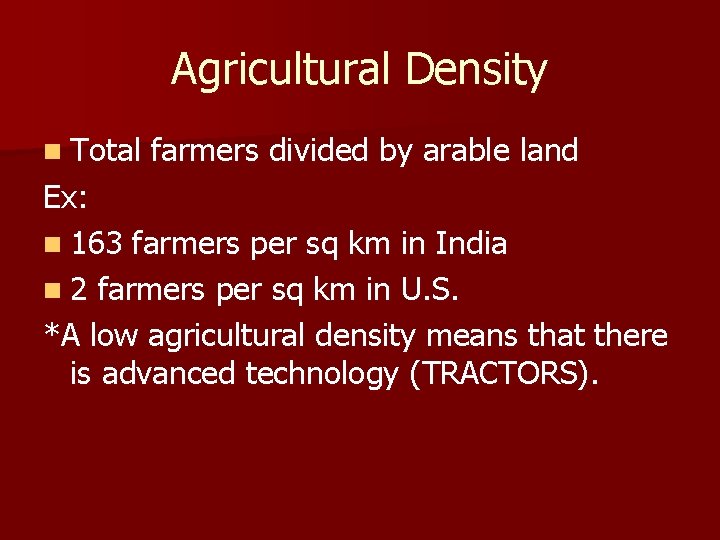
Agricultural Density n Total farmers divided by arable land Ex: n 163 farmers per sq km in India n 2 farmers per sq km in U. S. *A low agricultural density means that there is advanced technology (TRACTORS).
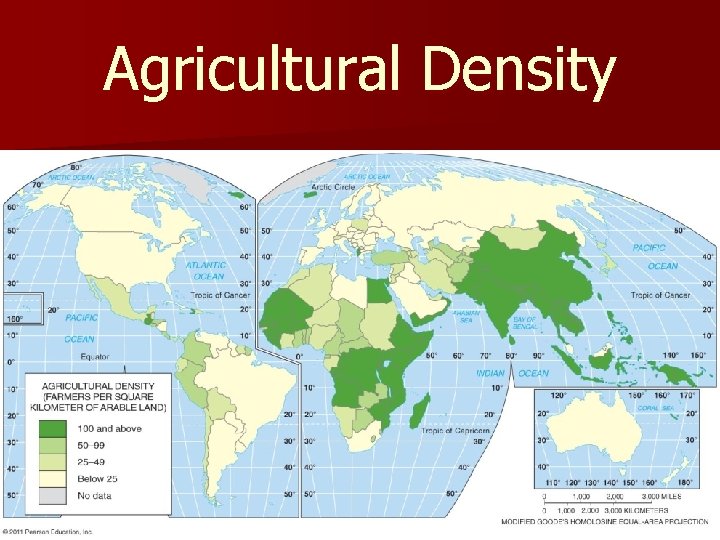
Agricultural Density
Enjoyable Moments of Bliss
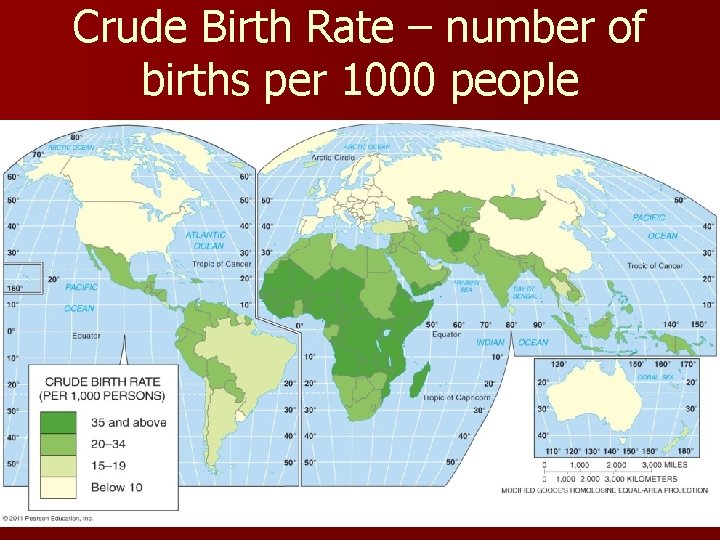
Crude Birth Rate – number of births per 1000 people The crude birth rate (CBR) is the total number of births in a country per 1, 000 population per year. The lowest rates are in Europe, and the highest rates are in Africa and several Asian countries.
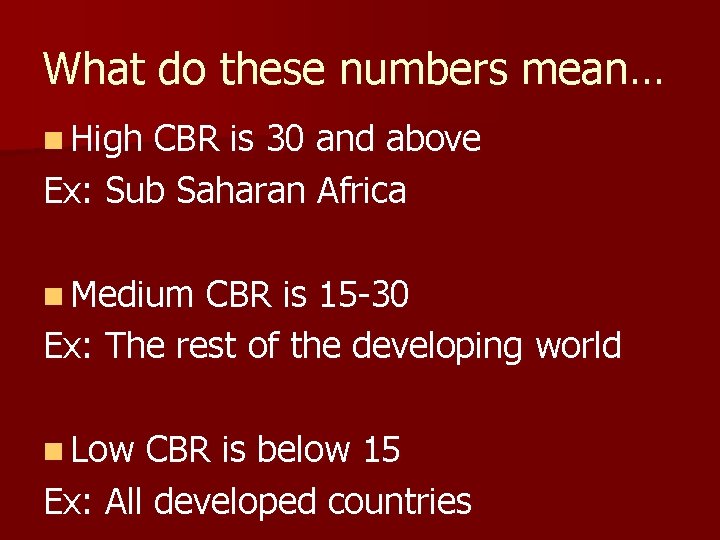
What do these numbers mean… n High CBR is 30 and above Ex: Sub Saharan Africa n Medium CBR is 15 -30 Ex: The rest of the developing world n Low CBR is below 15 Ex: All developed countries
JOTD n. What do you call the percent of mean babies? n. Rude Birth Rate
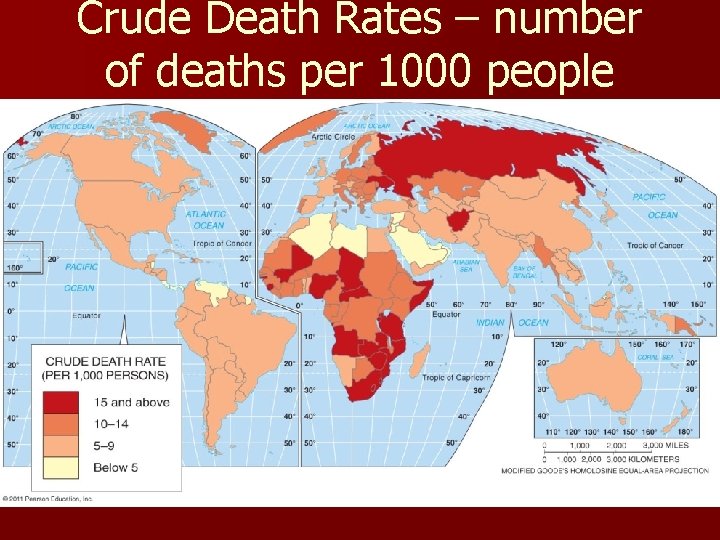
Crude Death Rates – number of deaths per 1000 people Fig. 2 -12: The crude death rate (CDR) is the total number of deaths in a country per 1, 000 population per year. Because wealthy countries are in a late stage of the demographic transition, they often have a higher CDR than poorer countries.
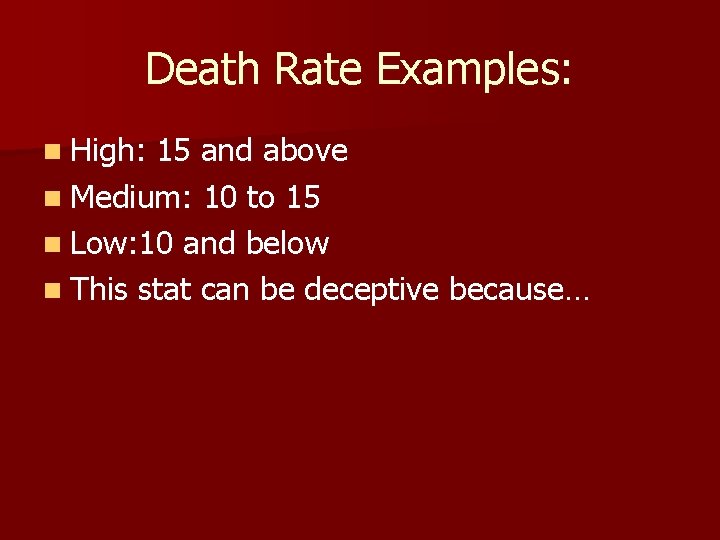
Death Rate Examples: n High: 15 and above n Medium: 10 to 15 n Low: 10 and below n This stat can be deceptive because…
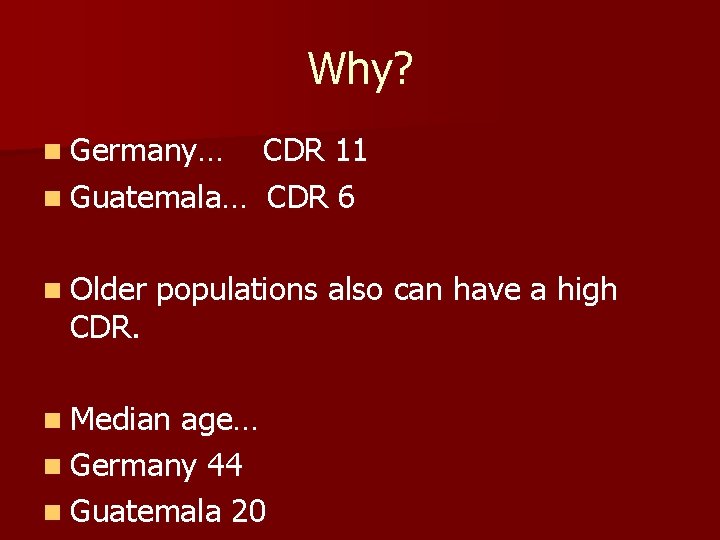
Why? n Germany… CDR 11 n Guatemala… CDR 6 n Older CDR. populations also can have a high n Median age… n Germany 44 n Guatemala 20
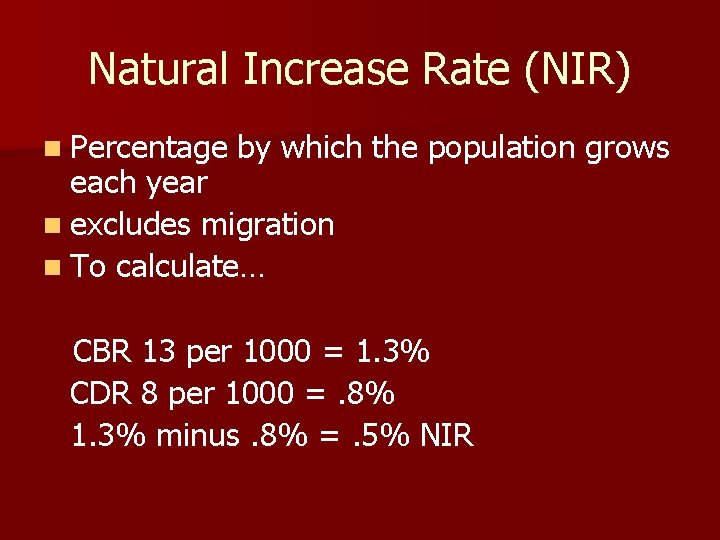
Natural Increase Rate (NIR) n Percentage by which the population grows each year n excludes migration n To calculate… CBR 13 per 1000 = 1. 3% CDR 8 per 1000 =. 8% 1. 3% minus. 8% =. 5% NIR
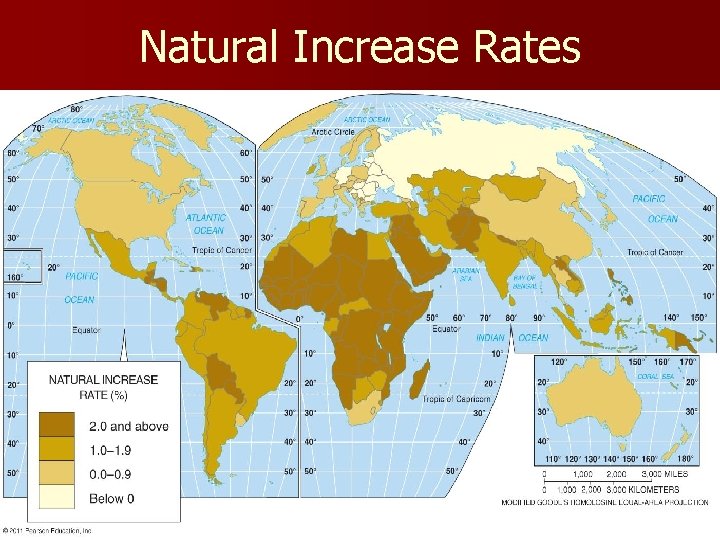
Natural Increase Rates Fig. 2 -7: The natural increase rate (NIR) is the percentage growth or decline in the population of a country per year (not including net migration). Countries in Africa and Southwest Asia have the highest current rates, while Russia and some European countries have negative rates.
Why do very small changes in NIR dramatically affect the population?
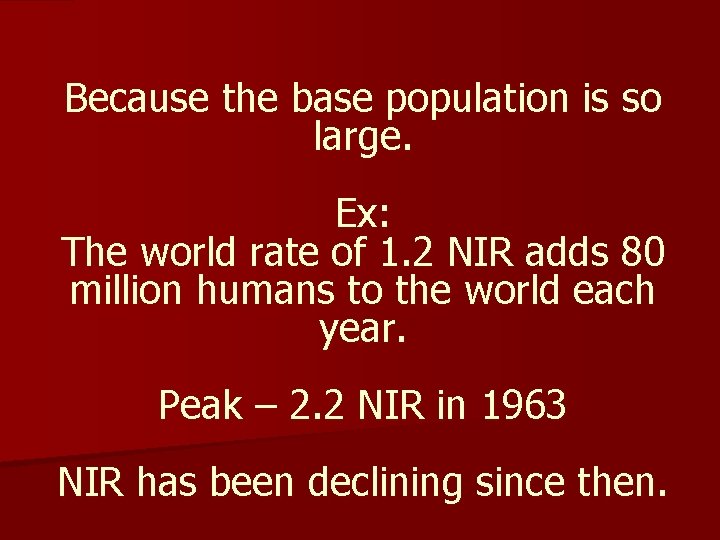
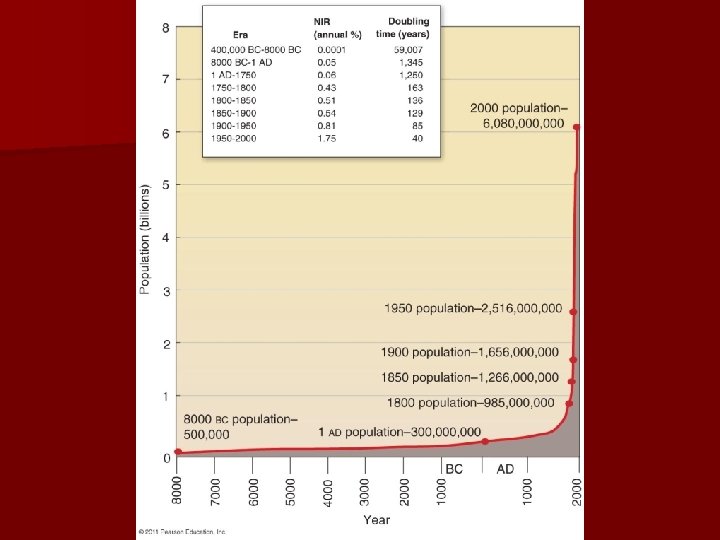
Because the base population is so large. Ex: The world rate of 1. 2 NIR adds 80 million humans to the world each year. Peak – 2. 2 NIR in 1963 NIR has been declining since then.
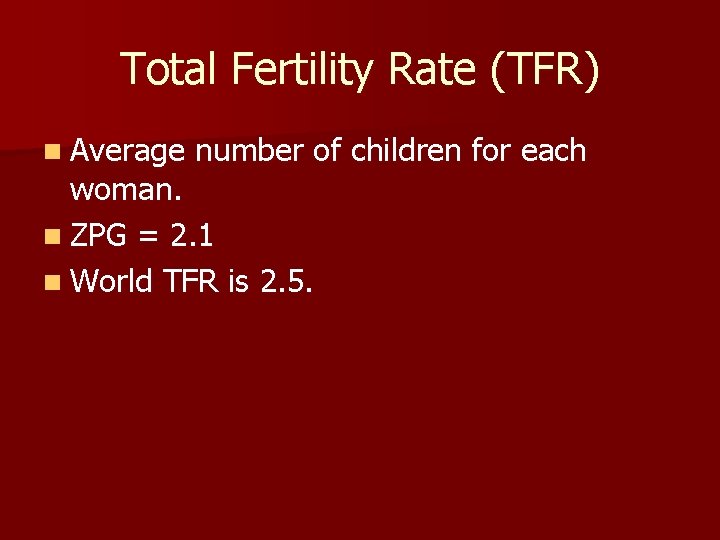
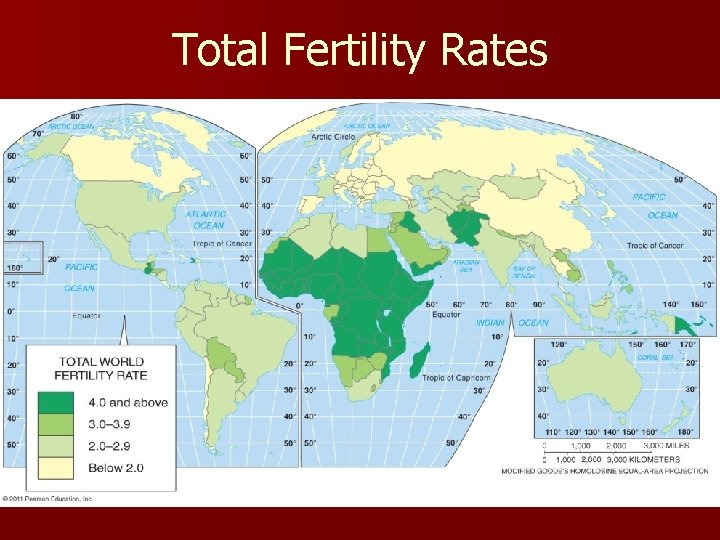
Total Fertility Rate (TFR) n Average number of children for each woman. n ZPG = 2. 1 n World TFR is 2. 5.
Total Fertility Rates Fig. 2 -9: The Total fertility rate (TFR) is the number of children an average woman in a society will have through her childbearing years. The lowest rates are in Europe, and the highest are in Africa and parts of the Middle East.
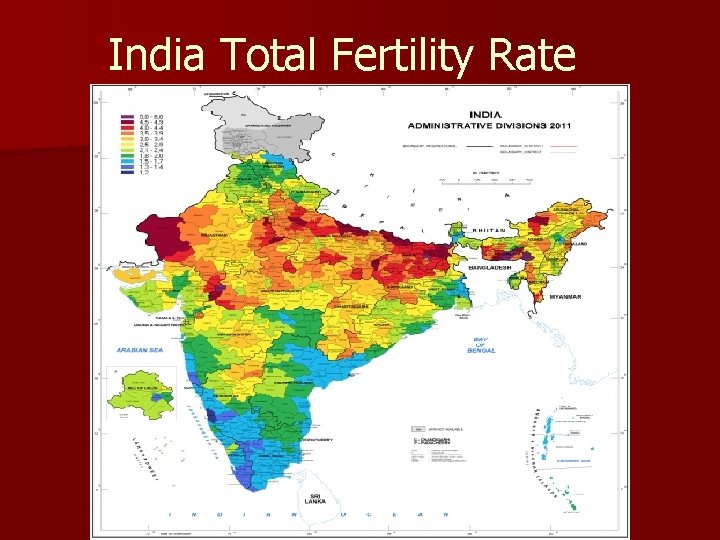
India Total Fertility Rate
If Kenya’s TFR suddenly dropped to 2, their population would still grow. Why?
Demographic Momentum n. Aka Population Momentum n. Younger populations will have more future growth due to many entering their reproductive years.
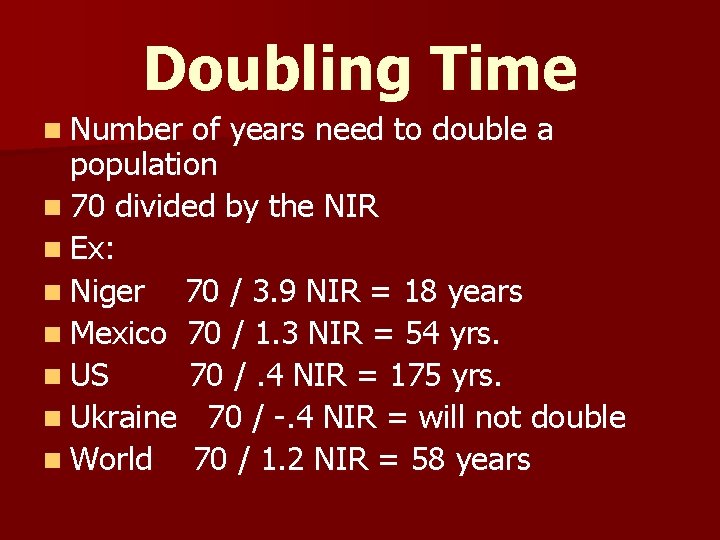
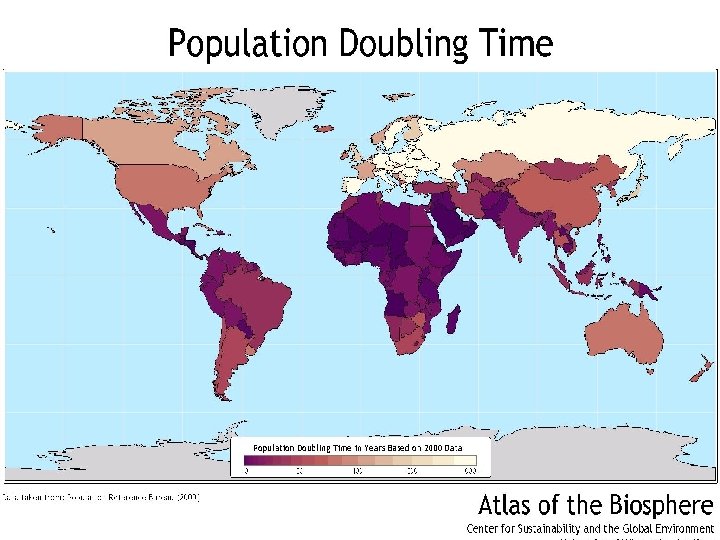
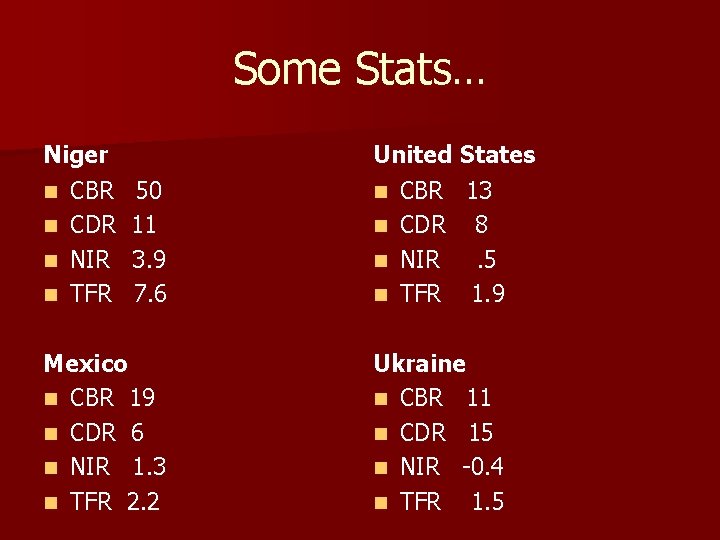
Doubling Time n Number of years need to double a population n 70 divided by the NIR n Ex: n Niger 70 / 3. 9 NIR = 18 years n Mexico 70 / 1. 3 NIR = 54 yrs. n US 70 /. 4 NIR = 175 yrs. n Ukraine 70 / -. 4 NIR = will not double n World 70 / 1. 2 NIR = 58 years
JOTD n. What is the name for the time needed for Ireland’s population to double? n. Dublin Time
Life Expectancy n Average number of years a newborn can expect to live
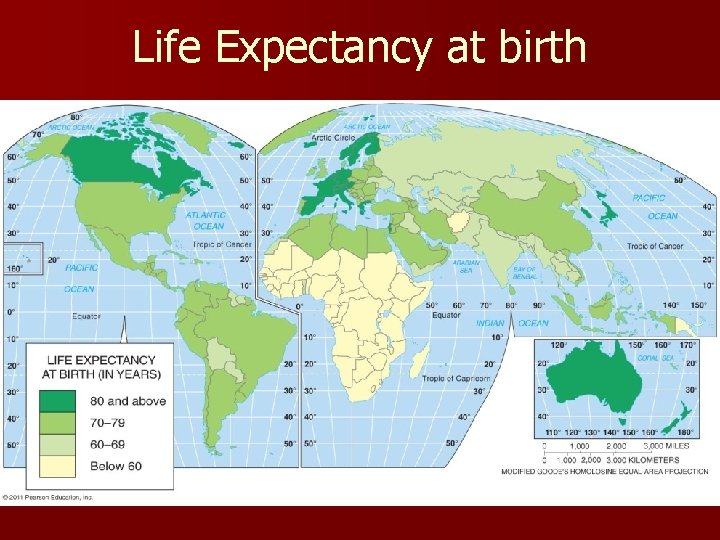
Life Expectancy at birth Fig. 2 -11: Life expectancy at birth is the average number of years a newborn infant can expect to live. The highest life expectancies are generally in the wealthiest countries, and the lowest in the poorest countries.
Some Stats… Niger n CBR n CDR n NIR n TFR 50 11 3. 9 7. 6 Mexico n CBR 19 n CDR 6 n NIR 1. 3 n TFR 2. 2 United States n CBR 13 n CDR 8 n NIR. 5 n TFR 1. 9 Ukraine n CBR 11 n CDR 15 n NIR -0. 4 n TFR 1. 5
In the year 2100, will the planet have enough food and water to sustain our world population? n Due Thursday n 7 points - seven supporting facts n ALL FACTS MUST SUPPORT ONE SIDE! n 3 points - for releasing words from your face during the debate. n 10 total points
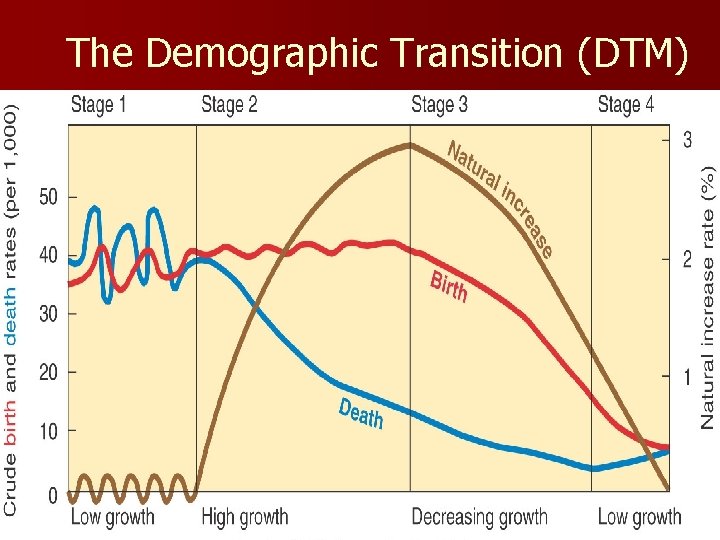
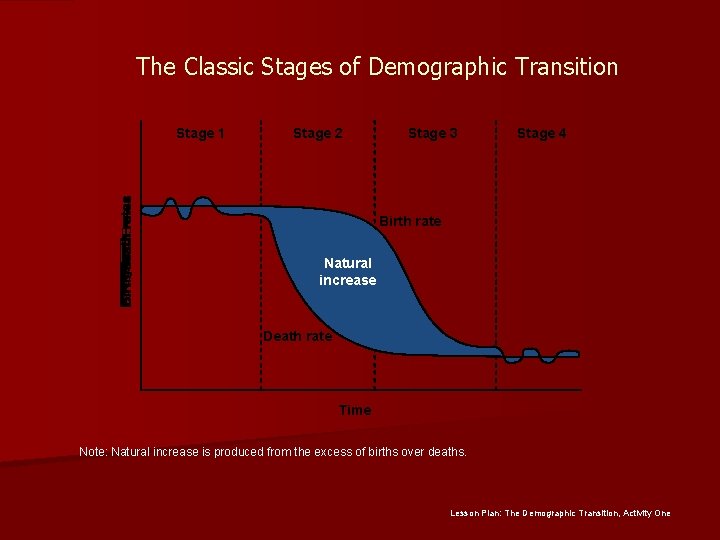
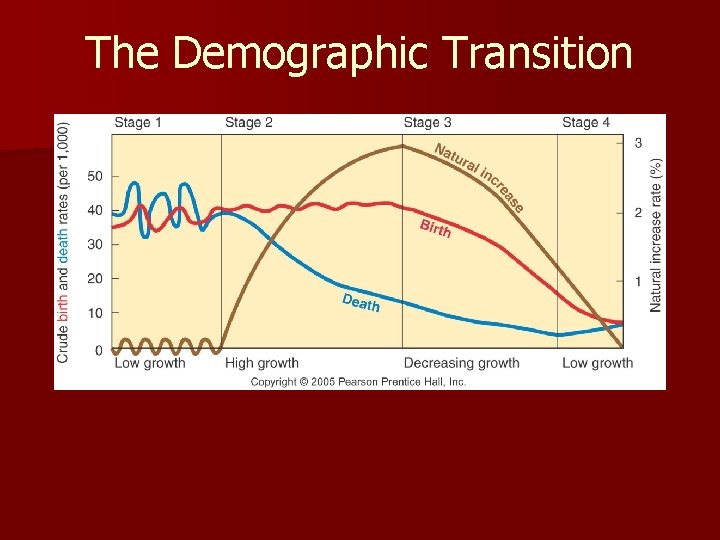
The Demographic Transition (DTM) Fig. 2 -13: The demographic transition consists of four stages, which move from high birth and death rates, to declines first in birth rates then in death rates, and finally to a stage of low birth and death rates. Population growth is most rapid in the second stage.
Stage 1 n LOW GROWTH n High CBR and High CDR n World was in this stage for first 200, 000 years n Agricultural Revolution– around 10, 000 years ago, did add to world population, but NOT ENOUGH to pull the world out of Stage 1. n Food supplies still unpredictable.
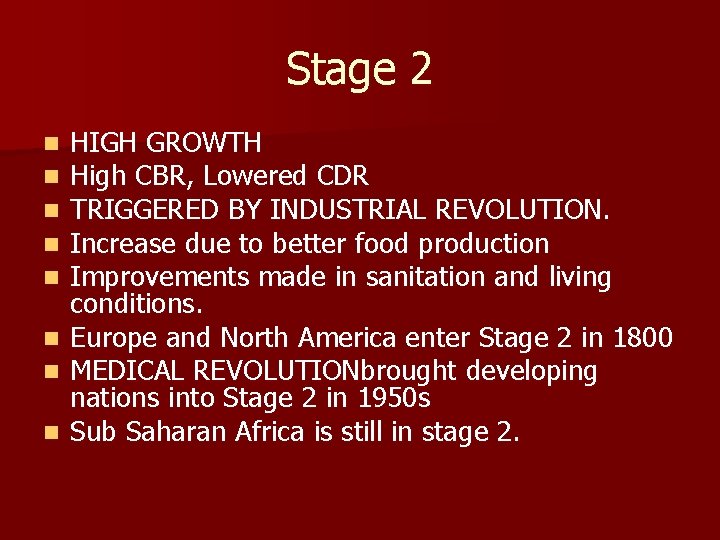
Stage 2 HIGH GROWTH High CBR, Lowered CDR TRIGGERED BY INDUSTRIAL REVOLUTION. Increase due to better food production Improvements made in sanitation and living conditions. n Europe and North America enter Stage 2 in 1800 n MEDICAL REVOLUTIONbrought developing nations into Stage 2 in 1950 s n Sub Saharan Africa is still in stage 2. n n n
The Classic Stages of Demographic Transition Stage 1 Stage 2 Stage 3 Stage 4 Birth rate Natural increase Death rate Time Note: Natural increase is produced from the excess of births over deaths. Lesson Plan: The Demographic Transition, Activity One
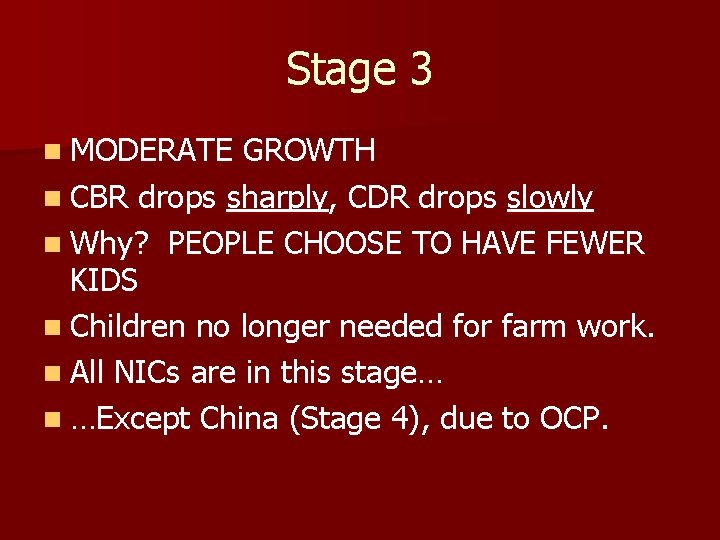
Stage 3 n MODERATE GROWTH n CBR drops sharply, CDR drops slowly n Why? PEOPLE CHOOSE TO HAVE FEWER KIDS n Children no longer needed for farm work. n All NICs are in this stage… n …Except China (Stage 4), due to OCP.
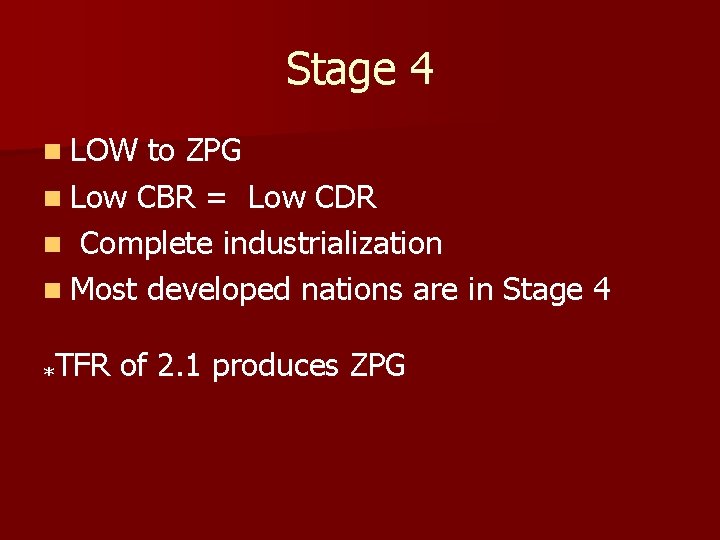
Stage 4 n LOW to ZPG n Low CBR = Low CDR n Complete industrialization n Most developed nations are in Stage 4 *TFR of 2. 1 produces ZPG
Stage 5 n DECLINING POPULATION n Negative NIR n Too many old people n Not enough women of birthing age n Most of Eastern Europe n Russia, Germany, Japan, Italy, Portugal
The Demographic Transition Fig. 2 -13: The demographic transition consists of four stages, which move from high birth and death rates, to declines first in birth rates then in death rates, and finally to a stage of low birth and death rates. Population growth is most rapid in the second stage.
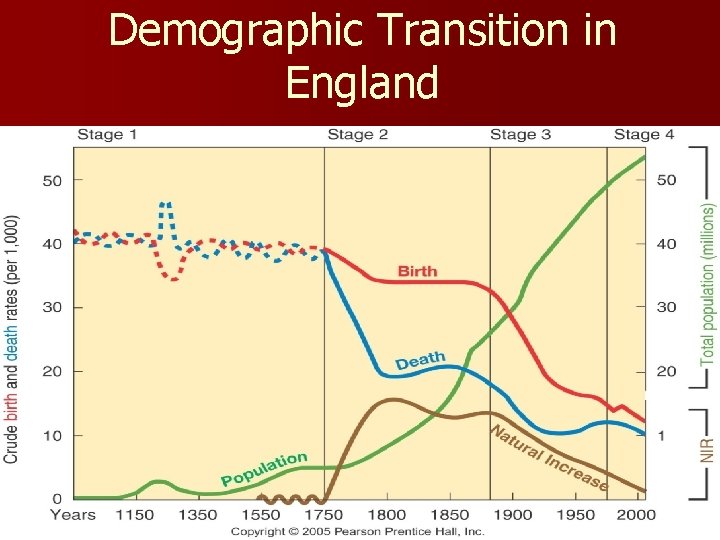
Demographic Transition in England Fig. 2 -14: England was one of the first countries to experience rapid population growth in the mid-eighteenth century, when it entered stage 2 of the demographic transition.
Epidemiologic Transition Certain diseases found in each stage of the DTM.
Stage 1 n High CDR n Horrible conditions help the spread of the disease n Ex: Black Plague in the 1300 s
Stage 2 n Rapidly declining CDR n Improved sanitation, nutrition, and medicine reduce the spread of disease n Ex: Cholera – appears in cities as they reach Stage 2.
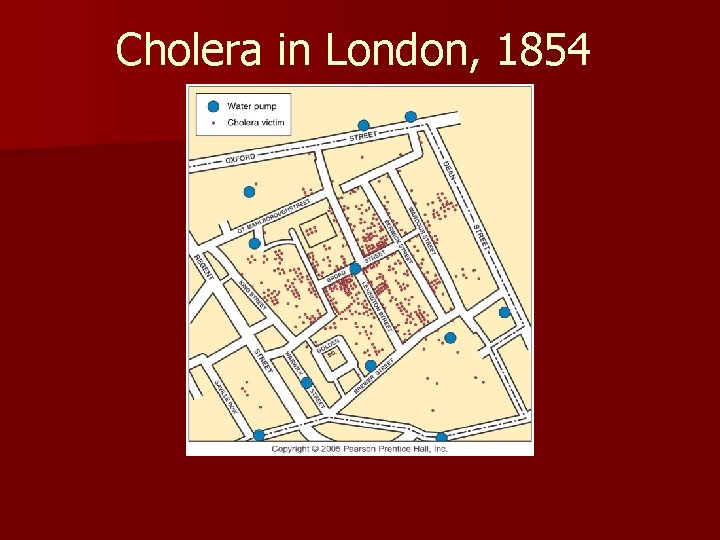
Cholera in London, 1854 Fig. 2 -23: By mapping the distribution of cholera cases and water pumps in Soho, London, Dr. John Snow identified the source of the waterborne epidemic.
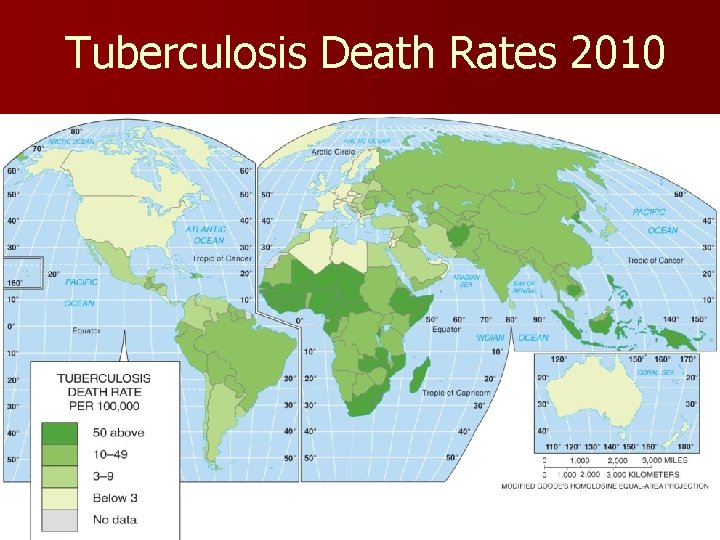
Tuberculosis Death Rates 2010 Fig. 2 -24: The tuberculosis death rate is a good indicator of a country’s ability to invest in health care. TB is still one of the world’s largest infectious-disease killers.
Stage 3 n Moderately declining CDR n Decrease in infectious diseases due to improved conditions n Increase in cancers
Stage 4 and 5 n Increase in disorders associated with aging n Ex: heart disease, cancer
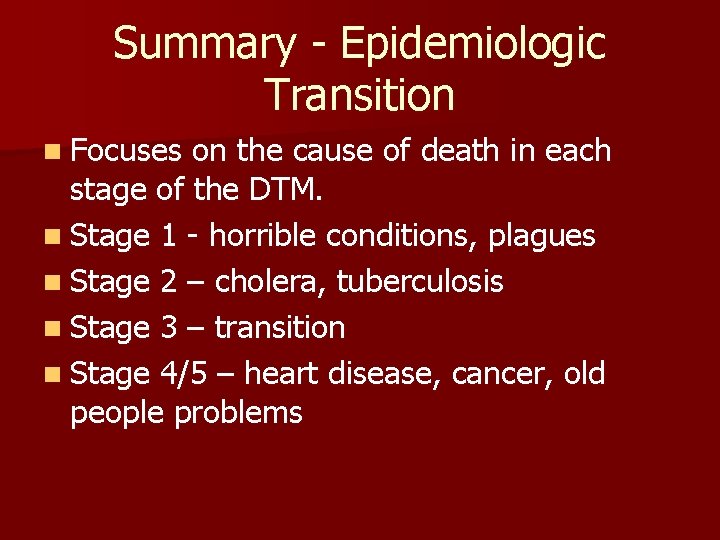
Summary - Epidemiologic Transition n Focuses on the cause of death in each stage of the DTM. n Stage 1 - horrible conditions, plagues n Stage 2 – cholera, tuberculosis n Stage 3 – transition n Stage 4/5 – heart disease, cancer, old people problems
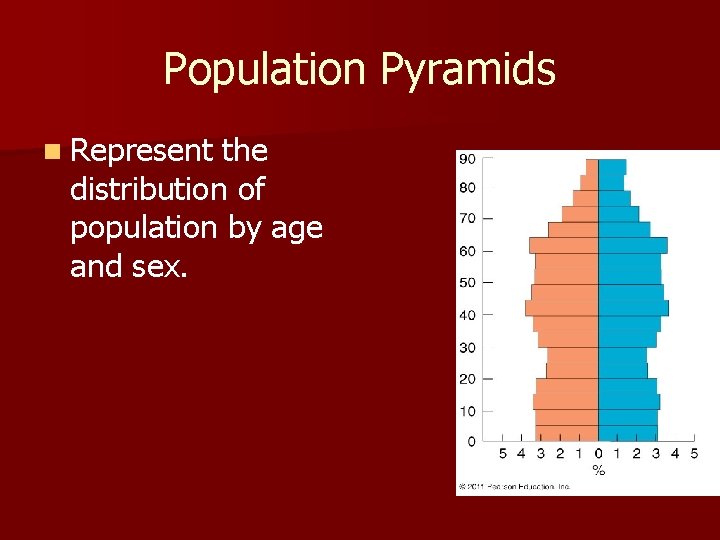
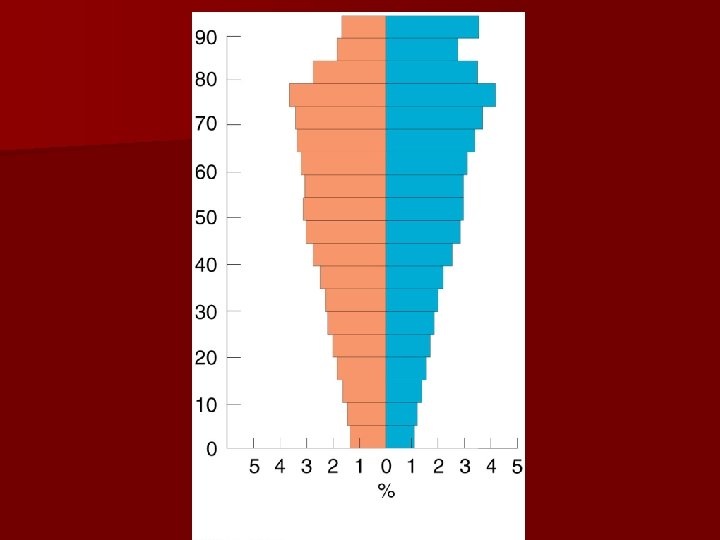
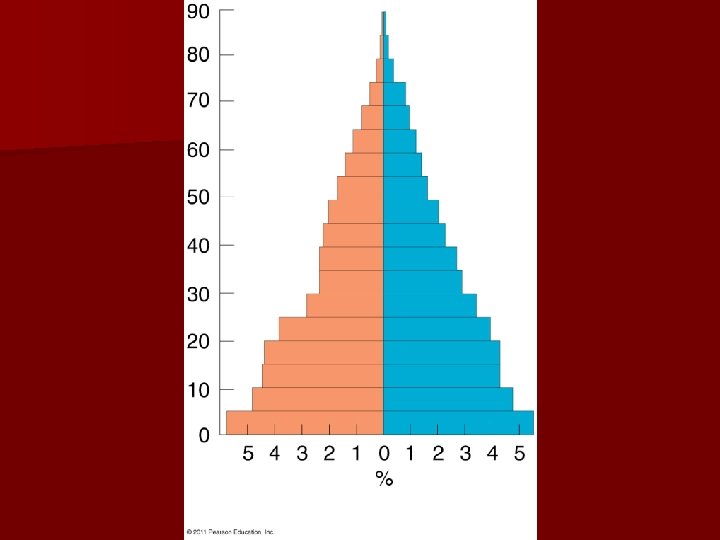
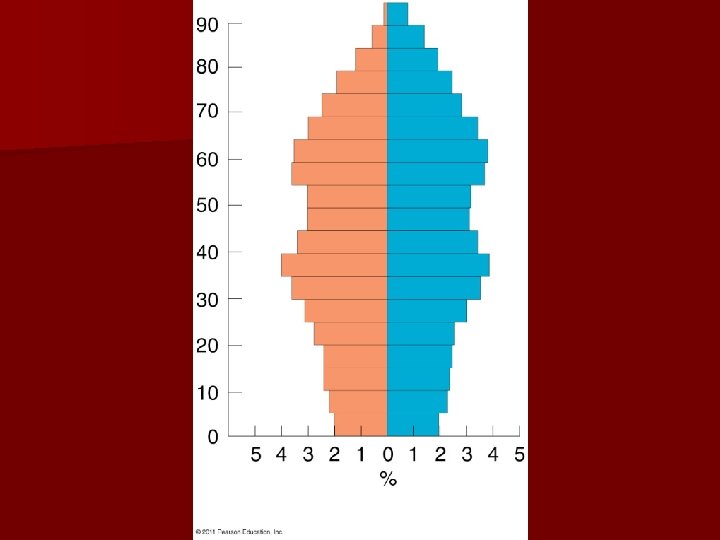
Population Pyramids n Represent the distribution of population by age and sex.
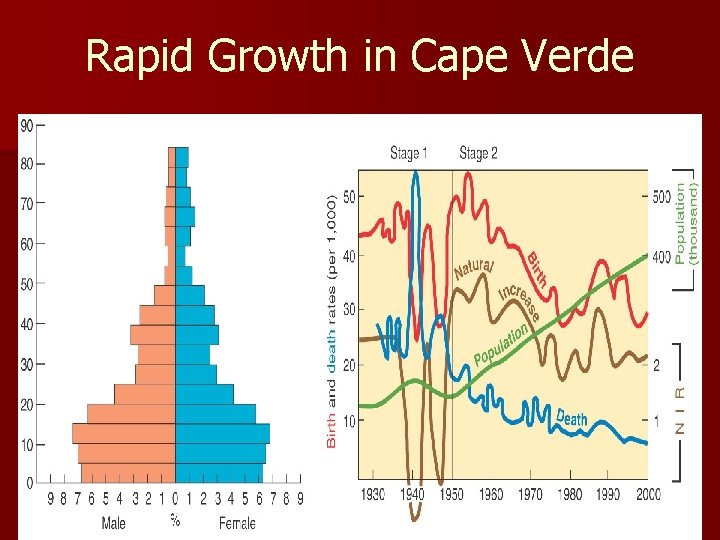
Rapid Growth in Cape Verde Fig. 2 -17: Cape Verde, which entered stage 2 of the demographic transition in about 1950, is experiencing rapid population growth. Its population history reflects the impacts of famines and out-migration.
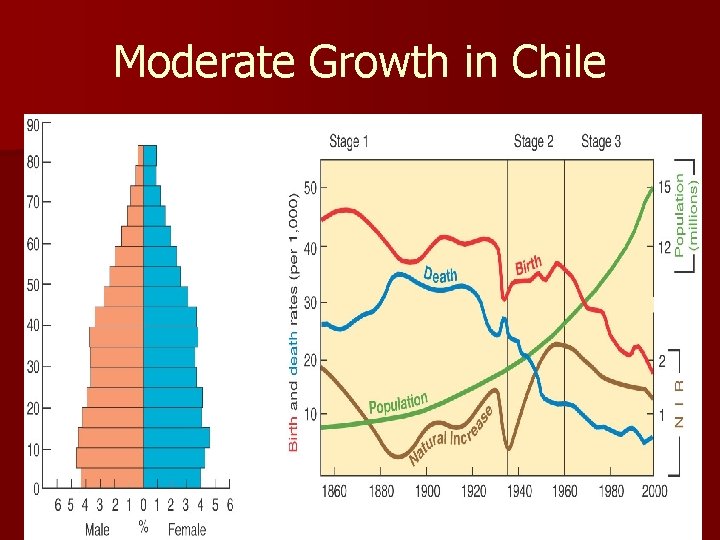
Moderate Growth in Chile Fig. 2 -18: Chile entered stage 2 of the demographic transition in the 1930 s, and it entered stage 3 in the 1960 s.
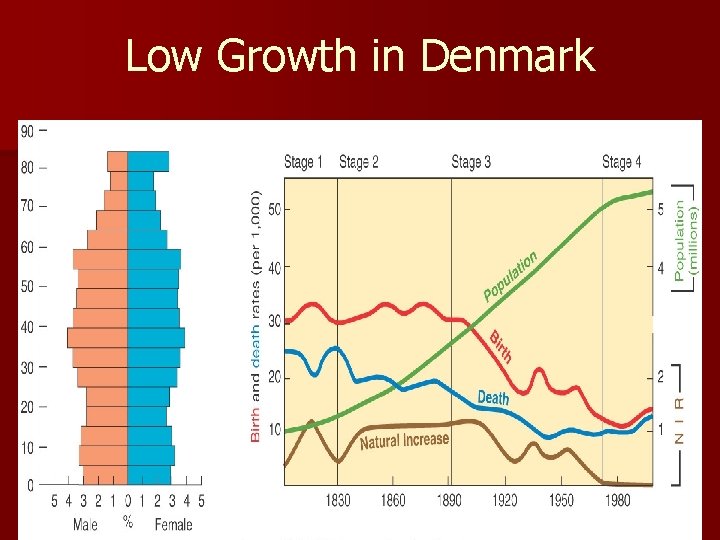
Low Growth in Denmark Fig. 2 -19: Denmark has been in stage 4 of the demographic transition since the 1970 s, with little population growth since then. Its population pyramid shows increasing numbers of elderly and few children.
Population Pyramids in U. S. Cities Fig. 2 -16: Population pyramids can vary greatly, with different fertility rates (Laredo vs. Honolulu), or among military bases (Unalaska), college towns (Lawrence), and retirement communities (Naples).
Name practical uses that one might have for a population pyramid?
JOTD n. What is the name for the ratio of pens with some boogie to members of society? n. De pen-dancy ratio
Group Questions Which country do you think you have and explain why? Each student will make their own prediction. Does the group agree with them? Why or why not? 2. Name five practical ways in which a population pyramid can be used? 1.
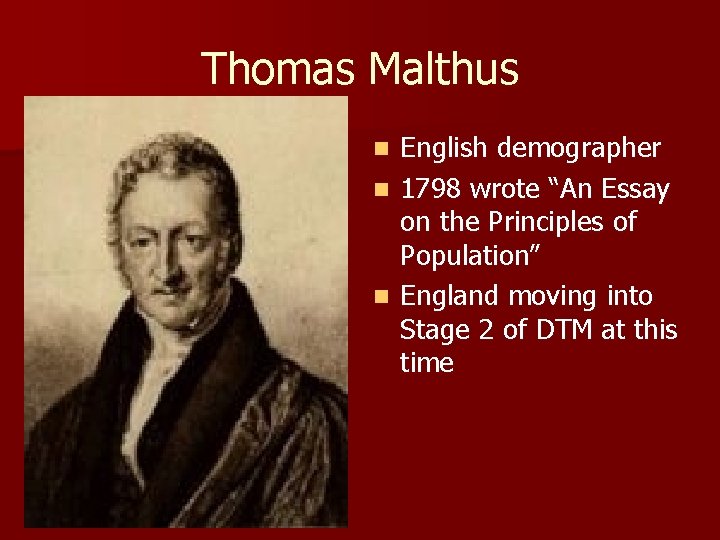
Thomas Malthus English demographer n 1798 wrote “An Essay on the Principles of Population” n England moving into Stage 2 of DTM at this time n
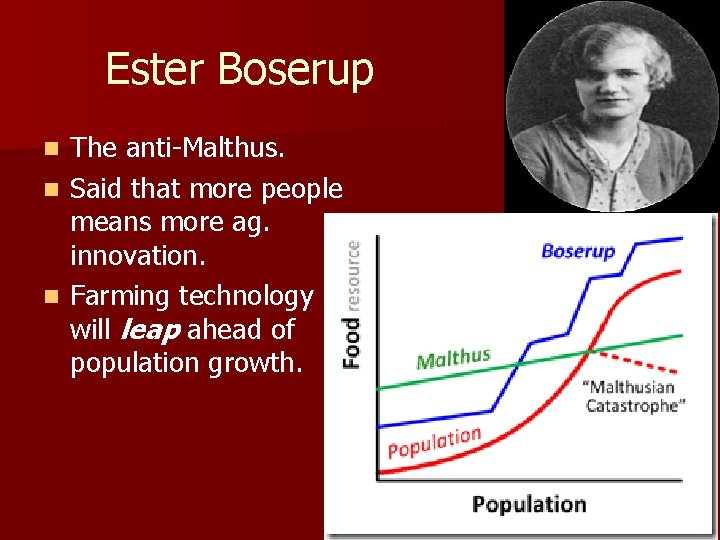
Malthus’s Prediction n Population grows geometrically n Ex: 1, 2, 4, 8, 16 etc. n Food production grows arithmetically n Ex: 1, 2, 3, 4, 5 etc. n Therefore, we are all going to starve! n Malthus supported late marriages and abstinence… but only for poor people.
Two viewpoints today…. n Neo-Malthusians – food production will run out. n Technocentrists – technology will keep pace with population growth.
Debate Scoring n Three – a zinger, solid logical statement supported by facts. n Two – a clean rebuttal or original comment that advanced the discussion. n One – a repeated, off-topic, or false statement.
Ester Boserup The anti-Malthus. n Said that more people means more ag. innovation. n Farming technology will leap ahead of population growth. n
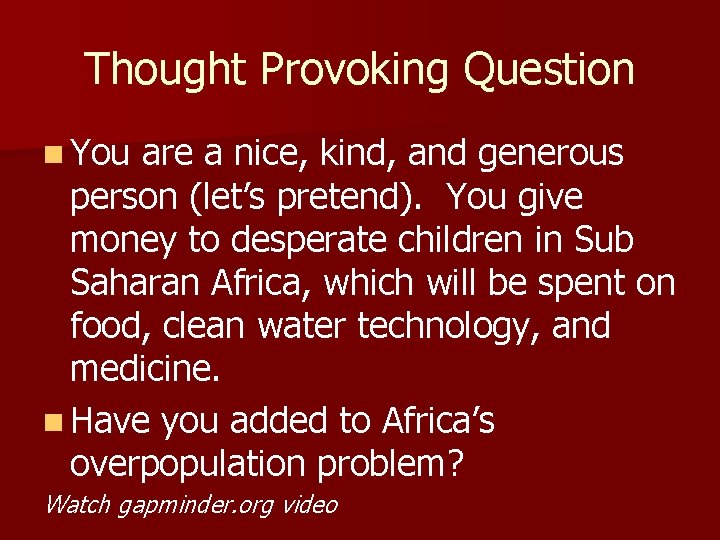
Thought Provoking Question n You are a nice, kind, and generous person (let’s pretend). You give money to desperate children in Sub Saharan Africa, which will be spent on food, clean water technology, and medicine. n Have you added to Africa’s overpopulation problem? Watch gapminder. org video
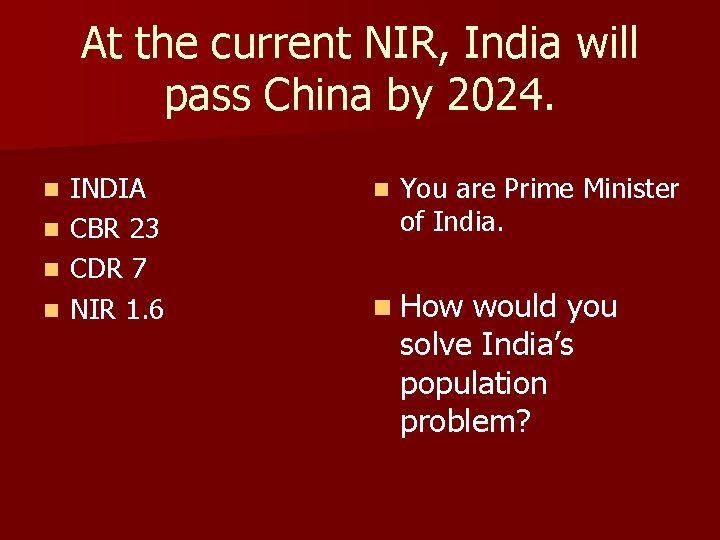
By 2024, India’s Population will surpass China’s …. at the present rate. Should India enforce a two child limit similar to China?
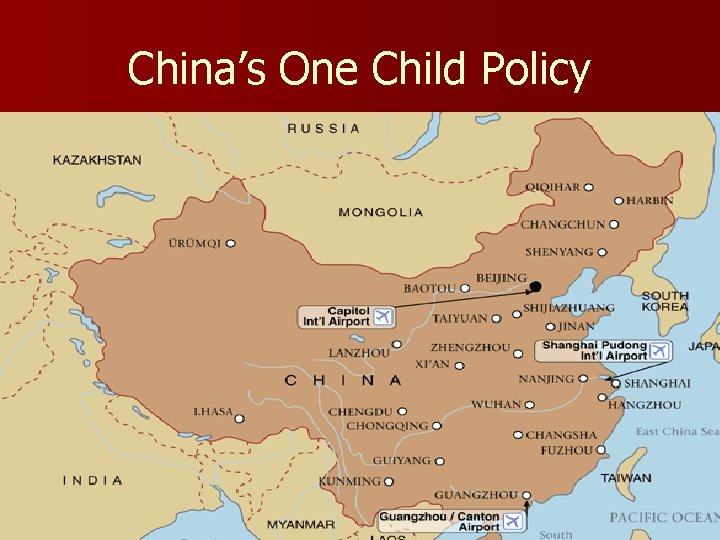
China’s One Child Policy
China’s History n High population seen as a good thing n Total population unknown to outside world, grossly underestimated n Mao Zedong dies in 1976. n 1978 – pop. reported to be one billion n New leaders want to limit population n Goal is ZPG.
One Child Policy n 1979 loosely enforced n 1982 birth control mandatory for women with one child - Sterilization after second child n Problem: rural farms need many hands to do the labor n Secret pregnancies and unregistered births, estimated 200 million in rural areas.
One and a Half Child Policy n Policy relaxed in 1984. n A couple whose first child is a girl may have a second child. n Also, a second is allowed if first has a disability.
Two Child Policy n 2015 – Limit changed to two n You pay extra if having more than two kids.
Results of OCP: Growth has slowed – estimated 300 million births prevented. - 1970 2. 4 NIR - 1985 1. 1 NIR 2. Abandonment of infant girls - infanticide, families want boy to carry on their name 1.
3. 4. 5. 6. Social Problems -many women sold into prostitution / marriage Advertising Campaigns - “A daughter is as good as a son. ” Increased Migration - wealthy men are importing wives ‘Little Emperor Syndrome’ – one child can be spoiled and not adapt to the workforce/society
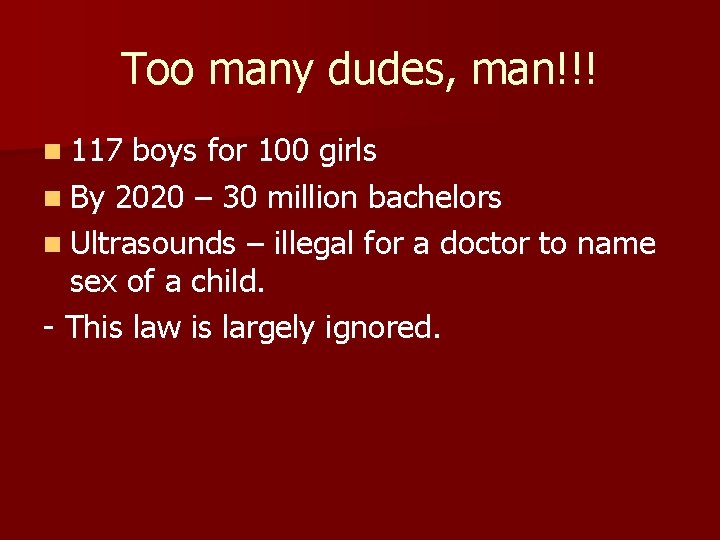
Too many dudes, man!!! n 117 boys for 100 girls n By 2020 – 30 million bachelors n Ultrasounds – illegal for a doctor to name sex of a child. - This law is largely ignored.
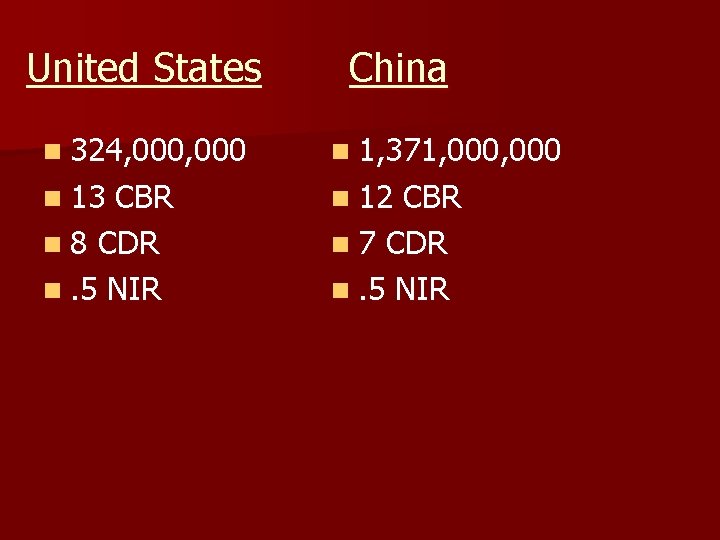
United States China n 324, 000 n 1, 371, 000 n 13 n 12 CBR n 8 CDR n. 5 NIR CBR n 7 CDR n. 5 NIR
At the current NIR, India will pass China by 2024. INDIA n CBR 23 n CDR 7 n NIR 1. 6 n n You are Prime Minister of India. n How would you solve India’s population problem?
Industrialization is the main reason that delevoped populations are under control, But there are other factors. . .
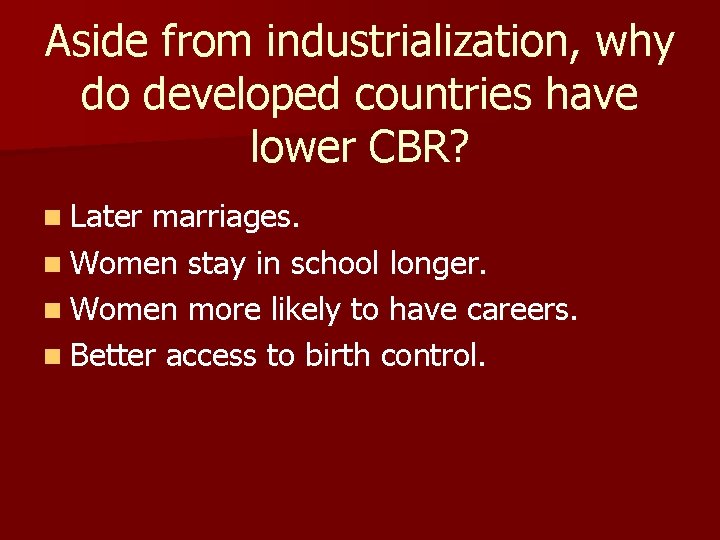
Aside from industrialization, why do developed countries have lower CBR? n Later marriages. n Women stay in school longer. n Women more likely to have careers. n Better access to birth control.