
Name GCSE Geography Revision notes This booklet contains

Name_________________ GCSE Geography Revision notes • This booklet contains revision notes for all 8 topics • 1. Global hazards (orange) • 2. Changing Climate (red) • 3. Distinctive landscapes (blue) • 4. Sustaining Ecosystems (green) • 5. Urban Futures (purple) • 6. Dynamic development (pink) • 7. UK in the 21 st Century (yellow) • 8. Resource Reliance (grey)
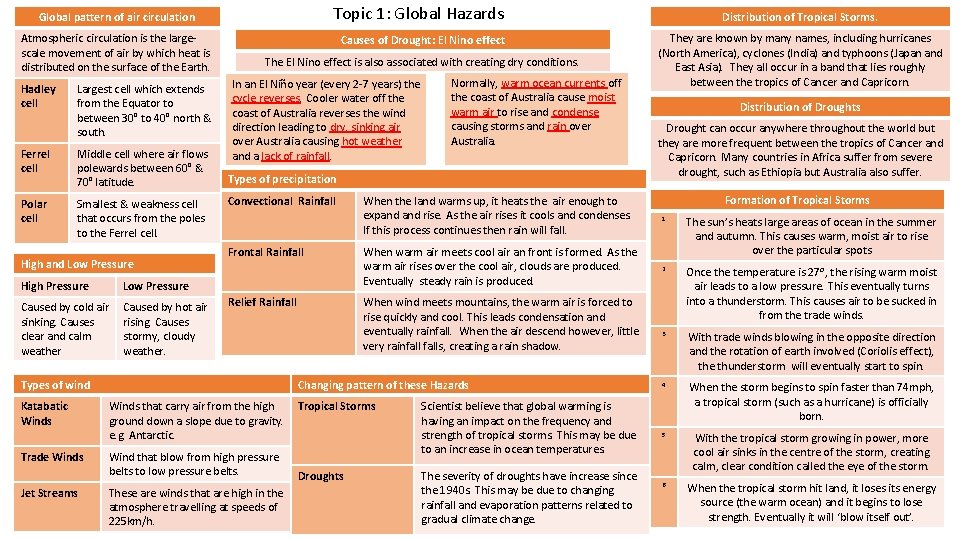
Topic 1: Global Hazards Global pattern of air circulation Atmospheric circulation is the largescale movement of air by which heat is distributed on the surface of the Earth. Hadley cell Largest cell which extends from the Equator to between 30° to 40° north & south. Ferrel cell Middle cell where air flows polewards between 60° & 70° latitude. Polar cell Smallest & weakness cell that occurs from the poles to the Ferrel cell. High and Low Pressure High Pressure Low Pressure Caused by cold air sinking. Causes clear and calm weather Caused by hot air rising. Causes stormy, cloudy weather. Causes of Drought: El Nino effect The El Nino effect is also associated with creating dry conditions. In an El Niño year (every 2 -7 years) the cycle reverses. Cooler water off the coast of Australia reverses the wind direction leading to dry, sinking air over Australia causing hot weather and a lack of rainfall. Types of precipitation Convectional Rainfall Frontal Rainfall Relief Rainfall Types of wind Katabatic Winds Trade Winds Jet Streams Normally, warm ocean currents off the coast of Australia cause moist warm air to rise and condense causing storms and rain over Australia. Wind that blow from high pressure belts to low pressure belts. These are winds that are high in the atmosphere travelling at speeds of 225 km/h. Distribution of Droughts Drought can occur anywhere throughout the world but they are more frequent between the tropics of Cancer and Capricorn. Many countries in Africa suffer from severe drought, such as Ethiopia but Australia also suffer. Formation of Tropical Storms 1 When warm air meets cool air an front is formed. As the warm air rises over the cool air, clouds are produced. Eventually steady rain is produced. The sun’s heats large areas of ocean in the summer and autumn. This causes warm, moist air to rise over the particular spots 2 Once the temperature is 27⁰, the rising warm moist air leads to a low pressure. This eventually turns into a thunderstorm. This causes air to be sucked in from the trade winds. 3 With trade winds blowing in the opposite direction and the rotation of earth involved (Coriolis effect), the thunderstorm will eventually start to spin. 4 When the storm begins to spin faster than 74 mph, a tropical storm (such as a hurricane) is officially born. 5 With the tropical storm growing in power, more cool air sinks in the centre of the storm, creating calm, clear condition called the eye of the storm. 6 When the tropical storm hit land, it loses its energy source (the warm ocean) and it begins to lose strength. Eventually it will ‘blow itself out’. When wind meets mountains, the warm air is forced to rise quickly and cool. This leads condensation and eventually rainfall. When the air descend however, little very rainfalls, creating a rain shadow. Tropical Storms Droughts They are known by many names, including hurricanes (North America), cyclones (India) and typhoons (Japan and East Asia). They all occur in a band that lies roughly between the tropics of Cancer and Capricorn. When the land warms up, it heats the air enough to expand rise. As the air rises it cools and condenses. If this process continues then rain will fall. Changing pattern of these Hazards Winds that carry air from the high ground down a slope due to gravity. e. g. Antarctic. Distribution of Tropical Storms. Scientist believe that global warming is having an impact on the frequency and strength of tropical storms. This may be due to an increase in ocean temperatures. The severity of droughts have increase since the 1940 s. This may be due to changing rainfall and evaporation patterns related to gradual climate change.
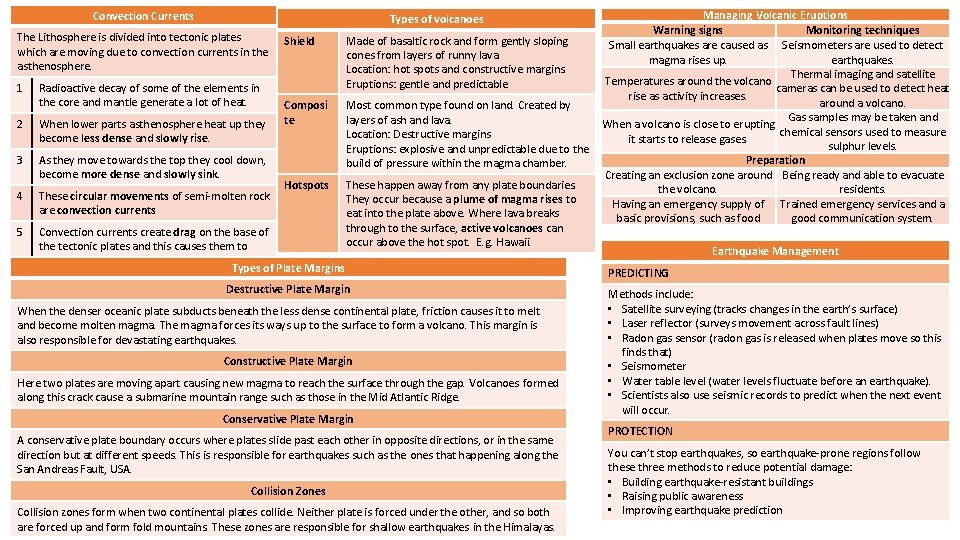
Convection Currents Types of volcanoes The Lithosphere is divided into tectonic plates which are moving due to convection currents in the asthenosphere. 1 Radioactive decay of some of the elements in the core and mantle generate a lot of heat. Shield Made of basaltic rock and form gently sloping cones from layers of runny lava. Location: hot spots and constructive margins. Eruptions: gentle and predictable Composi te Most common type found on land. Created by layers of ash and lava. Location: Destructive margins Eruptions: explosive and unpredictable due to the build of pressure within the magma chamber. Hotspots These happen away from any plate boundaries. They occur because a plume of magma rises to eat into the plate above. Where lava breaks through to the surface, active volcanoes can occur above the hot spot. E. g. Hawaii. 2 When lower parts asthenosphere heat up they become less dense and slowly rise. 3 As they move towards the top they cool down, become more dense and slowly sink. 4 These circular movements of semi-molten rock are convection currents 5 Convection currents create drag on the base of the tectonic plates and this causes them to move. Types of Plate Margins Destructive Plate Margin When the denser oceanic plate subducts beneath the less dense continental plate, friction causes it to melt and become molten magma. The magma forces its ways up to the surface to form a volcano. This margin is also responsible for devastating earthquakes. Constructive Plate Margin Here two plates are moving apart causing new magma to reach the surface through the gap. Volcanoes formed along this crack cause a submarine mountain range such as those in the Mid Atlantic Ridge. Conservative Plate Margin A conservative plate boundary occurs where plates slide past each other in opposite directions, or in the same direction but at different speeds. This is responsible for earthquakes such as the ones that happening along the San Andreas Fault, USA. Collision Zones Collision zones form when two continental plates collide. Neither plate is forced under the other, and so both are forced up and form fold mountains. These zones are responsible for shallow earthquakes in the Himalayas. Managing Volcanic Eruptions Warning signs Monitoring techniques Small earthquakes are caused as Seismometers are used to detect magma rises up. earthquakes. Thermal imaging and satellite Temperatures around the volcano cameras can be used to detect heat rise as activity increases. around a volcano. Gas samples may be taken and When a volcano is close to erupting chemical sensors used to measure it starts to release gases. sulphur levels. Preparation Creating an exclusion zone around Being ready and able to evacuate the volcano. residents. Having an emergency supply of Trained emergency services and a basic provisions, such as food good communication system. Earthquake Management PREDICTING Methods include: • Satellite surveying (tracks changes in the earth’s surface) • Laser reflector (surveys movement across fault lines) • Radon gas sensor (radon gas is released when plates move so this finds that) • Seismometer • Water table level (water levels fluctuate before an earthquake). • Scientists also use seismic records to predict when the next event will occur. PROTECTION You can’t stop earthquakes, so earthquake-prone regions follow these three methods to reduce potential damage: • Building earthquake-resistant buildings • Raising public awareness • Improving earthquake prediction
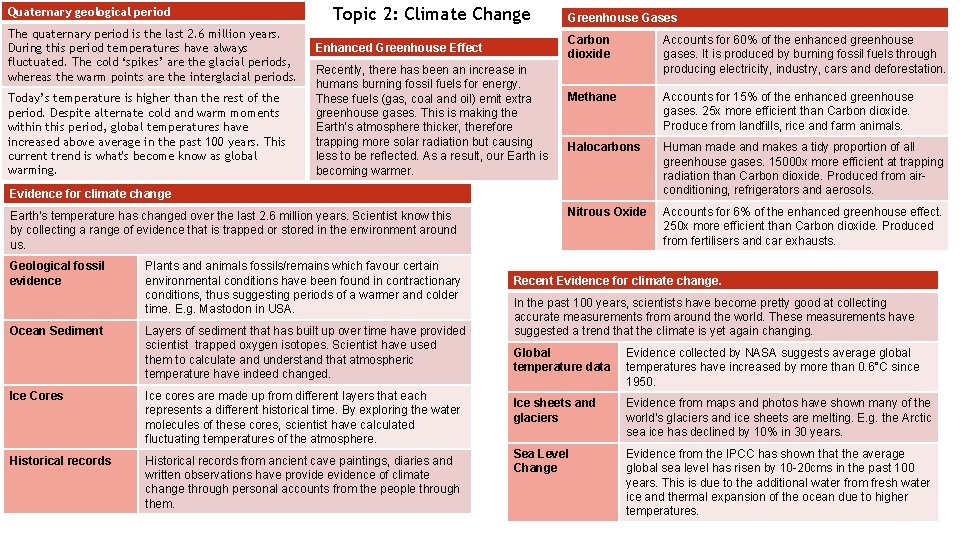
Quaternary geological period The quaternary period is the last 2. 6 million years. During this period temperatures have always fluctuated. The cold ‘spikes’ are the glacial periods, whereas the warm points are the interglacial periods. Today’s temperature is higher than the rest of the period. Despite alternate cold and warm moments within this period, global temperatures have increased above average in the past 100 years. This current trend is what's become know as global warming. Topic 2: Climate Change Enhanced Greenhouse Effect Recently, there has been an increase in humans burning fossil fuels for energy. These fuels (gas, coal and oil) emit extra greenhouse gases. This is making the Earth’s atmosphere thicker, therefore trapping more solar radiation but causing less to be reflected. As a result, our Earth is becoming warmer. Greenhouse Gases Carbon dioxide Accounts for 60% of the enhanced greenhouse gases. It is produced by burning fossil fuels through producing electricity, industry, cars and deforestation. Methane Accounts for 15% of the enhanced greenhouse gases. 25 x more efficient than Carbon dioxide. Produce from landfills, rice and farm animals. Halocarbons Human made and makes a tidy proportion of all greenhouse gases. 15000 x more efficient at trapping radiation than Carbon dioxide. Produced from airconditioning, refrigerators and aerosols. Nitrous Oxide Accounts for 6% of the enhanced greenhouse effect. 250 x more efficient than Carbon dioxide. Produced from fertilisers and car exhausts. Evidence for climate change Earth’s temperature has changed over the last 2. 6 million years. Scientist know this by collecting a range of evidence that is trapped or stored in the environment around us. Geological fossil evidence Ocean Sediment Plants and animals fossils/remains which favour certain environmental conditions have been found in contractionary conditions, thus suggesting periods of a warmer and colder time. E. g. Mastodon in USA. Layers of sediment that has built up over time have provided scientist trapped oxygen isotopes. Scientist have used them to calculate and understand that atmospheric temperature have indeed changed. Ice Cores Ice cores are made up from different layers that each represents a different historical time. By exploring the water molecules of these cores, scientist have calculated fluctuating temperatures of the atmosphere. Historical records from ancient cave paintings, diaries and written observations have provide evidence of climate change through personal accounts from the people through them. Recent Evidence for climate change. In the past 100 years, scientists have become pretty good at collecting accurate measurements from around the world. These measurements have suggested a trend that the climate is yet again changing. Global temperature data Evidence collected by NASA suggests average global temperatures have increased by more than 0. 6°C since 1950. Ice sheets and glaciers Evidence from maps and photos have shown many of the world’s glaciers and ice sheets are melting. E. g. the Arctic sea ice has declined by 10% in 30 years. Sea Level Change Evidence from the IPCC has shown that the average global sea level has risen by 10 -20 cms in the past 100 years. This is due to the additional water from fresh water ice and thermal expansion of the ocean due to higher temperatures.
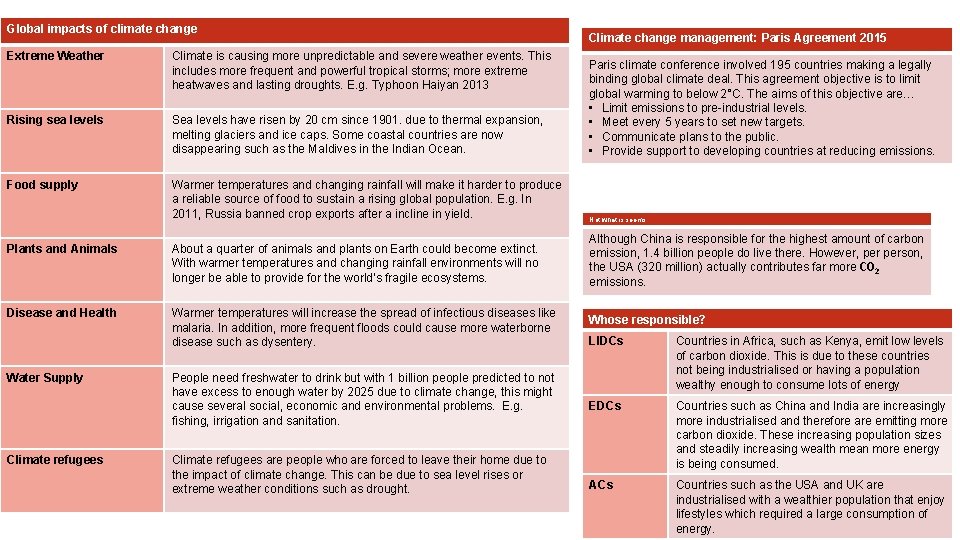
Global impacts of climate change Extreme Weather Climate is causing more unpredictable and severe weather events. This includes more frequent and powerful tropical storms; more extreme heatwaves and lasting droughts. E. g. Typhoon Haiyan 2013 Rising sea levels Sea levels have risen by 20 cm since 1901. due to thermal expansion, melting glaciers and ice caps. Some coastal countries are now disappearing such as the Maldives in the Indian Ocean. Food supply Warmer temperatures and changing rainfall will make it harder to produce a reliable source of food to sustain a rising global population. E. g. In 2011, Russia banned crop exports after a incline in yield. Plants and Animals About a quarter of animals and plants on Earth could become extinct. With warmer temperatures and changing rainfall environments will no longer be able to provide for the world’s fragile ecosystems. Disease and Health Warmer temperatures will increase the spread of infectious diseases like malaria. In addition, more frequent floods could cause more waterborne disease such as dysentery. Water Supply Climate refugees People need freshwater to drink but with 1 billion people predicted to not have excess to enough water by 2025 due to climate change, this might cause several social, economic and environmental problems. E. g. fishing, irrigation and sanitation. Climate refugees are people who are forced to leave their home due to the impact of climate change. This can be due to sea level rises or extreme weather conditions such as drought. Climate change management: Paris Agreement 2015 Paris climate conference involved 195 countries making a legally binding global climate deal. This agreement objective is to limit global warming to below 2°C. The aims of this objective are… • Limit emissions to pre-industrial levels. • Meet every 5 years to set new targets. • Communicate plans to the public. • Provide support to developing countries at reducing emissions. Not what is seems Although China is responsible for the highest amount of carbon emission, 1. 4 billion people do live there. However, person, the USA (320 million) actually contributes far more CO 2 emissions. Whose responsible? LIDCs Countries in Africa, such as Kenya, emit low levels of carbon dioxide. This is due to these countries not being industrialised or having a population wealthy enough to consume lots of energy EDCs Countries such as China and India are increasingly more industrialised and therefore are emitting more carbon dioxide. These increasing population sizes and steadily increasing wealth mean more energy is being consumed. ACs Countries such as the USA and UK are industrialised with a wealthier population that enjoy lifestyles which required a large consumption of energy.
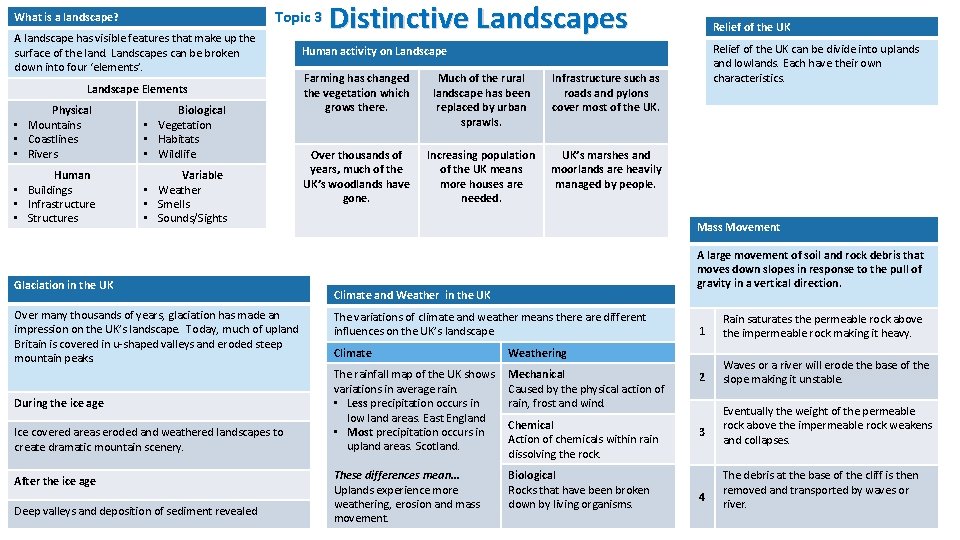
Topic 3 What is a landscape? A landscape has visible features that make up the surface of the land. Landscapes can be broken down into four ‘elements’. Landscape Elements Physical • Mountains • Coastlines • Rivers Biological • Vegetation • Habitats • Wildlife Human • Buildings • Infrastructure • Structures Variable • Weather • Smells • Sounds/Sights Glaciation in the UK Over many thousands of years, glaciation has made an impression on the UK’s landscape. Today, much of upland Britain is covered in u-shaped valleys and eroded steep mountain peaks. During the ice age Ice covered areas eroded and weathered landscapes to create dramatic mountain scenery. After the ice age Deep valleys and deposition of sediment revealed Distinctive Landscapes Relief of the UK can be divide into uplands and lowlands. Each have their own characteristics. Human activity on Landscape Farming has changed the vegetation which grows there. Much of the rural landscape has been replaced by urban sprawls. Infrastructure such as roads and pylons cover most of the UK. Over thousands of years, much of the UK’s woodlands have gone. Increasing population of the UK means more houses are needed. UK’s marshes and moorlands are heavily managed by people. Mass Movement A large movement of soil and rock debris that moves down slopes in response to the pull of gravity in a vertical direction. Climate and Weather in the UK The variations of climate and weather means there are different influences on the UK’s landscape. Climate Weathering The rainfall map of the UK shows variations in average rain. • Less precipitation occurs in low land areas. East England • Most precipitation occurs in upland areas. Scotland. Mechanical Caused by the physical action of rain, frost and wind. These differences mean… Uplands experience more weathering, erosion and mass movement. Biological Rocks that have been broken down by living organisms. Chemical Action of chemicals within rain dissolving the rock. 1 Rain saturates the permeable rock above the impermeable rock making it heavy. 2 Waves or a river will erode the base of the slope making it unstable. 3 4 Eventually the weight of the permeable rock above the impermeable rock weakens and collapses. The debris at the base of the cliff is then removed and transported by waves or river.
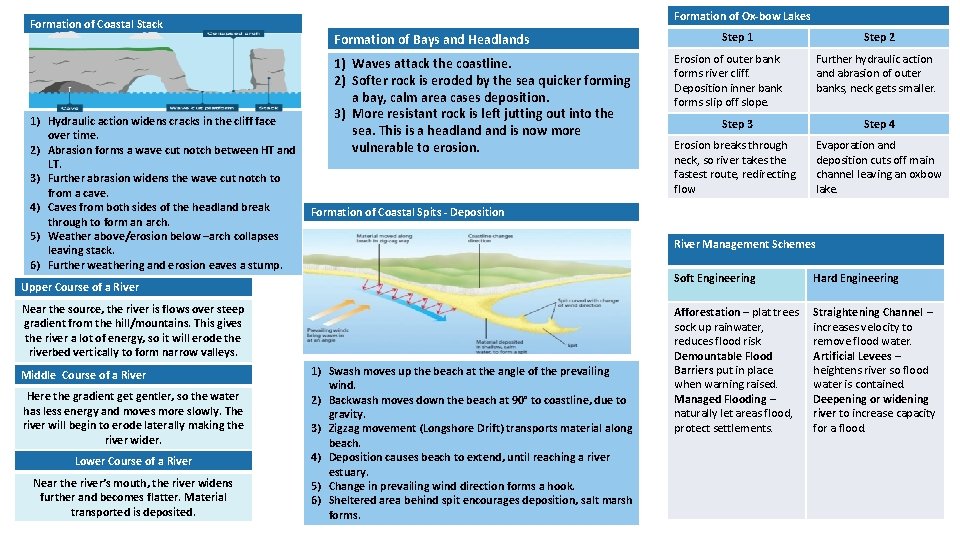
Formation of Coastal Stack 1) Hydraulic action widens cracks in the cliff face over time. 2) Abrasion forms a wave cut notch between HT and LT. 3) Further abrasion widens the wave cut notch to from a cave. 4) Caves from both sides of the headland break through to form an arch. 5) Weather above/erosion below –arch collapses leaving stack. 6) Further weathering and erosion eaves a stump. Formation of Ox-bow Lakes Formation of Bays and Headlands 1) Waves attack the coastline. 2) Softer rock is eroded by the sea quicker forming a bay, calm area cases deposition. 3) More resistant rock is left jutting out into the sea. This is a headland is now more vulnerable to erosion. Lower Course of a River Near the river’s mouth, the river widens further and becomes flatter. Material transported is deposited. Further hydraulic action and abrasion of outer banks, neck gets smaller. Step 3 Step 4 Erosion breaks through neck, so river takes the fastest route, redirecting flow Evaporation and deposition cuts off main channel leaving an oxbow lake. River Management Schemes Near the source, the river is flows over steep gradient from the hill/mountains. This gives the river a lot of energy, so it will erode the riverbed vertically to form narrow valleys. Here the gradient gentler, so the water has less energy and moves more slowly. The river will begin to erode laterally making the river wider. Erosion of outer bank forms river cliff. Deposition inner bank forms slip off slope. Step 2 Formation of Coastal Spits - Deposition Upper Course of a River Middle Course of a River Step 1 1) Swash moves up the beach at the angle of the prevailing wind. 2) Backwash moves down the beach at 90° to coastline, due to gravity. 3) Zigzag movement (Longshore Drift) transports material along beach. 4) Deposition causes beach to extend, until reaching a river estuary. 5) Change in prevailing wind direction forms a hook. 6) Sheltered area behind spit encourages deposition, salt marsh forms. Soft Engineering Hard Engineering Afforestation – plat trees sock up rainwater, reduces flood risk. Demountable Flood Barriers put in place when warning raised. Managed Flooding – naturally let areas flood, protect settlements. Straightening Channel – increases velocity to remove flood water. Artificial Levees – heightens river so flood water is contained. Deepening or widening river to increase capacity for a flood.
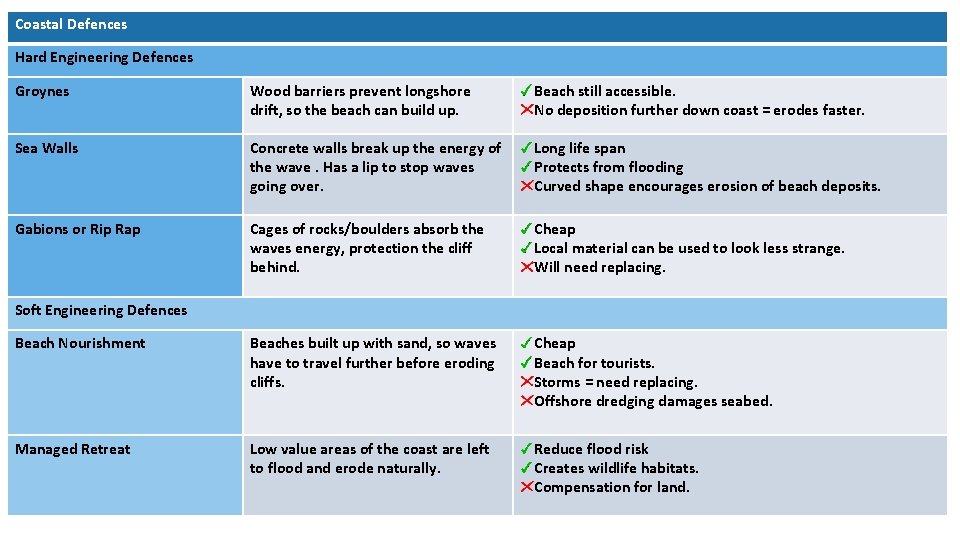
Coastal Defences Hard Engineering Defences Groynes Wood barriers prevent longshore drift, so the beach can build up. Beach still accessible. No deposition further down coast = erodes faster. Sea Walls Concrete walls break up the energy of the wave. Has a lip to stop waves going over. Long life span Protects from flooding Curved shape encourages erosion of beach deposits. Gabions or Rip Rap Cages of rocks/boulders absorb the waves energy, protection the cliff behind. Cheap Local material can be used to look less strange. Will need replacing. Beach Nourishment Beaches built up with sand, so waves have to travel further before eroding cliffs. Cheap Beach for tourists. Storms = need replacing. Offshore dredging damages seabed. Managed Retreat Low value areas of the coast are left to flood and erode naturally. Reduce flood risk Creates wildlife habitats. Compensation for land. Soft Engineering Defences
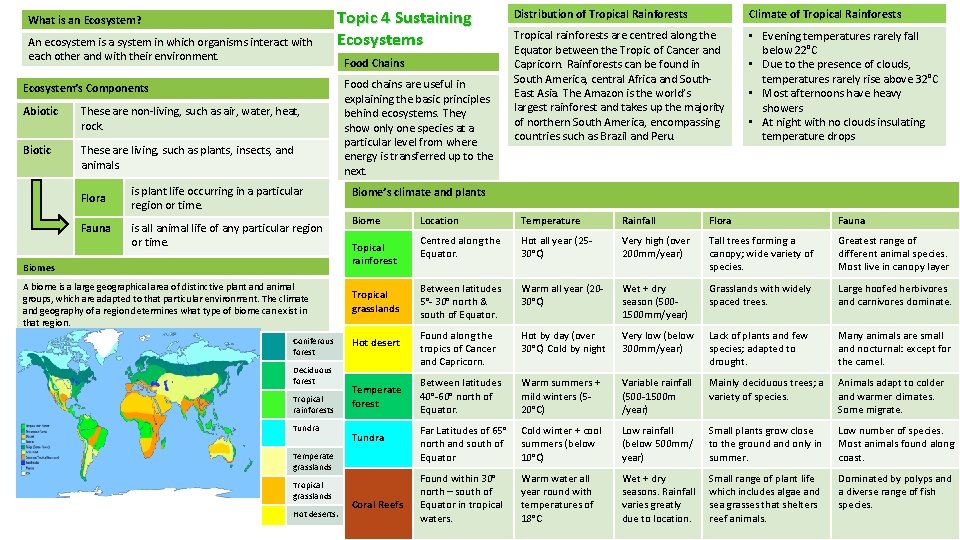
What is an Ecosystem? An ecosystem is a system in which organisms interact with each other and with their environment. Topic 4 Sustaining Ecosystems Ecosystem’s Components Abiotic These are non-living, such as air, water, heat, rock. Biotic These are living, such as plants, insects, and animals. Flora Fauna is plant life occurring in a particular region or time. is all animal life of any particular region or time. Biomes A biome is a large geographical area of distinctive plant and animal groups, which are adapted to that particular environment. The climate and geography of a region determines what type of biome can exist in that region. Coniferous forest Deciduous forest Tropical rainforests Tundra Food Chains Food chains are useful in explaining the basic principles behind ecosystems. They show only one species at a particular level from where energy is transferred up to the next. Hot deserts. Climate of Tropical Rainforests Tropical rainforests are centred along the Equator between the Tropic of Cancer and Capricorn. Rainforests can be found in South America, central Africa and South. East Asia. The Amazon is the world’s largest rainforest and takes up the majority of northern South America, encompassing countries such as Brazil and Peru. • Evening temperatures rarely fall below 22°C • Due to the presence of clouds, temperatures rarely rise above 32°C • Most afternoons have heavy showers • At night with no clouds insulating temperature drops Biome’s climate and plants Biome Topical rainforest Tropical grasslands Hot desert Temperate forest Tundra Temperate grasslands Tropical grasslands Distribution of Tropical Rainforests Coral Reefs Location Temperature Rainfall Flora Fauna Centred along the Equator. Hot all year (2530°C) Very high (over 200 mm/year) Tall trees forming a canopy; wide variety of species. Greatest range of different animal species. Most live in canopy layer Between latitudes 5°- 30° north & south of Equator. Warm all year (2030°C) Wet + dry season (5001500 mm/year) Grasslands with widely spaced trees. Large hoofed herbivores and carnivores dominate. Found along the tropics of Cancer and Capricorn. Hot by day (over 30°C) Cold by night Very low (below 300 mm/year) Lack of plants and few species; adapted to drought. Many animals are small and nocturnal: except for the camel. Between latitudes 40°-60° north of Equator. Warm summers + mild winters (520°C) Variable rainfall (500 -1500 m /year) Mainly deciduous trees; a variety of species. Animals adapt to colder and warmer climates. Some migrate. Far Latitudes of 65° north and south of Equator Cold winter + cool summers (below 10°C) Low rainfall (below 500 mm/ year) Small plants grow close to the ground and only in summer. Low number of species. Most animals found along coast. Found within 30° north – south of Equator in tropical waters. Warm water all year round with temperatures of 18°C Wet + dry seasons. Rainfall varies greatly due to location. Small range of plant life which includes algae and sea grasses that shelters reef animals. Dominated by polyps and a diverse range of fish species.
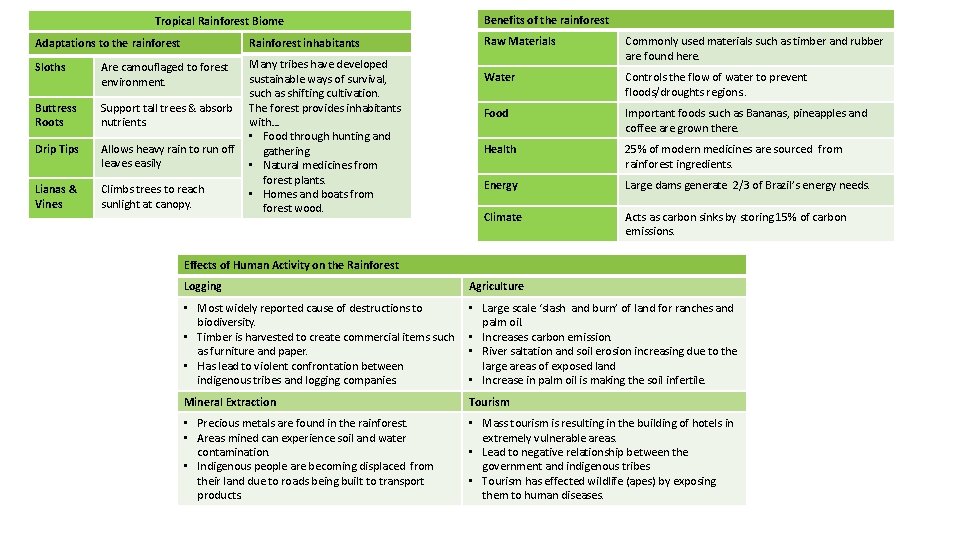
Tropical Rainforest Biome Adaptations to the rainforest Rainforest inhabitants Sloths Are camouflaged to forest environment. Buttress Roots Support tall trees & absorb nutrients. Drip Tips Allows heavy rain to run off leaves easily Lianas & Vines Climbs trees to reach sunlight at canopy. Many tribes have developed sustainable ways of survival, such as shifting cultivation. The forest provides inhabitants with… • Food through hunting and gathering. • Natural medicines from forest plants. • Homes and boats from forest wood. Benefits of the rainforest Raw Materials Commonly used materials such as timber and rubber are found here. Water Controls the flow of water to prevent floods/droughts regions. . Food Important foods such as Bananas, pineapples and coffee are grown there. Health 25% of modern medicines are sourced from rainforest ingredients. Energy Large dams generate 2/3 of Brazil’s energy needs. Climate Acts as carbon sinks by storing 15% of carbon emissions. Effects of Human Activity on the Rainforest Logging Agriculture • Most widely reported cause of destructions to biodiversity. • Timber is harvested to create commercial items such as furniture and paper. • Has lead to violent confrontation between indigenous tribes and logging companies. • Large scale ‘slash and burn’ of land for ranches and palm oil. • Increases carbon emission. • River saltation and soil erosion increasing due to the large areas of exposed land • Increase in palm oil is making the soil infertile. Mineral Extraction Tourism • Precious metals are found in the rainforest. • Areas mined can experience soil and water contamination. • Indigenous people are becoming displaced from their land due to roads being built to transport products. • Mass tourism is resulting in the building of hotels in extremely vulnerable areas. • Lead to negative relationship between the government and indigenous tribes • Tourism has effected wildlife (apes) by exposing them to human diseases.
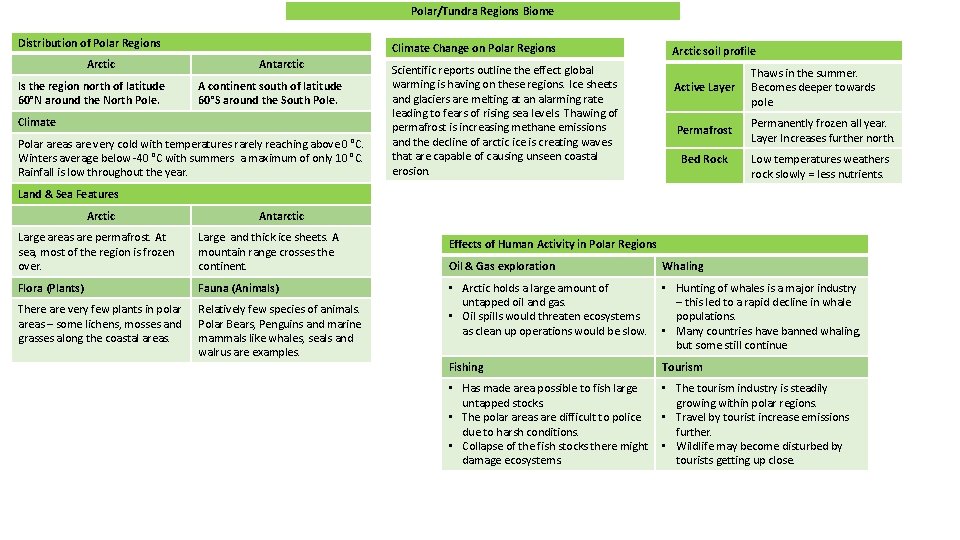
Polar/Tundra Regions Biome Distribution of Polar Regions Arctic Is the region north of latitude 60°N around the North Pole. Climate Change on Polar Regions Antarctic A continent south of latitude 60°S around the South Pole. Climate Polar areas are very cold with temperatures rarely reaching above 0 °C. Winters average below -40 °C with summers a maximum of only 10 °C. Rainfall is low throughout the year. Scientific reports outline the effect global warming is having on these regions. Ice sheets and glaciers are melting at an alarming rate leading to fears of rising sea levels. Thawing of permafrost is increasing methane emissions and the decline of arctic ice is creating waves that are capable of causing unseen coastal erosion. Arctic soil profile Active Layer Thaws in the summer. Becomes deeper towards pole. Permafrost Permanently frozen all year. Layer Increases further north. Bed Rock Low temperatures weathers rock slowly = less nutrients. Land & Sea Features Arctic Antarctic Large areas are permafrost. At sea, most of the region is frozen over. Large and thick ice sheets. A mountain range crosses the continent. Flora (Plants) Fauna (Animals) There are very few plants in polar areas – some lichens, mosses and grasses along the coastal areas. Relatively few species of animals. Polar Bears, Penguins and marine mammals like whales, seals and walrus are examples. Effects of Human Activity in Polar Regions Oil & Gas exploration Whaling • Arctic holds a large amount of untapped oil and gas. • Oil spills would threaten ecosystems as clean up operations would be slow. • Hunting of whales is a major industry – this led to a rapid decline in whale populations. • Many countries have banned whaling, but some still continue Fishing Tourism • Has made area possible to fish large untapped stocks. • The polar areas are difficult to police due to harsh conditions. • Collapse of the fish stocks there might damage ecosystems. • The tourism industry is steadily growing within polar regions. • Travel by tourist increase emissions further. • Wildlife may become disturbed by tourists getting up close.
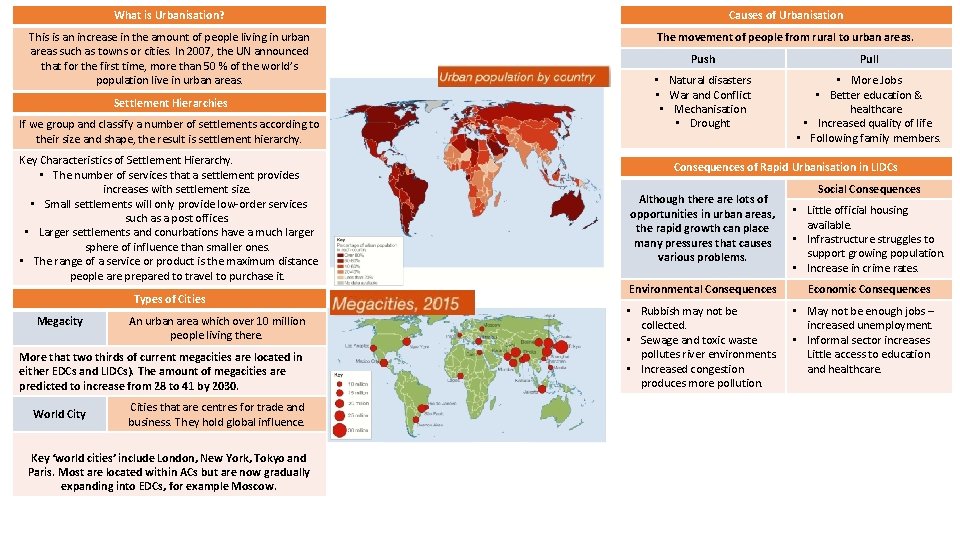
What is Urbanisation? Causes of Urbanisation This is an increase in the amount of people living in urban areas such as towns or cities. In 2007, the UN announced that for the first time, more than 50 % of the world’s population live in urban areas. The movement of people from rural to urban areas. Settlement Hierarchies If we group and classify a number of settlements according to their size and shape, the result is settlement hierarchy. Key Characteristics of Settlement Hierarchy. • The number of services that a settlement provides increases with settlement size. • Small settlements will only provide low-order services such as a post offices. • Larger settlements and conurbations have a much larger sphere of influence than smaller ones. • The range of a service or product is the maximum distance people are prepared to travel to purchase it. Types of Cities Megacity An urban area which over 10 million people living there. More that two thirds of current megacities are located in either EDCs and LIDCs). The amount of megacities are predicted to increase from 28 to 41 by 2030. World City Cities that are centres for trade and business. They hold global influence. Key ‘world cities’ include London, New York, Tokyo and Paris. Most are located within ACs but are now gradually expanding into EDCs, for example Moscow. Push Pull • Natural disasters • War and Conflict • Mechanisation • Drought • More Jobs • Better education & healthcare • Increased quality of life. • Following family members. Consequences of Rapid Urbanisation in LIDCs Although there are lots of opportunities in urban areas, the rapid growth can place many pressures that causes various problems. Environmental Consequences • Rubbish may not be collected. • Sewage and toxic waste pollutes river environments. • Increased congestion produces more pollution. Social Consequences • Little official housing available. • Infrastructure struggles to support growing population. • Increase in crime rates. Economic Consequences • May not be enough jobs – increased unemployment. • Informal sector increases Little access to education and healthcare.
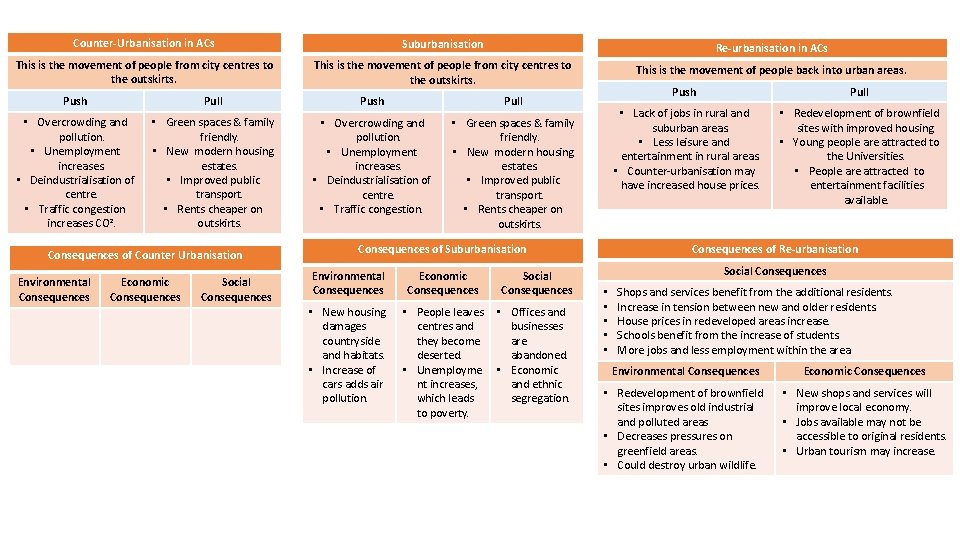
Counter-Urbanisation in ACs Suburbanisation Re-urbanisation in ACs This is the movement of people from city centres to the outskirts. This is the movement of people back into urban areas. Push Pull • Overcrowding and pollution. • Unemployment increases. • Deindustrialisation of centre. • Traffic congestion increases CO². • Green spaces & family friendly. • New modern housing estates. • Improved public transport. • Rents cheaper on outskirts. • Overcrowding and pollution. • Unemployment increases. • Deindustrialisation of centre. • Traffic congestion. • Green spaces & family friendly. • New modern housing estates. • Improved public transport. • Rents cheaper on outskirts. Consequences of Counter Urbanisation Environmental Consequences Economic Consequences Social Consequences of Suburbanisation Environmental Consequences Economic Consequences Social Consequences • New housing damages countryside and habitats. • Increase of cars adds air pollution. • People leaves centres and they become deserted. • Unemployme nt increases, which leads to poverty. • Offices and businesses are abandoned. • Economic and ethnic segregation. Push Pull • Lack of jobs in rural and suburban areas. • Less leisure and entertainment in rural areas. • Counter-urbanisation may have increased house prices. • Redevelopment of brownfield sites with improved housing. • Young people are attracted to the Universities. • People are attracted to entertainment facilities available. Consequences of Re-urbanisation Social Consequences • • • Shops and services benefit from the additional residents. Increase in tension between new and older residents. House prices in redeveloped areas increase. Schools benefit from the increase of students. More jobs and less employment within the area. Environmental Consequences Economic Consequences • Redevelopment of brownfield sites improves old industrial and polluted areas • Decreases pressures on greenfield areas. • Could destroy urban wildlife. • New shops and services will improve local economy. • Jobs available may not be accessible to original residents. • Urban tourism may increase.
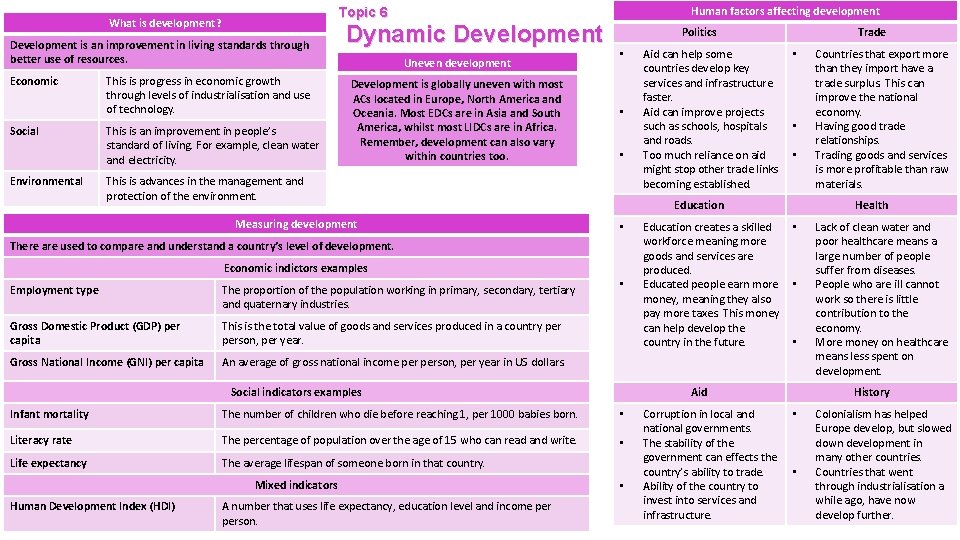
Development is an improvement in living standards through better use of resources. Economic Social Environmental Human factors affecting development Topic 6 What is development? This is progress in economic growth through levels of industrialisation and use of technology. This is an improvement in people’s standard of living. For example, clean water and electricity. Dynamic Development Uneven development Development is globally uneven with most ACs located in Europe, North America and Oceania. Most EDCs are in Asia and South America, whilst most LIDCs are in Africa. Remember, development can also vary within countries too. Politics • • • This is advances in the management and protection of the environment. Measuring development • Economic indictors examples The proportion of the population working in primary, secondary, tertiary and quaternary industries. Gross Domestic Product (GDP) per capita This is the total value of goods and services produced in a country person, per year. Gross National Income (GNI) per capita An average of gross national income person, per year in US dollars. • Social indicators examples The number of children who die before reaching 1, per 1000 babies born. • Literacy rate The percentage of population over the age of 15 who can read and write. • Life expectancy The average lifespan of someone born in that country. Human Development Index (HDI) A number that uses life expectancy, education level and income person. • • Education creates a skilled workforce meaning more goods and services are produced. Educated people earn more money, meaning they also pay more taxes. This money can help develop the country in the future. • Corruption in local and national governments. The stability of the government can effects the country’s ability to trade. Ability of the country to invest into services and infrastructure. Countries that export more than they import have a trade surplus. This can improve the national economy. Having good trade relationships. Trading goods and services is more profitable than raw materials. Health • • • Aid Infant mortality Mixed indicators • Education There are used to compare and understand a country’s level of development. Employment type Aid can help some countries develop key services and infrastructure faster. Aid can improve projects such as schools, hospitals and roads. Too much reliance on aid might stop other trade links becoming established. Trade Lack of clean water and poor healthcare means a large number of people suffer from diseases. People who are ill cannot work so there is little contribution to the economy. More money on healthcare means less spent on development. History • • Colonialism has helped Europe develop, but slowed down development in many other countries. Countries that went through industrialisation a while ago, have now develop further.
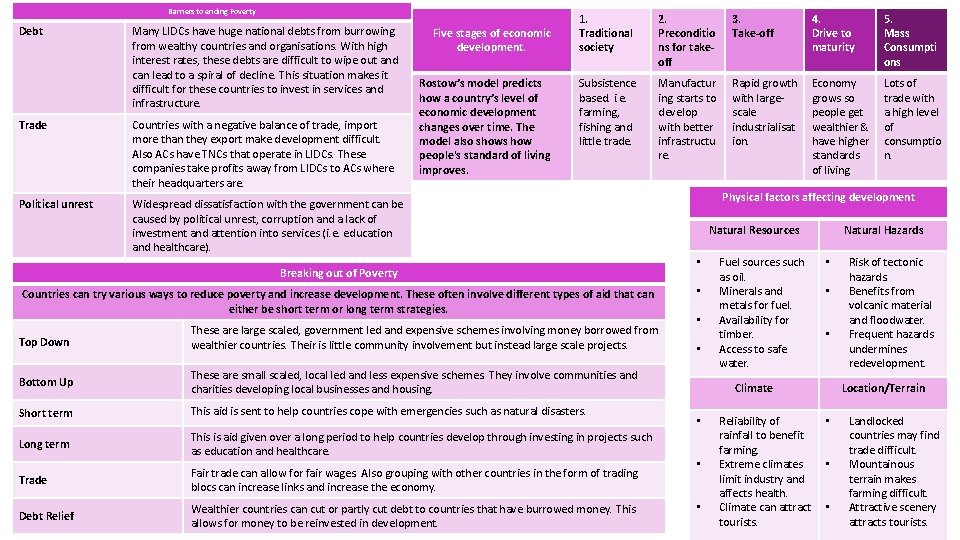
Barriers to ending Poverty Debt Many LIDCs have huge national debts from burrowing from wealthy countries and organisations. With high interest rates, these debts are difficult to wipe out and can lead to a spiral of decline. This situation makes it difficult for these countries to invest in services and infrastructure. Trade Countries with a negative balance of trade, import more than they export make development difficult. Also ACs have TNCs that operate in LIDCs. These companies take profits away from LIDCs to ACs where their headquarters are. Political unrest Widespread dissatisfaction with the government can be caused by political unrest, corruption and a lack of investment and attention into services (i. e. education and healthcare). Five stages of economic development. Rostow’s model predicts how a country’s level of economic development changes over time. The model also shows how people's standard of living improves. 1. Traditional society 2. Preconditio ns for takeoff 3. Take-off 4. Drive to maturity 5. Mass Consumpti ons Subsistence based. i. e. farming, fishing and little trade. Manufactur ing starts to develop with better infrastructu re. Rapid growth with largescale industrialisat ion. Economy grows so people get wealthier & have higher standards of living Lots of trade with a high level of consumptio n. Breaking out of Poverty Countries can try various ways to reduce poverty and increase development. These often involve different types of aid that can either be short term or long term strategies. Top Down These are large scaled, government led and expensive schemes involving money borrowed from wealthier countries. Their is little community involvement but instead large scale projects. Bottom Up These are small scaled, local led and less expensive schemes. They involve communities and charities developing local businesses and housing. Short term This aid is sent to help countries cope with emergencies such as natural disasters. Long term This is aid given over a long period to help countries develop through investing in projects such as education and healthcare. Trade Fair trade can allow for fair wages. Also grouping with other countries in the form of trading blocs can increase links and increase the economy. Debt Relief Wealthier countries can cut or partly cut debt to countries that have burrowed money. This allows for money to be reinvested in development. Physical factors affecting development Natural Resources • • Fuel sources such as oil. Minerals and metals for fuel. Availability for timber. Access to safe water. Natural Hazards • • • Climate • • • Reliability of rainfall to benefit farming. Extreme climates limit industry and affects health. Climate can attract tourists. Risk of tectonic hazards. Benefits from volcanic material and floodwater. Frequent hazards undermines redevelopment. Location/Terrain • • • Landlocked countries may find trade difficult. Mountainous terrain makes farming difficult. Attractive scenery attracts tourists.
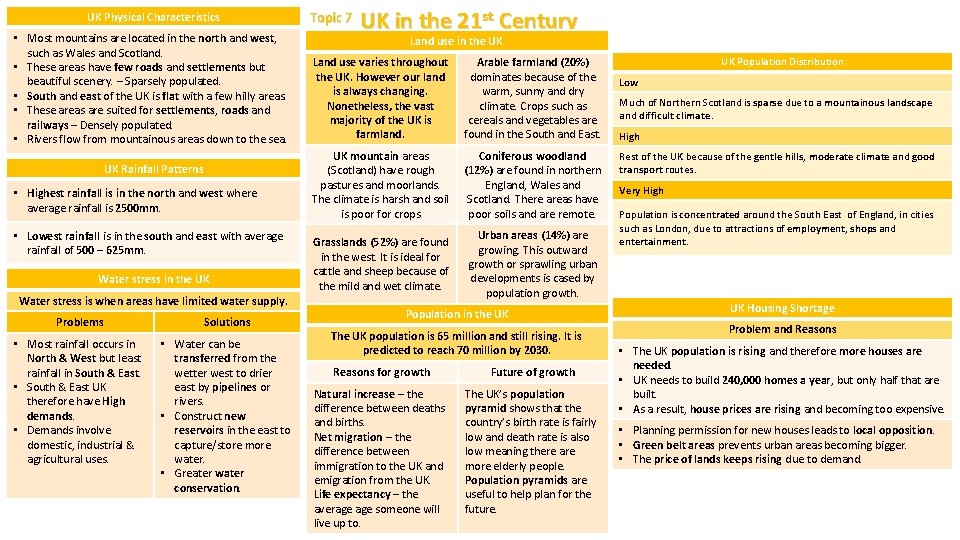
UK Physical Characteristics • Most mountains are located in the north and west, such as Wales and Scotland. • These areas have few roads and settlements but beautiful scenery. – Sparsely populated. • South and east of the UK is flat with a few hilly areas. • These areas are suited for settlements, roads and railways – Densely populated. • Rivers flow from mountainous areas down to the sea. UK Rainfall Patterns • Highest rainfall is in the north and west where average rainfall is 2500 mm. • Lowest rainfall is in the south and east with average rainfall of 500 – 625 mm. Water stress in the UK Water stress is when areas have limited water supply. Problems Solutions • Most rainfall occurs in North & West but least rainfall in South & East. • South & East UK therefore have High demands. • Demands involve domestic, industrial & agricultural uses. • Water can be transferred from the wetter west to drier east by pipelines or rivers. • Construct new reservoirs in the east to capture/store more water. • Greater water conservation. Topic 7 UK in the 21 st Century Land use in the UK Land use varies throughout the UK. However our land is always changing. Nonetheless, the vast majority of the UK is farmland. Arable farmland (20%) dominates because of the warm, sunny and dry climate. Crops such as cereals and vegetables are found in the South and East. UK mountain areas (Scotland) have rough pastures and moorlands. The climate is harsh and soil is poor for crops Coniferous woodland (12%) are found in northern England, Wales and Scotland. There areas have poor soils and are remote. Grasslands (52%) are found in the west. It is ideal for cattle and sheep because of the mild and wet climate. Urban areas (14%) are growing. This outward growth or sprawling urban developments is cased by population growth. Population in the UK The UK population is 65 million and still rising. It is predicted to reach 70 million by 2030. Reasons for growth Future of growth Natural increase – the difference between deaths and births. Net migration – the difference between immigration to the UK and emigration from the UK. Life expectancy – the average someone will live up to. The UK’s population pyramid shows that the country’s birth rate is fairly low and death rate is also low meaning there are more elderly people. Population pyramids are useful to help plan for the future. UK Population Distribution Low Much of Northern Scotland is sparse due to a mountainous landscape and difficult climate. High Rest of the UK because of the gentle hills, moderate climate and good transport routes. Very High Population is concentrated around the South East of England, in cities such as London, due to attractions of employment, shops and entertainment. UK Housing Shortage Problem and Reasons • The UK population is rising and therefore more houses are needed. • UK needs to build 240, 000 homes a year, but only half that are built. • As a result, house prices are rising and becoming too expensive. • Planning permission for new houses leads to local opposition. • Green belt areas prevents urban areas becoming bigger. • The price of lands keeps rising due to demand.
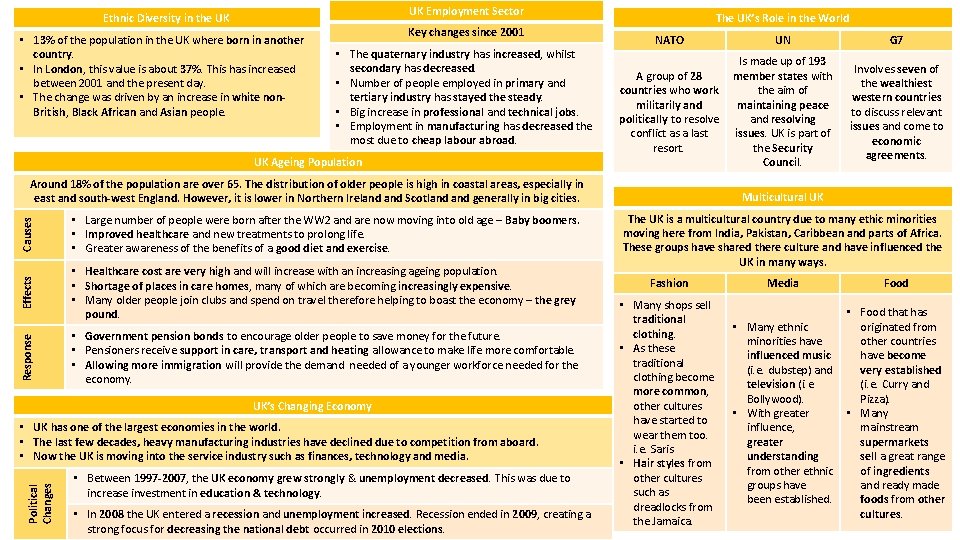
UK Employment Sector Ethnic Diversity in the UK • 13% of the population in the UK where born in another country. • In London, this value is about 37%. This has increased between 2001 and the present day. • The change was driven by an increase in white non. British, Black African and Asian people. Key changes since 2001 • The quaternary industry has increased, whilst secondary has decreased. • Number of people employed in primary and tertiary industry has stayed the steady. • Big increase in professional and technical jobs. • Employment in manufacturing has decreased the most due to cheap labour abroad. UK Ageing Population The UK’s Role in the World NATO UN G 7 A group of 28 countries who work militarily and politically to resolve conflict as a last resort. Is made up of 193 member states with the aim of maintaining peace and resolving issues. UK is part of the Security Council. Involves seven of the wealthiest western countries to discuss relevant issues and come to economic agreements. Causes • Healthcare cost are very high and will increase with an increasing ageing population. • Shortage of places in care homes, many of which are becoming increasingly expensive. • Many older people join clubs and spend on travel therefore helping to boast the economy – the grey pound. Response • Large number of people were born after the WW 2 and are now moving into old age – Baby boomers. • Improved healthcare and new treatments to prolong life. • Greater awareness of the benefits of a good diet and exercise. Effects Around 18% of the population are over 65. The distribution of older people is high in coastal areas, especially in east and south-west England. However, it is lower in Northern Ireland Scotland generally in big cities. • Government pension bonds to encourage older people to save money for the future. • Pensioners receive support in care, transport and heating allowance to make life more comfortable. • Allowing more immigration will provide the demand needed of a younger workforce needed for the economy. UK’s Changing Economy Political Changes • UK has one of the largest economies in the world. • The last few decades, heavy manufacturing industries have declined due to competition from aboard. • Now the UK is moving into the service industry such as finances, technology and media. • Between 1997 -2007, the UK economy grew strongly & unemployment decreased. This was due to increase investment in education & technology. • In 2008 the UK entered a recession and unemployment increased. Recession ended in 2009, creating a strong focus for decreasing the national debt occurred in 2010 elections. Multicultural UK The UK is a multicultural country due to many ethic minorities moving here from India, Pakistan, Caribbean and parts of Africa. These groups have shared there culture and have influenced the UK in many ways. Fashion Media Food • Many shops sell traditional clothing. • As these traditional clothing become more common, other cultures have started to wear them too. i. e. Saris • Hair styles from other cultures such as dreadlocks from the Jamaica. • Many ethnic minorities have influenced music (i. e. dubstep) and television (i. e. Bollywood). • With greater influence, greater understanding from other ethnic groups have been established. • Food that has originated from other countries have become very established (i. e. Curry and Pizza). • Many mainstream supermarkets sell a great range of ingredients and ready made foods from other cultures.
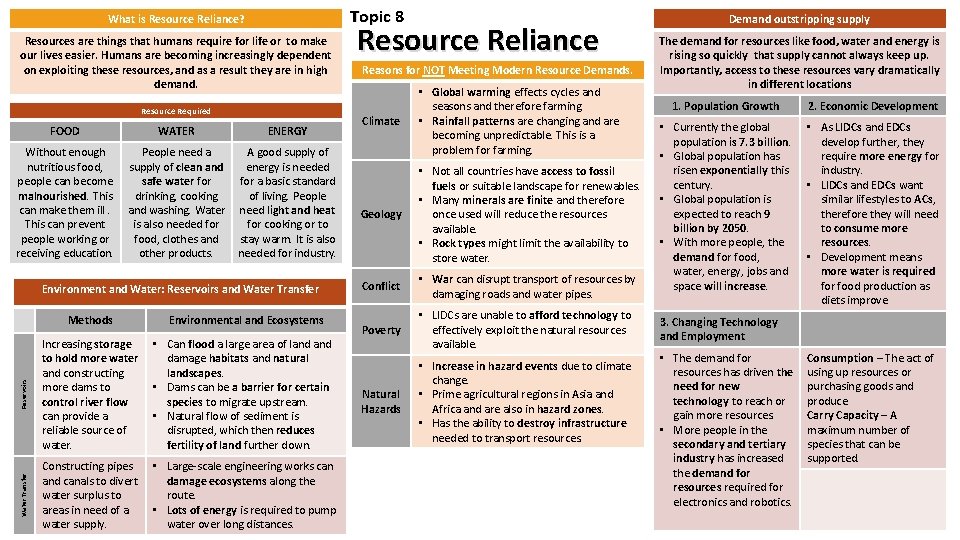
Topic 8 What is Resource Reliance? Resources are things that humans require for life or to make our lives easier. Humans are becoming increasingly dependent on exploiting these resources, and as a result they are in high demand. Resource Required FOOD WATER ENERGY Without enough nutritious food, people can become malnourished. This can make them ill. This can prevent people working or receiving education. People need a supply of clean and safe water for drinking, cooking and washing. Water is also needed for food, clothes and other products. A good supply of energy is needed for a basic standard of living. People need light and heat for cooking or to stay warm. It is also needed for industry. Environment and Water: Reservoirs and Water Transfer Reservoirs Environmental and Ecosystems Increasing storage to hold more water and constructing more dams to control river flow can provide a reliable source of water. • Can flood a large area of land damage habitats and natural landscapes. • Dams can be a barrier for certain species to migrate upstream. • Natural flow of sediment is disrupted, which then reduces fertility of land further down. Water Transfer Methods Constructing pipes and canals to divert water surplus to areas in need of a water supply. • Large-scale engineering works can damage ecosystems along the route. • Lots of energy is required to pump water over long distances. Resource Reliance Reasons for NOT Meeting Modern Resource Demands. Climate • Global warming effects cycles and seasons and therefore farming. • Rainfall patterns are changing and are becoming unpredictable. This is a problem for farming. Geology • Not all countries have access to fossil fuels or suitable landscape for renewables. • Many minerals are finite and therefore once used will reduce the resources available. • Rock types might limit the availability to store water. Conflict • War can disrupt transport of resources by damaging roads and water pipes. Poverty • LIDCs are unable to afford technology to effectively exploit the natural resources available. Natural Hazards • Increase in hazard events due to climate change. • Prime agricultural regions in Asia and Africa and are also in hazard zones. • Has the ability to destroy infrastructure needed to transport resources. Demand outstripping supply The demand for resources like food, water and energy is rising so quickly that supply cannot always keep up. Importantly, access to these resources vary dramatically in different locations 1. Population Growth 2. Economic Development • Currently the global population is 7. 3 billion. • Global population has risen exponentially this century. • Global population is expected to reach 9 billion by 2050. • With more people, the demand for food, water, energy, jobs and space will increase. • As LIDCs and EDCs develop further, they require more energy for industry. • LIDCs and EDCs want similar lifestyles to ACs, therefore they will need to consume more resources. • Development means more water is required for food production as diets improve. 3. Changing Technology and Employment • The demand for resources has driven the need for new technology to reach or gain more resources. • More people in the secondary and tertiary industry has increased the demand for resources required for electronics and robotics. Consumption – The act of using up resources or purchasing goods and produce. Carry Capacity – A maximum number of species that can be supported.
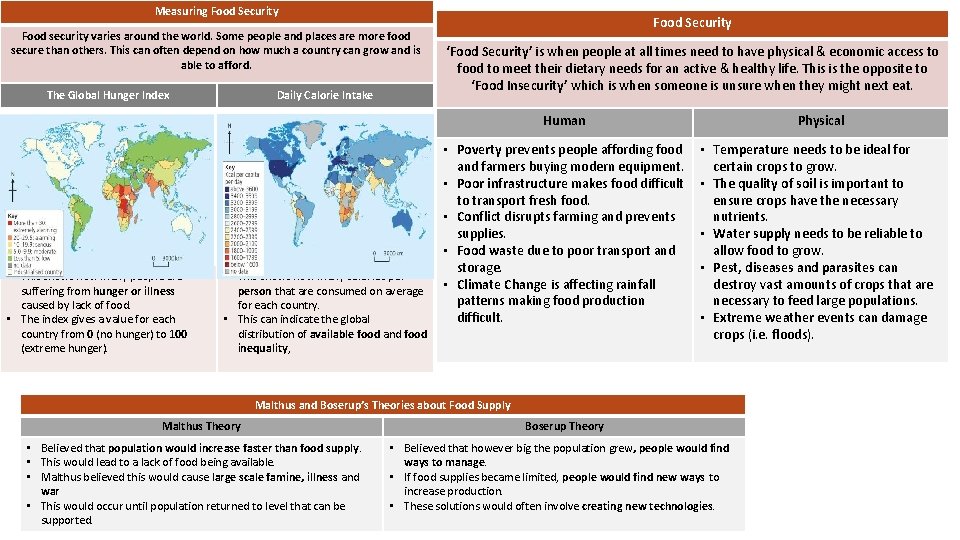
Measuring Food Security Food security varies around the world. Some people and places are more food secure than others. This can often depend on how much a country can grow and is able to afford. The Global Hunger Index Daily Calorie Intake Food Security ‘Food Security’ is when people at all times need to have physical & economic access to food to meet their dietary needs for an active & healthy life. This is the opposite to ‘Food Insecurity’ which is when someone is unsure when they might next eat. Human • This shows how many people are suffering from hunger or illness caused by lack of food. • The index gives a value for each country from 0 (no hunger) to 100 (extreme hunger). • This shows how many calories person that are consumed on average for each country. • This can indicate the global distribution of available food and food inequality, • Poverty prevents people affording food and farmers buying modern equipment. • Poor infrastructure makes food difficult to transport fresh food. • Conflict disrupts farming and prevents supplies. • Food waste due to poor transport and storage. • Climate Change is affecting rainfall patterns making food production difficult. Physical • Temperature needs to be ideal for certain crops to grow. • The quality of soil is important to ensure crops have the necessary nutrients. • Water supply needs to be reliable to allow food to grow. • Pest, diseases and parasites can destroy vast amounts of crops that are necessary to feed large populations. • Extreme weather events can damage crops (i. e. floods). Malthus and Boserup’s Theories about Food Supply Malthus Theory • Believed that population would increase faster than food supply. • This would lead to a lack of food being available. • Malthus believed this would cause large scale famine, illness and war • This would occur until population returned to level that can be supported. Boserup Theory • Believed that however big the population grew, people would find ways to manage. • If food supplies became limited, people would find new ways to increase production. • These solutions would often involve creating new technologies.
- Slides: 19