Nagios as a PC Health Monitor Sean Falzon






- Slides: 30

Nagios as a PC Health Monitor Sean Falzon seanf@srw. com. au @rhassing

Introduction Who am I?

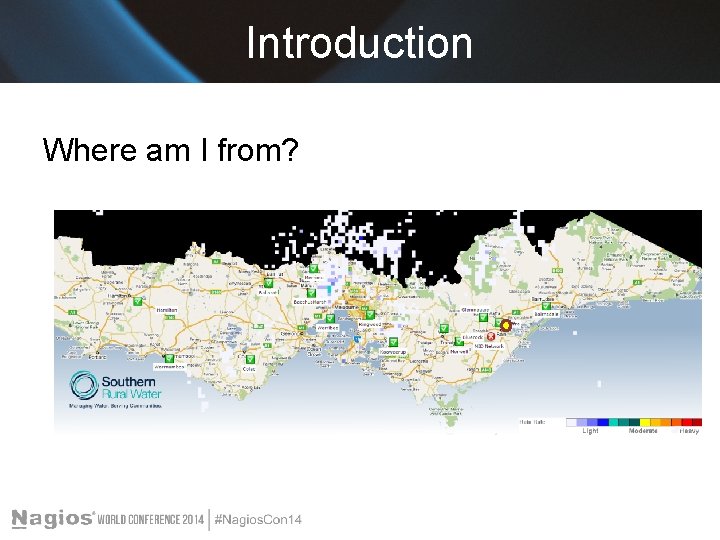
Introduction Where am I from?

Agenda We will be covering • The Journey • • • How we (IT) use nagios & how the business uses it Why we started monitoring end user computers How we monitor end user pc’s & lessons we learnt • What we are getting out of it now • Customer satisfaction as a driver for high performance culture

Introduction How do we use Nagios? o Core Infrastructure o Office Temperature o Wireless Communications network o Asterisk Integration o Service Desk Plus integration

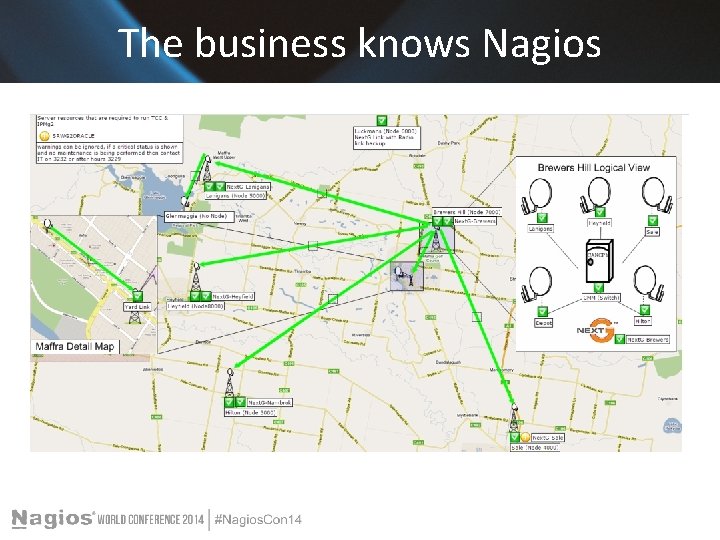
The business knows Nagios We give the operators of the irrigation district access to Nagvis for monitoring of the communications network So its important to know that the business knows we have monitoring technology deployed

The business knows Nagios

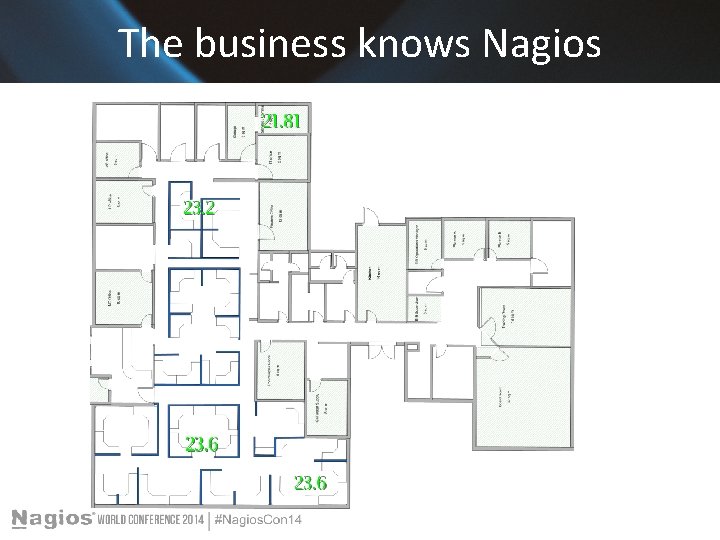
The business knows Nagios We even use it to solve Occupational Health and Safety Issues

The business knows Nagios

Introduction of pc monitoring What have we done so far in the area of PC monitoring?

Why? Why do we now want to monitor the entire PC fleet?

How? What approach are we now using? Passive Checks

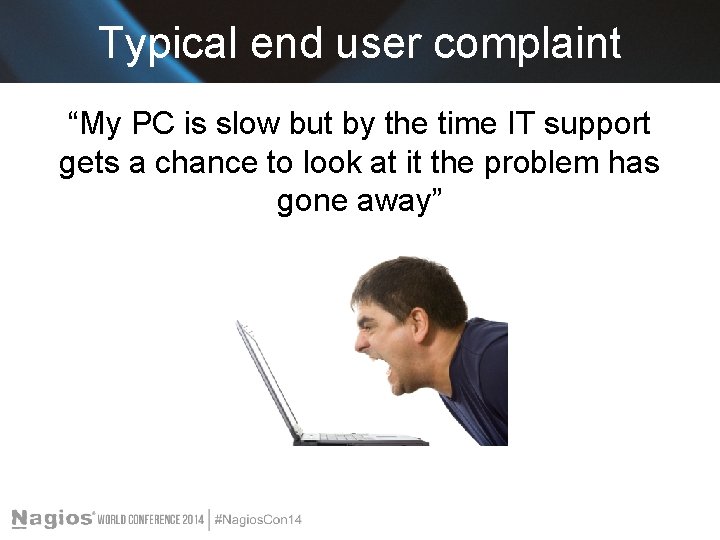
Typical end user complaint “My PC is slow but by the time IT support gets a chance to look at it the problem has gone away”

Why monitor pc’s ? • Difficulties tracking down end user complaints about performance • Software vendors often tell business managers the issues are hardware related • Memory • CPU

Customer Service As a business we have a strategic goal of improving customer control and convenience Internally our IT support team has the same goal of improving the control and convenience of the internal customers

Why use Nagios? Nagios core functionality covers the required functionality of any PC fleet monitoring Visibility Awareness Remediation Reporting

Visibility “If we can’t see the problem we can’t fix it”

Awareness “Is this issue only affecting one user or is it system wide”

Remediation “We know what the problem is, let’s fix it”

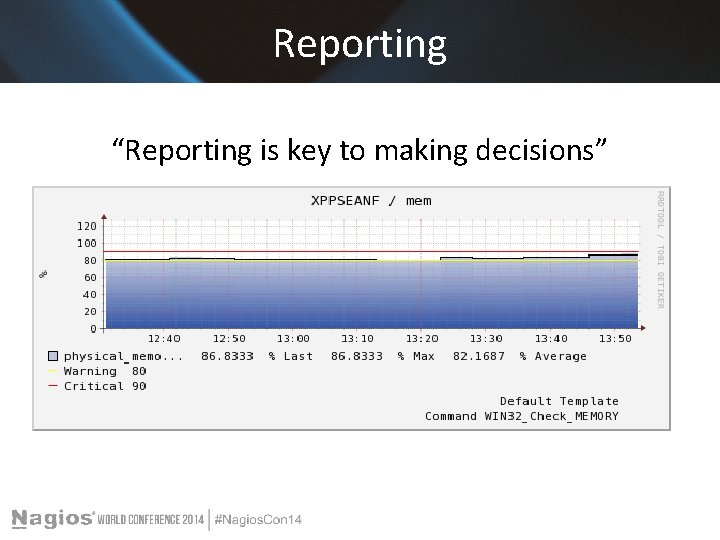
Reporting “Reporting is key to making decisions” When faced with budget cuts reporting on system performance is a powerful tool to identify which systems need to be replaced sooner than later.

What is required? Two components are required • Nagios installation either XI or Core • Any compatible client on the PC § NSClient++ § NCPA § others…

Configuration Example for Nagios Core • Assume you have enabled NSCA • Configure a host template with the following “services” – – – cpu disk mem Make sure they are configured to never be actively checked.

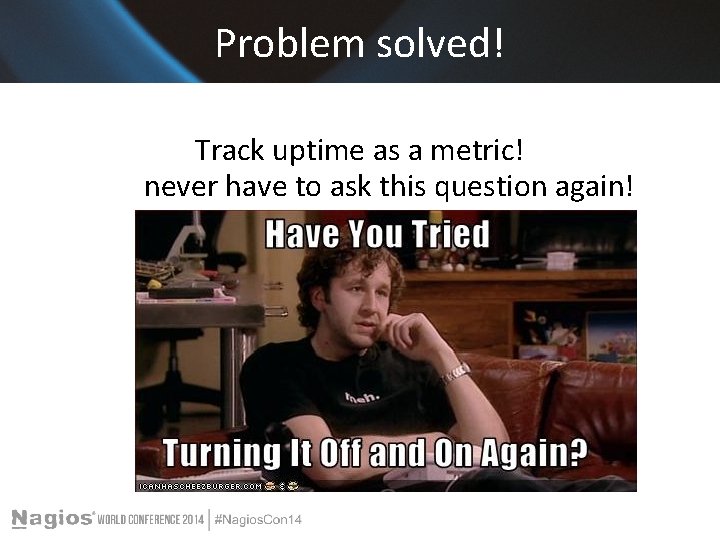
Problem solved! Track uptime as a metric! never have to ask this question again!

Distribute your client configuration How you distribute your configuration file depends on your environment. Options would include • System management software • GPO • Login script

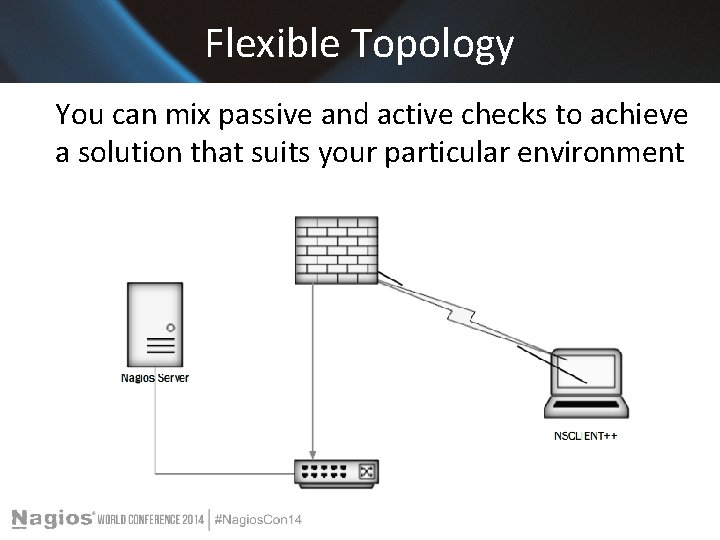
Flexible Topology You can mix passive and active checks to achieve a solution that suits your particular environment

Conclusion Nagios as a PC monitoring Solution • • Flexible Adaptive to changes – deploy a new config to track a new statistic Powers decision making process for pc replacement Allows for proactive fault resolution for end users • Drives high performance cultures in a business

Questions? Any questions? Thanks!

Oh one more thing It is easier to get a cute girl to smile for a camera than it is to monitor your fleet of PC’s

For Mila

The End Sean Falzon seanf@srw. com. au @nozlaf_au