n The leading cause of unnecessary premature death

 n --Maris")


死亡率趨勢 91 台北市 新北市 台中市 台南市 高雄市 基隆市 新竹市 嘉義市 桃園縣 新竹縣 宜蘭縣")
 自殺(粗)死亡率 排名變化 排名下降 排名上升 年 101 100 99 98 97 96")

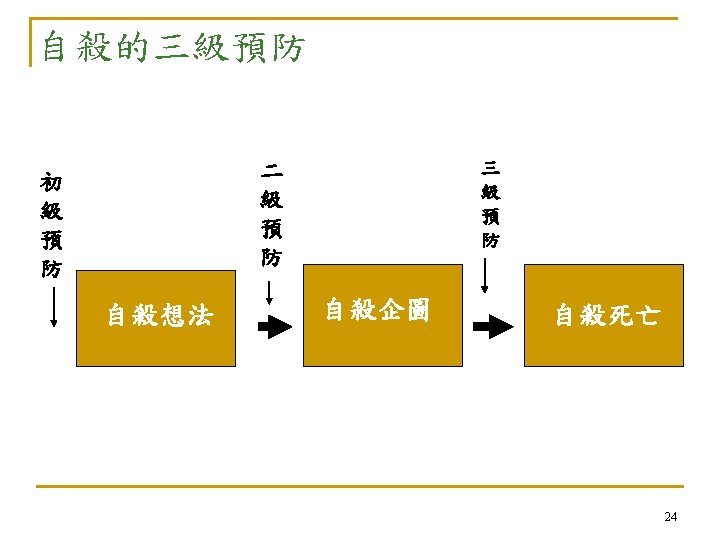
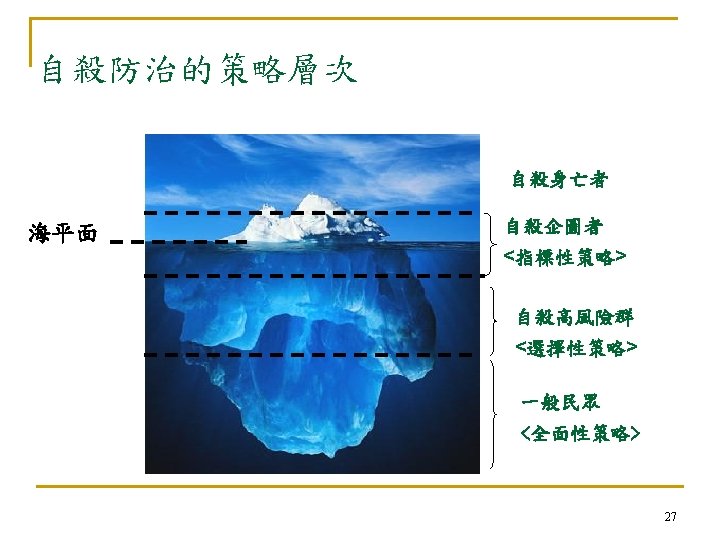
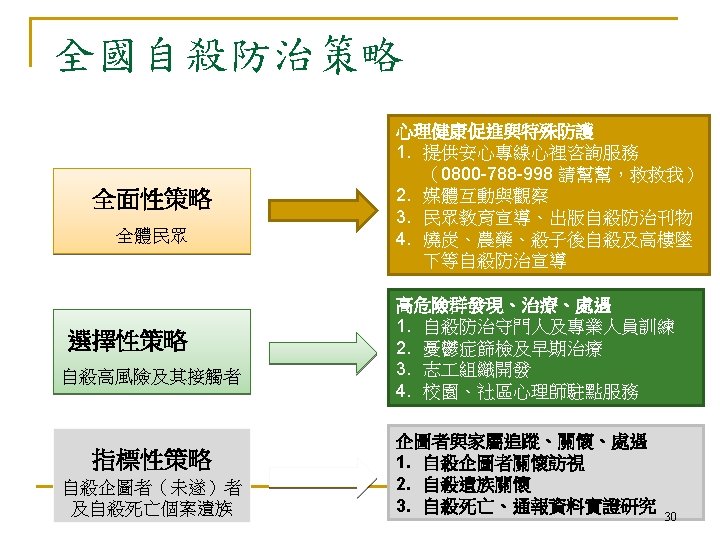
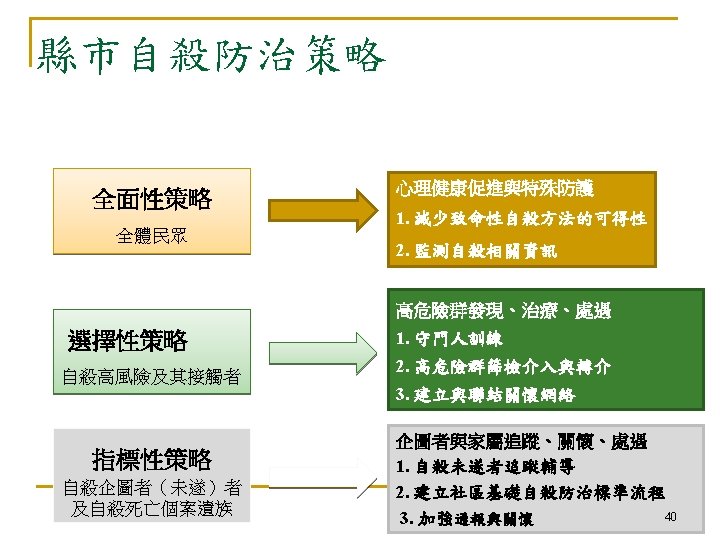
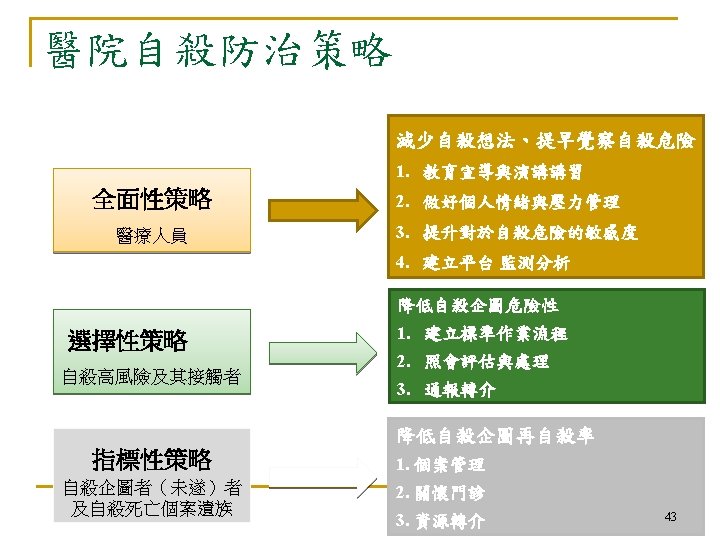
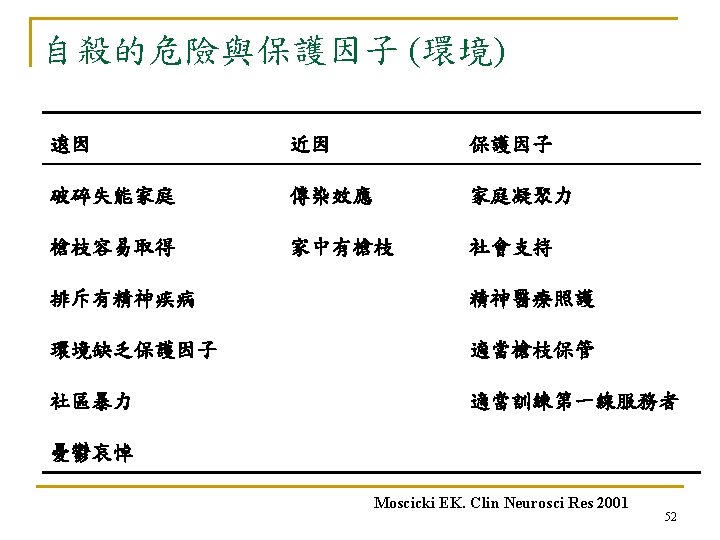
 Selective (選擇性) Population Mortality threshold Indicative (指標性)")


 S 性別 A 年齡 D 憂鬱/躁鬱 情感疾病")


- Slides: 69
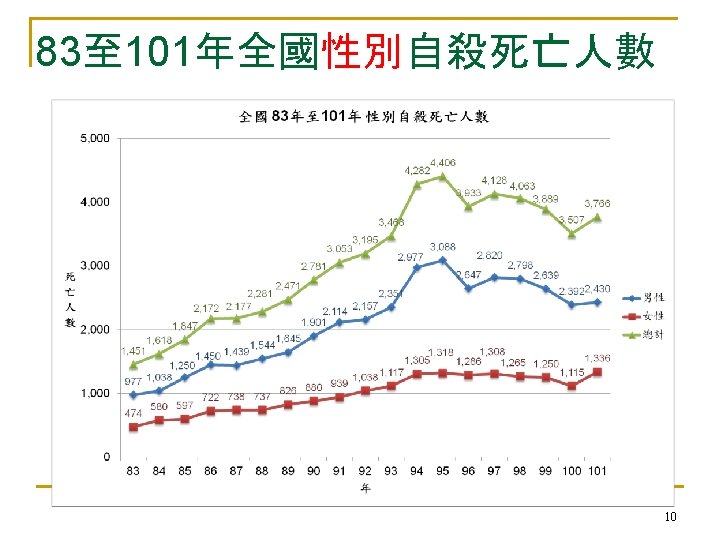
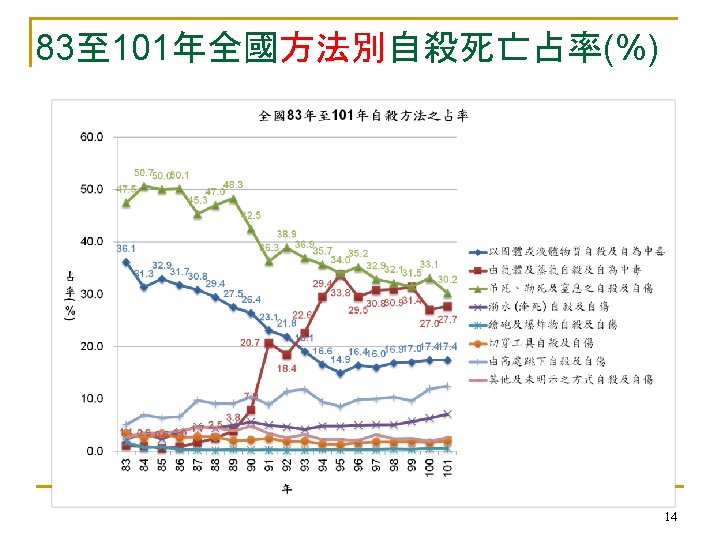
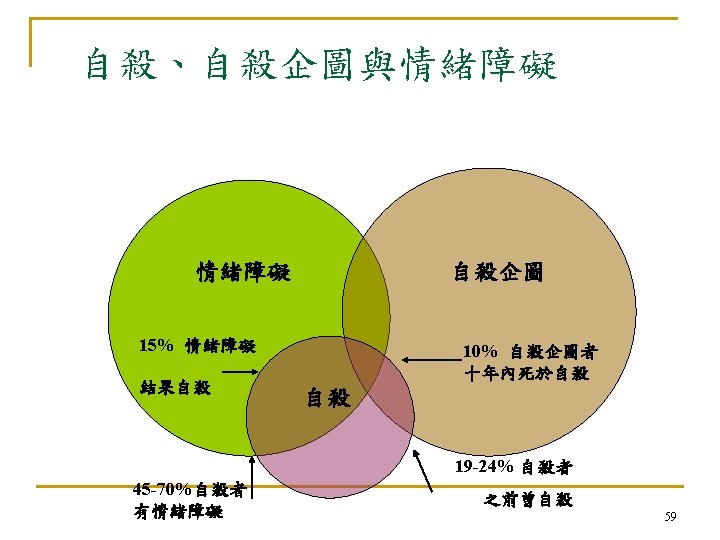
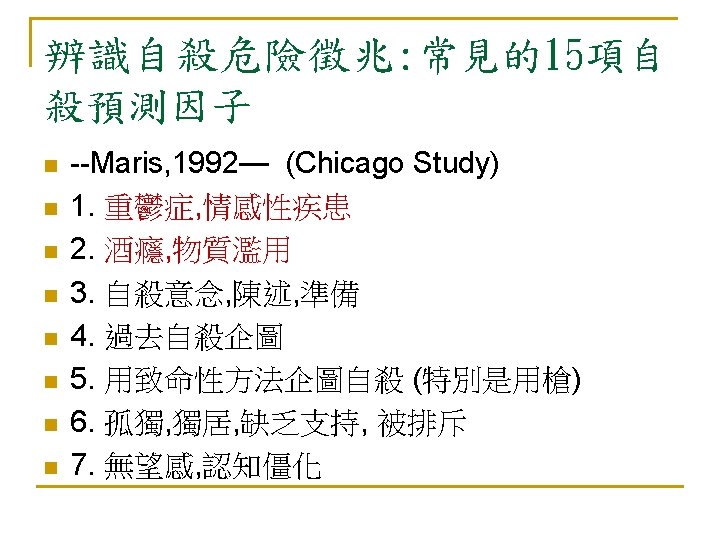
自殺:亙古的問題 新的挑戰 n 自殺是人類非必要早夭的主要原因 (The leading cause of unnecessary, pre-mature death. ) n --Maris et al, 2000
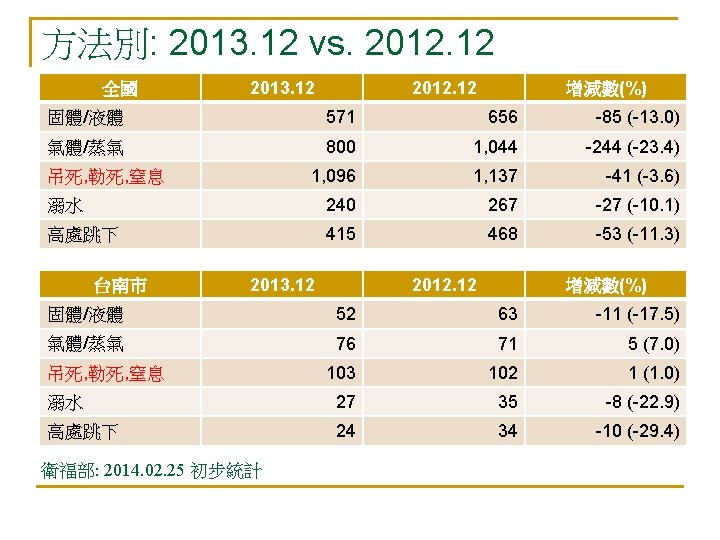
自殺死亡統計: 2013. 12 vs. 2012. 12 2013. 12 2012. 12 全國 台北市 新北市 台中市 台南市 高雄市 桃園縣 增減數 數目 百分比 全體 3, 262 3, 766 -504 -13. 4 65 + 800 835 -4. 2 全體 241 333 -92 -27. 6 65 + 69 65 4 6. 2 全體 508 573 -65 -11. 3 65 + 97 95 2 2. 1 全體 318 366 -48 -13. 1 65 + 64 67 -3 -4. 5 全體 298 322 -24 -7. 5 65 + 80 82 -2 -2. 4 全體 415 517 -102 -19. 7 65 + 84 99 -15. 2 全體 261 338 -77 -22. 8 65 + 48 78 -30 -38. 5 衛福部: 2014. 02. 25 初步統計
16
91年至 101年縣市別自殺(粗)死亡率趨勢 91 台北市 新北市 台中市 台南市 高雄市 基隆市 新竹市 嘉義市 桃園縣 新竹縣 宜蘭縣 苗栗縣 彰化縣 南投縣 雲林縣 嘉義縣 屏東縣 澎湖縣 花蓮縣 台東縣 金門縣 連江縣 n 325 343 218 328 420 77 48 36 256 60 89 90 159 117 135 91 141 9 63 42 5 1 92 率 12. 3 9. 5 8. 7 17. 7 15. 3 19. 7 12. 8 13. 4 14. 4 13. 3 19. 1 16. 1 12. 1 21. 6 18. 2 16. 2 15. 5 9. 7 17. 9 17. 2 8. 6 11. 4 n 320 450 243 286 449 93 43 43 277 60 87 86 184 97 141 83 144 10 61 31 5 2 93 率 12. 1 12. 3 9. 6 15. 4 16. 4 23. 7 11. 3 16. 0 15. 3 13. 2 18. 8 15. 3 14. 0 17. 9 19. 0 14. 8 15. 9 10. 8 17. 3 12. 7 8. 3 22. 8 n 346 561 301 328 439 85 67 41 287 58 74 102 191 97 110 80 159 8 75 52 6 1 94 率 13. 2 15. 2 11. 9 17. 6 16. 0 21. 7 17. 4 15. 2 15. 6 12. 5 16. 0 18. 2 14. 5 18. 0 14. 9 14. 3 17. 6 8. 7 21. 4 21. 5 9. 6 11. 0 n 467 721 357 395 569 116 66 59 338 88 93 118 211 122 125 104 188 11 77 49 6 2 95 率 17. 8 19. 4 14. 0 21. 2 20. 7 29. 6 17. 0 21. 8 18. 1 18. 6 20. 1 21. 1 16. 0 22. 7 17. 0 18. 7 20. 9 11. 9 22. 1 20. 4 8. 9 20. 3 下降 n 454 767 372 398 564 113 63 63 352 111 103 125 222 129 135 115 175 16 75 49 5 0 96 率 17. 3 20. 4 14. 4 21. 3 20. 5 28. 9 16. 0 23. 2 18. 6 23. 0 22. 3 16. 9 24. 1 18. 5 20. 7 19. 5 17. 4 21. 7 20. 6 6. 8 0. 0 n 364 659 378 342 510 104 49 41 265 82 103 114 223 127 161 98 159 14 78 53 9 0 97 率 13. 8 17. 4 14. 6 18. 3 18. 5 26. 6 12. 3 15. 0 13. 8 16. 7 22. 4 20. 4 17. 0 23. 8 22. 1 17. 7 17. 8 15. 2 22. 7 22. 6 11. 4 0. 0 上升 n 370 706 438 348 527 102 69 33 320 77 79 106 224 141 149 130 192 7 63 39 7 1 98 率 14. 1 18. 5 16. 7 18. 6 19. 0 26. 2 17. 2 12. 1 16. 4 15. 4 17. 1 18. 9 17. 1 26. 5 20. 6 23. 6 21. 6 7. 5 18. 4 16. 8 8. 4 10. 2 n 341 667 412 387 513 109 70 49 337 85 99 126 213 123 103 165 20 70 51 9 1 99 率 13. 0 17. 3 15. 7 20. 6 18. 5 28. 0 17. 1 17. 9 17. 1 16. 8 21. 5 22. 5 16. 2 21. 3 17. 0 18. 8 18. 7 21. 1 20. 5 22. 0 10. 1 10. 2 n 329 668 379 321 508 92 61 39 292 97 93 114 194 96 122 134 193 13 79 55 9 1 率 12. 6 17. 2 14. 3 17. 1 18. 3 23. 8 14. 3 14. 7 18. 9 20. 2 20. 3 14. 8 18. 2 16. 9 24. 6 22. 0 13. 5 23. 2 23. 7 9. 4 10. 1 100 n 率 306 11. 6 566 14. 5 344 12. 9 334 17. 8 467 16. 8 87 22. 8 48 11. 5 40 14. 7 296 14. 7 77 14. 9 79 17. 2 78 13. 9 171 13. 1 111 21. 2 118 16. 5 102 18. 9 153 17. 6 16 16. 5 72 21. 3 34 14. 8 8 8. 0 0 0. 0 101 n 率 333 12. 5 573 14. 6 366 13. 7 322 17. 1 517 18. 6 68 18. 0 56 13. 3 41 15. 1 338 16. 7 65 12. 5 106 23. 1 107 19. 0 212 16. 3 106 20. 3 162 22. 7 94 17. 5 158 18. 3 20 20. 4 68 20. 2 39 17. 2 15 13. 8 0 0. 0
91年至 101年 縣市別(新制) 自殺(粗)死亡率 排名變化 排名下降 排名上升 年 101 100 99 98 97 96 95 94 93 92 91 台北市 20 19 20 20 18 18 17 16 17 18 16 新北市 16 15 11 13 9 12 12 17 20 台中市 18 18 17 19 15 17 20 20 19 21 21 台南市 12 5 12 7 8 9 8 5 6 10 6 高雄市 7 8 9 11 6 8 11 8 10 7 11 基隆市 9 1 2 1 1 1 2 新竹市 19 20 15 14 11 20 19 18 8 19 15 嘉義市 15 14 18 12 19 16 3 4 13 8 13 桃園縣 13 13 16 15 16 19 14 15 11 12 12 新竹縣 21 11 8 17 17 14 4 14 18 15 14 宜蘭縣 1 7 7 4 12 5 5 11 9 4 3 苗栗縣 6 16 6 2 7 7 6 6 4 11 9 彰化縣 14 17 14 18 13 13 18 19 15 14 17 南投縣 4 3 10 5 1 2 2 2 5 5 1 雲林縣 2 9 13 16 5 6 15 17 14 3 4 嘉義縣 10 4 1 9 3 11 9 13 16 13 8 屏東縣 8 6 5 10 4 10 13 7 7 9 10 澎湖縣 3 10 19 6 22 15 16 21 22 20 19 花蓮縣 5 2 4 8 10 3 7 3 3 6 5 台東縣 11 12 3 3 14 4 10 9 2 16 7 金門縣 17 21 22 22 21 21 21 22 22 連江縣 22 22 21 21 20 22 22 10 20 2 18
Both Risk & Population-based Approach Universal (全面性) Selective (選擇性) Population Mortality threshold Indicative (指標性) Low High Suicide risk
歷年全國與通報人次/比 2009 2010 2011 2012 2013. 06 19, 162 23, 031 24, 245 25, 813 26, 870 26, 183 28, 475 9 全國通報比 8 7 5. 9 6 8. 1 7. 5 6. 9 6. 4 5. 9 6. 8 4. 3 5 4 3 2 全國通報比 1 年 12 20 11 20 10 20 09 20 08 0 20 通報比 07 全國 4. 3 5. 9 6. 4 6. 9 7. 5 8. 1 6. 8 20 年度 2006 2007 2008 2009 2010 2011 2012 2013. 06 13, 702 3. 06 2008 20 1 2007 06 全國 2006 20 年度
2011年自殺通報性別年齡層別促發原因 男性 女性 自殺原因 15 -24% 25 -44% 45 -64% 65+% 總% 家人間情感因素 21. 3 17. 5 18. 9 18. 6 18. 7 20. 5 19. 9 28. 7 24. 7 22. 5 憂鬱傾向 16. 8 17. 9 16. 1 17. 5 15. 9 22. 7 26. 2 22. 4 22. 5 感情因素 31. 3 16. 7 4. 4 1. 2 13. 4 43. 4 25. 1 8 1. 1 22. 2 有憂鬱症病史 11. 1 11. 3 9. 8 6. 2 10. 9 18. 9 20. 8 9. 6 17. 5 夫妻問題 1. 5 12. 1 12. 5 7. 4 10. 1 4. 9 19. 3 19. 9 7. 4 16. 5 疾病因素 1. 8 4. 1 14. 9 42. 3 11. 4 1. 7 3 8. 6 39. 8 6. 4 失業 3. 6 11. 9 12. 9 0. 9 9. 6 1. 8 4. 5 3. 9 0. 5 3. 7 2011. 1~2011. 12 全國自殺通報個案自殺原因排名 34 34
SAD PERSONS (Patterson et al, 1983) S 性別 A 年齡 D 憂鬱/躁鬱 情感疾病
SAD PERSONS Previous suicide attempt 過去曾嘗試過自殺 Ethanol use 酒精濫用 Rational thinking loss 精神病狀態 Social support lacking 缺乏社會支持 Organized plan 有明確自殺計劃或規劃中 No spouse 離婚、喪偶、分居或單身 Sickness 慢性且嚴重的身體疾病
SAD PERSONS Items Scores Sex Male 1/0 Age 12 -29 or >50 1/0 Depression depression 1/0 Previous attempt 1/0 Ethanol abuse Alcohol abuse 1/0 Rational thinking Loss 1/0 Social support Lack of support 1/0 Organized plan Well-organized 1/0 No spouse: No spouse 1/0 Sickness: Sick 1/0 Low: 0 -3 psychosocial management and psychiatric OPD F/U, Medium: 4 -7 psychiatric consultation, High: 8 -10 admission to psychiatric ward 56