n PCR PCR The software displays the fluorescence


 The biggest disadvantage of SYBR is that")

定量准确,实时监控 2) 敏感性和特异性高 3)简单快速,30个循环 20几分 钟就能够完成。 4)污染可能性小 5)不需要常规的产物后期复杂 处理,直接观测结果 6)可以进行点突变分析,根据 熔点曲线的不同直接分析点突 变的情况。 Advantages")


- Slides: 29
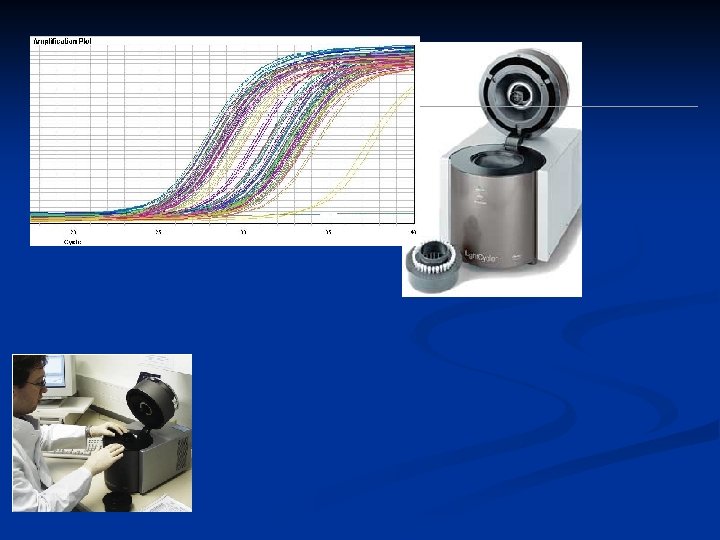
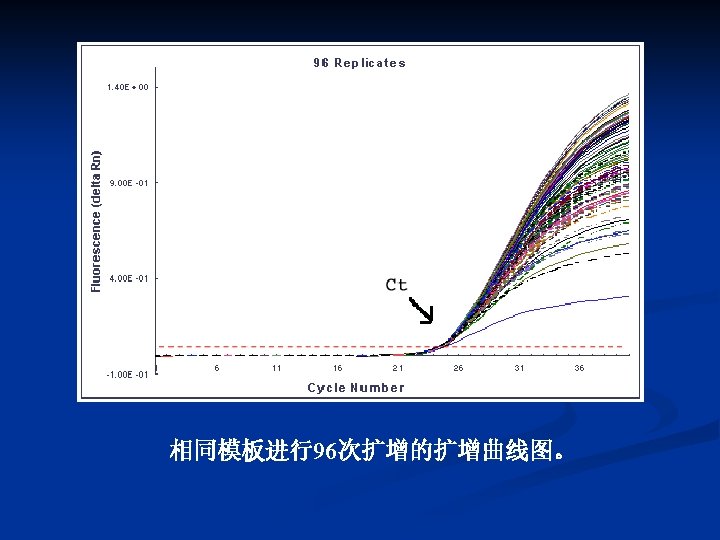
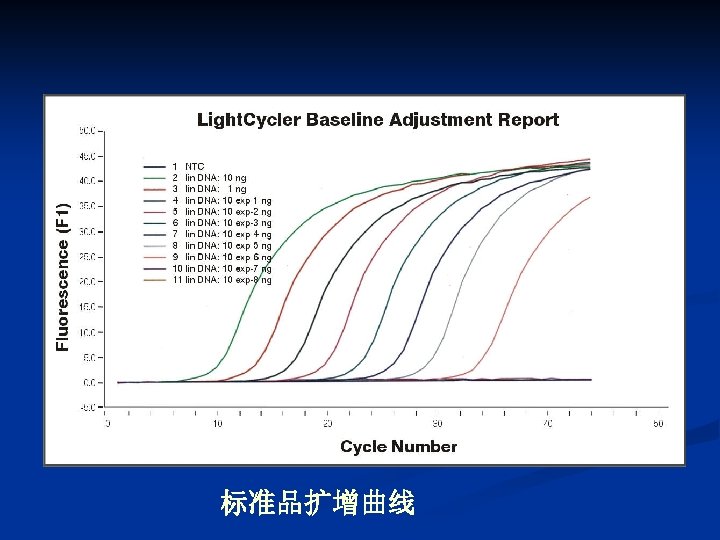
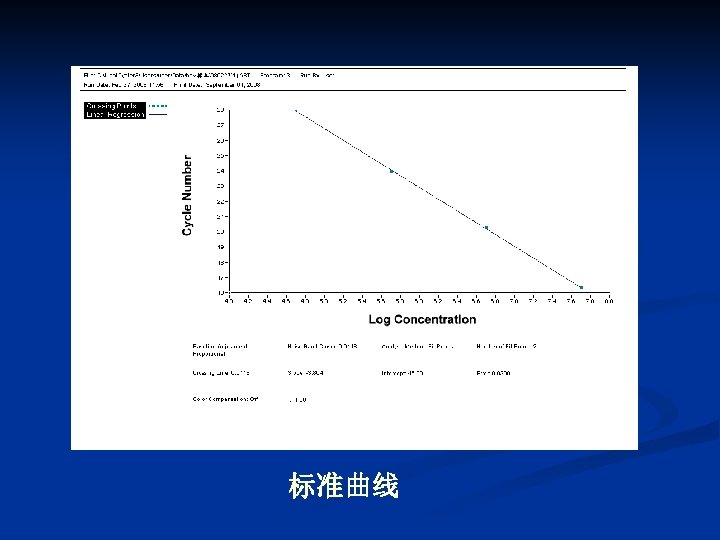
n 荧光定量PCR检测的是 样本的初始浓度,而准 确测定初始浓度需要在 对数期进行。 荧光定量PCR在每一次循环 后对进行实时监控,因此 能最准确反映出对数期。 确定准确的初始浓度。 软件系统可以进行参 数设定、保存数据和 报告结果,并将结果 自动保存在计算机中。 The software displays the fluorescence signals in real-time immediately after each measurement. Signals from the samples are obtained as the machine positions the capillaries sequentially over the optical unit. During thermal cycling, fluorescence can be measured once per cycle for every capillary and the fluorescence values are displayed immediately on the screen and updated after every cycle (Fig. 3). The generated data are stored for further analysis.
缺点:存在非特异性产物, 可以与非特异性产物,甚至 引物二聚体结合发出荧光。 可以使用熔点曲线分析进 行鉴别,明显提高诊断的 特异性。(F 1通道) The biggest disadvantage of SYBR is that it binds to any ds. DNA; the specific product, non-specific products and primer dimers are detected equally well. The Light. Cycler Instrument allows melting curve analysis Once the melting point of the product has been determined the Light. Cycler Instrument's flexible programming allows the user to acquire fluorescence above the melting temperature of the primer dimers, but below the melting temperature of the product.
荧光定量PCR技术的优点 1)定量准确,实时监控 2) 敏感性和特异性高 3)简单快速,30个循环 20几分 钟就能够完成。 4)污染可能性小 5)不需要常规的产物后期复杂 处理,直接观测结果 6)可以进行点突变分析,根据 熔点曲线的不同直接分析点突 变的情况。 Advantages of the Light. Cycler System Watch amplification as it occurs: real-time, on-line fluorescence allows you to see the results of every cycle as soon as PCR proceeds Save time: extremely rapid PCR, 20 minutes for 30 cycles Verify amplicon specificity: melting curve analysis provides differentiation between amplification products Detect mutations: changes in the melting curve analysis can be used to identify mutations Minimize contamination: amplification and detection are performed in the same closed tube
Figure 3. Mutation detection by melting curve analysis. Top panel: melting curves of amplified gene fragments from wild-type and mutant individuals. Bottom panel: negative first derivatives of the melting curves showing the unique melting peak of each genotype. The gene fragment amplified from the heterozygous individual exhibits a melting curve with both the wildtype and mutant peaks (red plot).