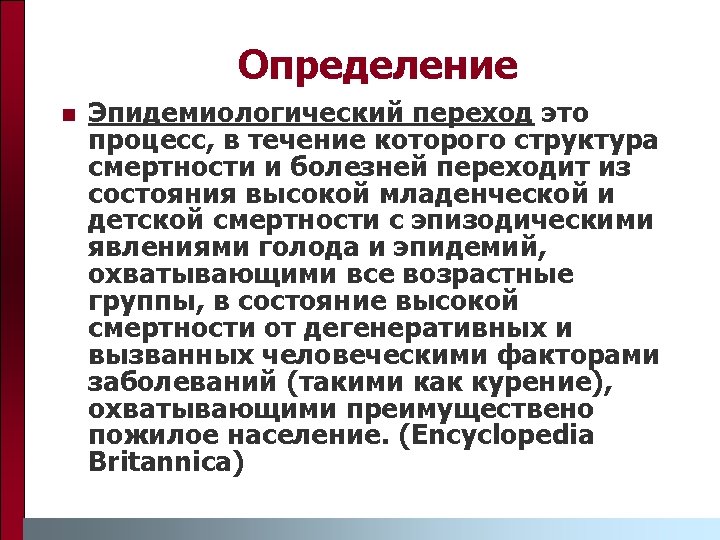
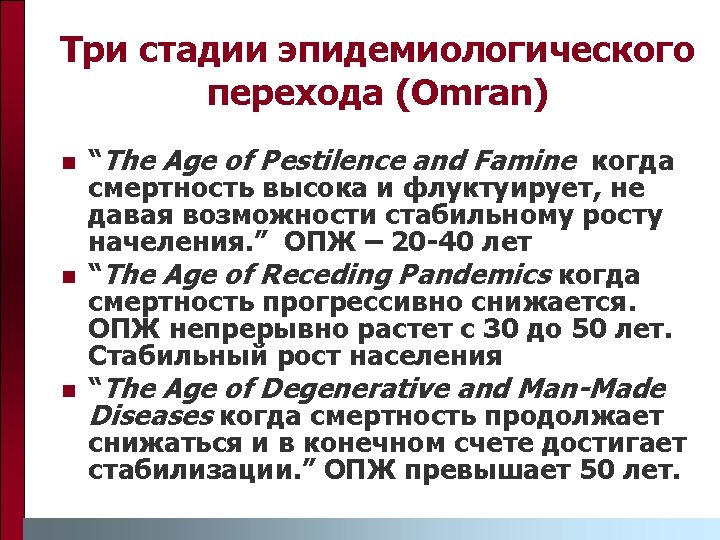
n Omran Abdel R 1971 The epidemiologic transition


Теория эпидемиологического перехода n Omran, Abdel R. 1971. The epidemiologic transition: A theory of the epidemiology of population change. Milbank Memorial Fund Quaterly, 29: 509 -538


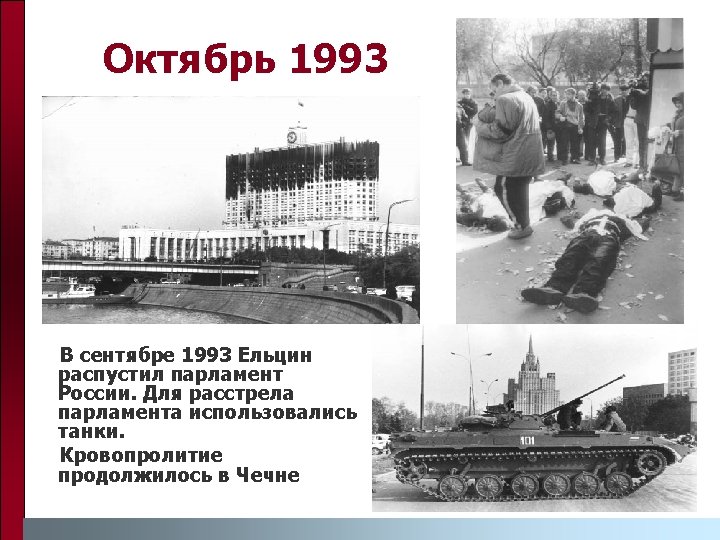
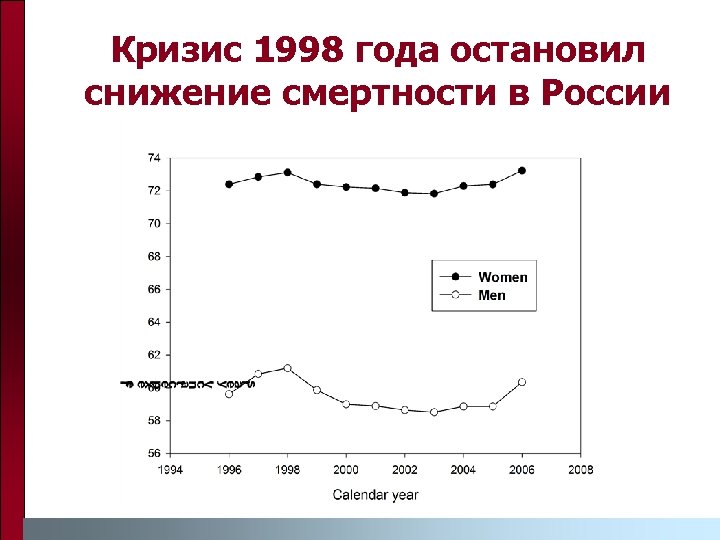

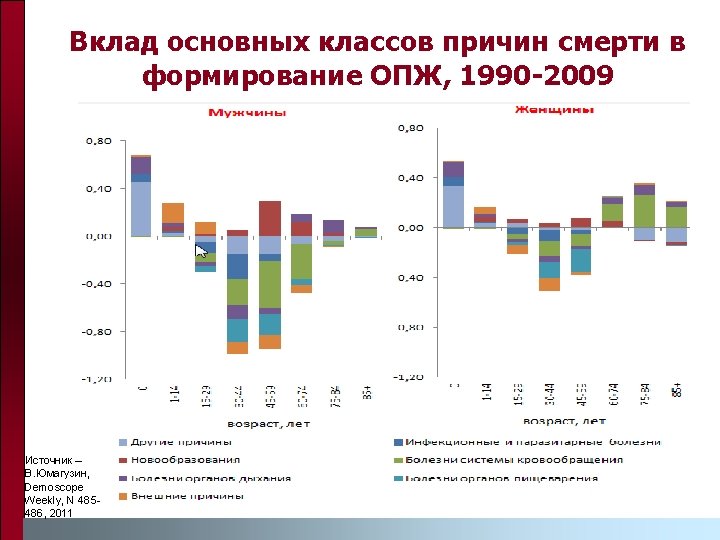
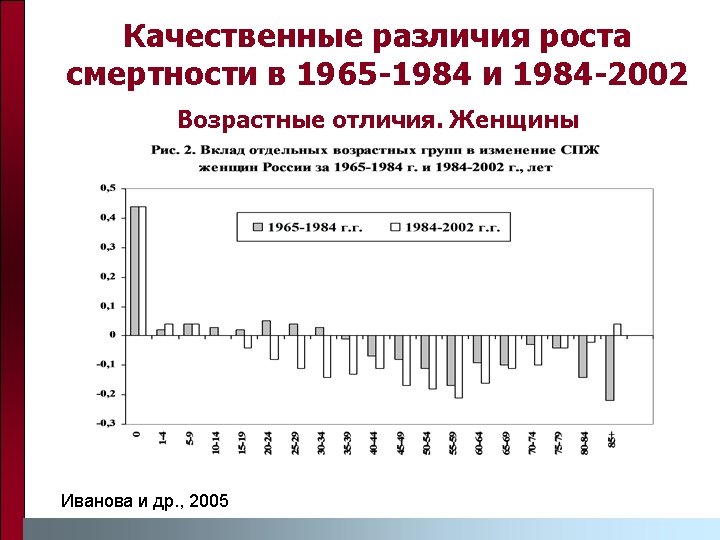
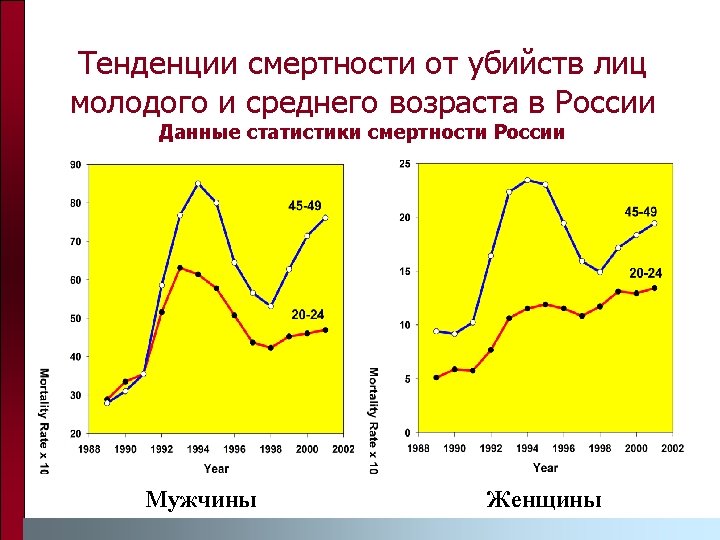
Decline of life expectancy at age 15 between 1998 -2005. Men

Decline of life expectancy at age 15 between 1998 -2005. Women
 ■ Russia ■ Average, transition countries")
Реальный ВВП (1989=100) ■ Russia ■ Average, transition countries
")
Russian President on Demographic Situation in Russia (Address to Russian Parliament, May 10, 2006) n n n Demographic problem is "the most urgent problem of modern Russia" Demographic situation is "critical" "We talked at lot on this topic but did little. " Government is "too slow with unacceptable bureaucracy in resolving the problem" Suggested 10+ year program with three priorities: -- to decrease mortality -- effective migration policy -- to increase fertility
")
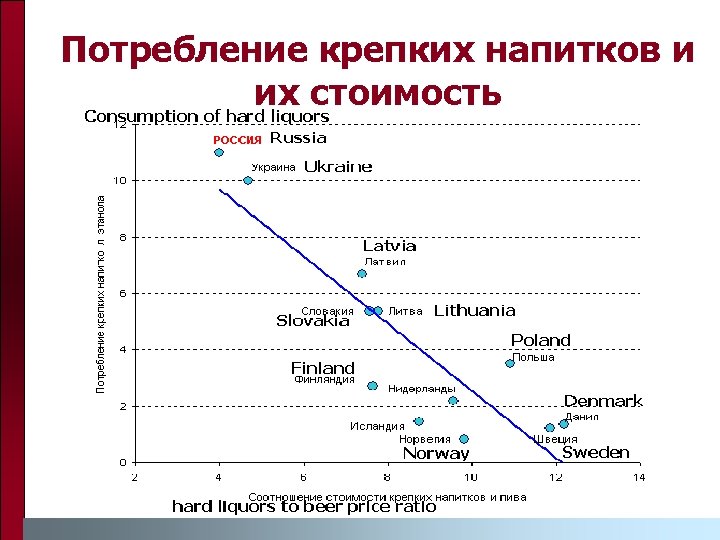
Russian President on How to Decrease Mortality (Address to Russian Parliament, May 10, 2006) n n n Program to prevent traffic accidents and improve road safety (high penalties for drunk driving) To eradicate production and import of alcohol surrogates (poisoned alcohol) National Project "Health" focused on prevention and treatment of cardiovascular diseases, and other major causes of death. Smoking ban in public places High taxes on hard liquors

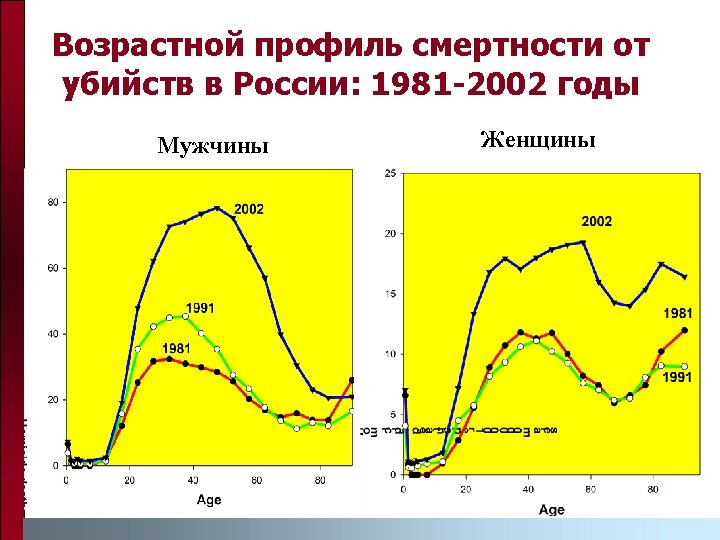

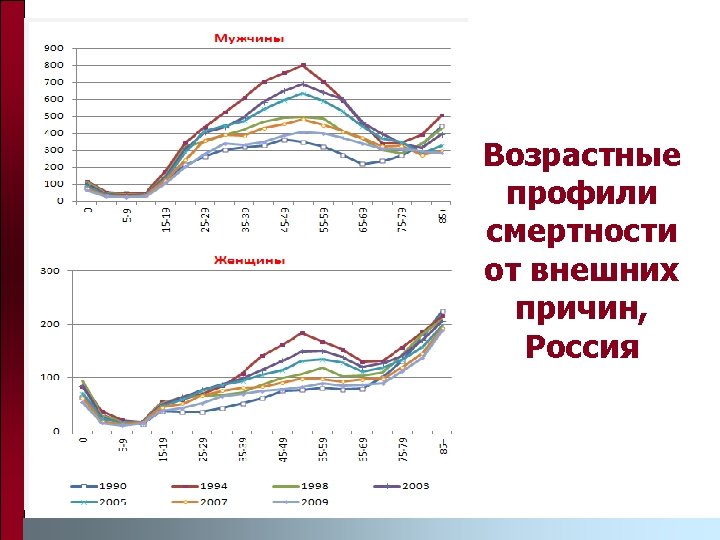
Age Profiles of Mortality from Accidental Poisoning by Alcohol Data from Russian Vital Statistics Males Females
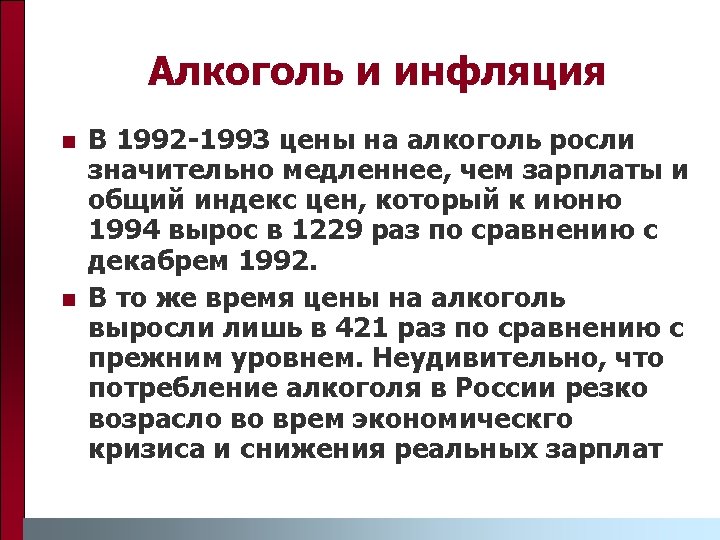

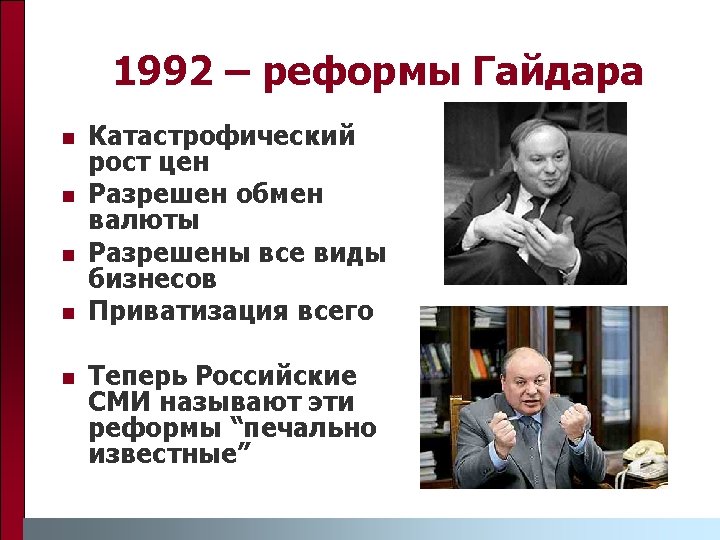
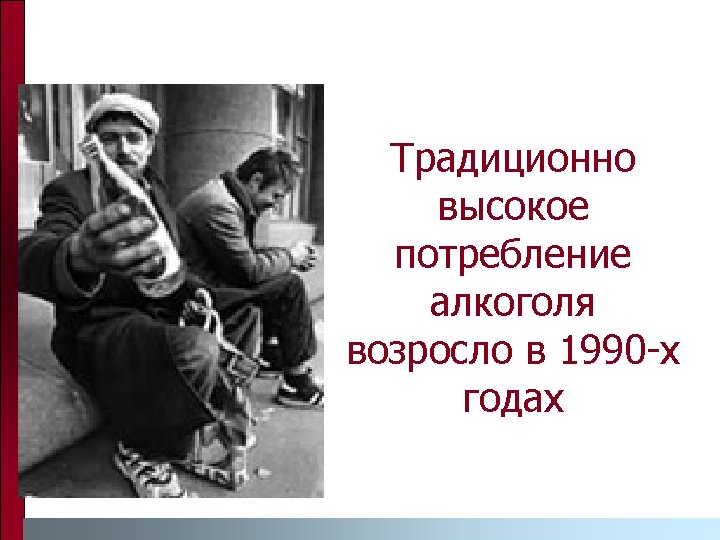
Снижение качества алкоголя во время рыночных реформ n n In 1992 state monopoly on alcohol sales was abolished Self-production of alcohol became not profitable but over 20% of alcohol sales included technical alcohol Sample control tests showed that proportion of below quality standards alcohol was 5. 6% in 1992 and 30. 4% in 1994 Imported alcohol had even lower quality: 67. 2% below quality standards

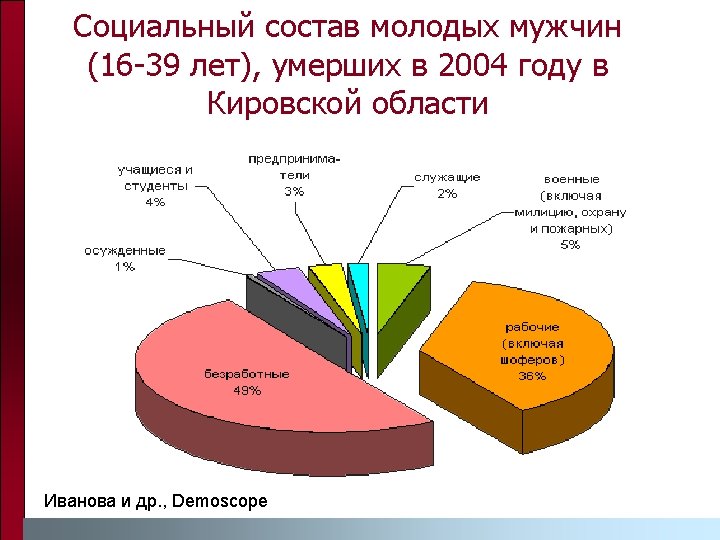
Суррогаты алкоголя n n n Alcohol surrogates – non-food liquids containing ethanol (polishing liquids, perfume, pharmaceutical tinctures, etc. ) Alcohol surrogates are cheap, so they are attractive to poor persons. May be the only source of ethanol for impoverished persons. 47% of men who used surrogates were unemployed. Only 13% of men not used surrogates were unemployed


 from accidental")
Флуктуации смертности, связанной с алкоголем Age-standardized mortality of men (per 100, 000) from accidental poisoning by alcohol


Age Profile of Suicide Mortality in Russia: 1981 -2001 Males Females


Ethnic Differentials in Mortality

Based on the Study of Ethnic Differentials in Adult Mortality in Kyrgyzstan Michel Guillot (PI), University of Wisconsin-Madison Natalia Gavrilova, University of Chicago Tetyana Pudrovska, University of Wisconsin-Madison Demography, 2011, 48(3): 1081 -1104
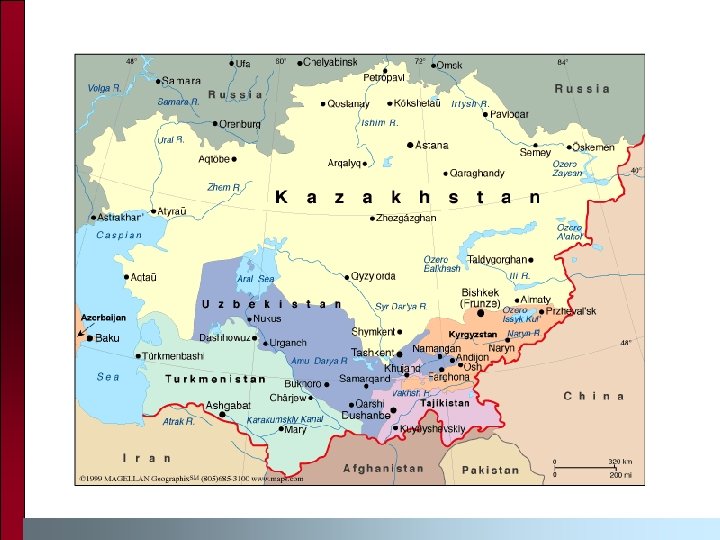

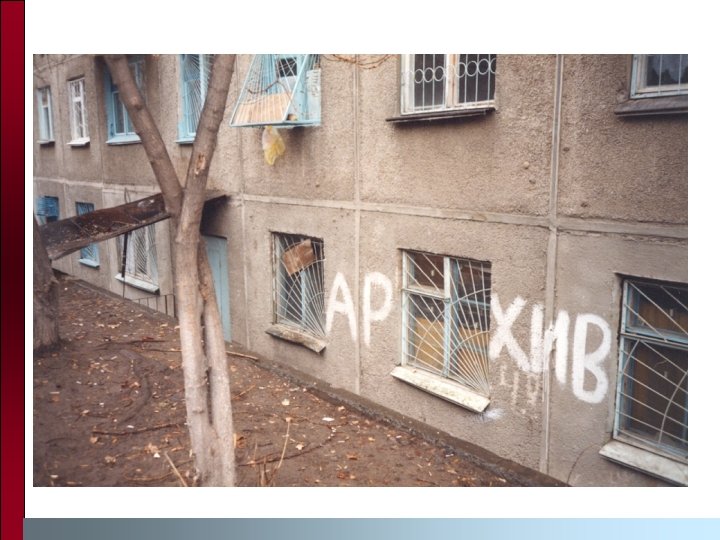
Background on Kyrgyzstan n n Former Soviet republic; became independent in 1991 Population: 5. 2 million (2006) Experienced a severe economic depression after break-up of Soviet Union GNI per capita = 440 USD; 28 th poorest country in the world (2005) 48% of population below national poverty line (2001)

2008 Workshop, Bishkek

Ethnic Groups in Kyrgyzstan n Native Central Asian groups: Kazakh, Kyrgyz, Tajik, Turkmen, Uzbek (Sunni Muslims) Slavs: Russian, Ukrainian, Bielorussian Kyrgyzstan, 1999 census: Central Asians: 79% of pop. (Kyrgyz 65%) n Slavs: 14% of pop. (Russian 12%) n
")
Recorded trends in adult mortality (20 -60 years)

Mortality paradox? n Soviet period: Russians/Slavs occupied dominant positions in the socio-economic structure of Central Asian societies (Kahn 1993)

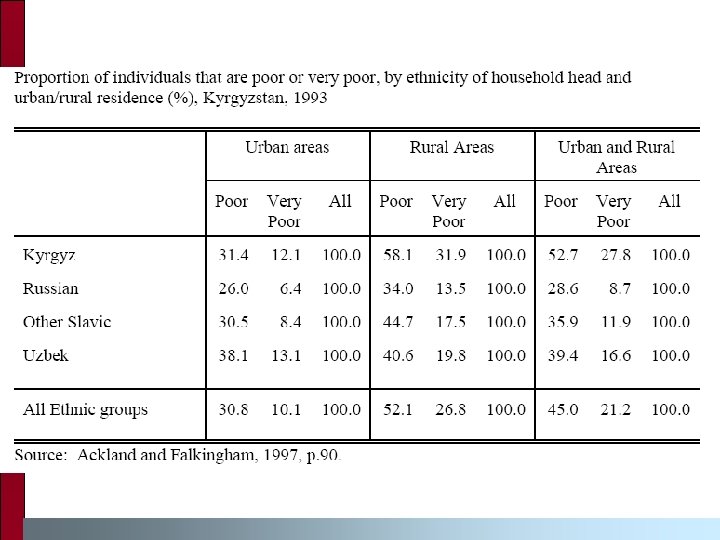
Mortality paradox? n n Slavic females more educated than Central Asian females (1989 and 1999 censuses) Slavic males: educational advantage not so clear – varies by age (1989 and 1999 censuses) Slavic households less poor than Central Asians (1993 World Bank poverty survey) Infant mortality lower among Slavs (Soviet and post-Soviet period)

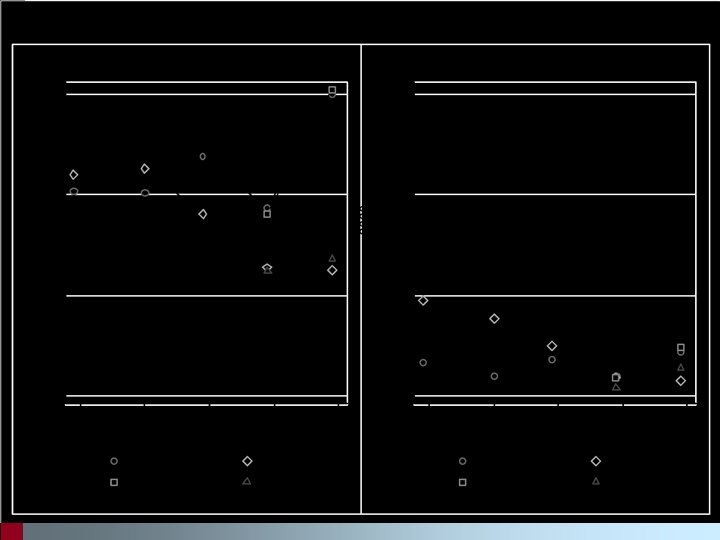
Proportion of individuals with post-secondary education, by age and ethnicity, in 1989 census. Females

Mortality paradox? n n Slavic females more educated than Central Asian females (1989 and 1999 censuses) Slavic males: educational advantage not so clear – varies by age (1989 and 1999 censuses) Slavic households less poor than Central Asians (1993 World Bank poverty survey) Infant mortality lower among Slavs (Soviet and post-Soviet period)

Proportion of individuals with post-secondary education, by age and ethnicity, in 1989 census. Males.

Mortality paradox? n n Slavic females more educated than Central Asian females (1989 and 1999 censuses) Slavic males: educational advantage not so clear – varies by age (1989 and 1999 censuses) Slavic households less poor than Central Asians (1993 World Bank poverty survey) Infant mortality lower among Slavs (Soviet and post-Soviet period)

Mortality paradox? n n Slavic females more educated than Central Asian females (1989 and 1999 censuses) Slavic males: educational advantage not so clear – varies by age (1989 and 1999 censuses) Slavic households less poor than Central Asians (1993 World Bank poverty survey) Infant mortality lower among Slavs (Soviet and post-Soviet period)

IMR by ethnicity, 1958 -2003, Kyrgyzstan

Data n Unpublished population and death tabulations since 1959 n n n collected from local archives Individual census records – 1999 Individual death records – 1998 -1999 n obtained from national statistical office


Possible explanations for mortality paradox n n n Data artifacts Migration effects (esp. 1989 -99) Cultural effects

Data artifacts? n Could the lower recorded mortality among Central Asian adults be due to lower data quality among them (coverage of deaths, age misreporting)?

Migration effects? n n 1/3 of Russian population has left Kyrgyzstan since 1991 Could the increased disparity between Russian and Kyrgyz adult mortality be due to selective migration (healthy migrant effect)?

Cultural effects? n Culture may affect mortality in various ways: individual health and lifestyle behaviors (e. g. , diet, smoking, alcohol, use of preventive care) à family structure and social networks (denser social networks may produce lower stress levels and better health) à n Could different cultural practices among Slavs and Central Asians explain the observed mortality differentials?
:")
Data artifacts? n Intercensal estimates of death registration coverage above age 60 (Guillot, 2004): 90+ % as early as 1959 in urban areas n coverage in rural areas was low initially (~50%) but caught up with urban areas in 1980 s n Total population: 92% for 1989 -99 period n n Adult deaths (20 -59) usually better reported than deaths 60+

Health selection?

Cohort-specific changes in educational attainment, Males, 1989 -99

Cohort-specific changes in educational attainment, Females, 1989 -99

Cultural effects? n n Analysis of causes of death by ethnicity, 1998 -99 Calculations based on micro-data Deaths: vital registration (1998 -99) n Exposure: census (March 1999) n Ages 20 -59 n Ethnicity: Central Asians vs. Slavs n ~20, 000 death records; ~2. 2 million census records n
, 1998 -99, by cause and ethnicity,")
Age-standardized Death Rates at working ages (per 100000), 1998 -99, by cause and ethnicity, Males

Contribution of causes of death to the difference in life expectancy at working ages (40 e 20) between Slavs and Central Asians Males (total difference = 2. 90 years)
. Detailed Injuries, Males")
Age-standardized Death Rates at working ages (per 100, 000). Detailed Injuries, Males
, 1998 -99, by cause and")
Age-standardized Death Rates at working ages (per 100, 000), 1998 -99, by cause and ethnicity, Females

Contribution of causes of death to the difference in life expectancy at working ages (40 e 20) between Slavs and Central Asians Females (total difference =. 28 years)
 Detailed Injuries, Females")
Age-standardized Death Rates at working ages (per 100, 000) Detailed Injuries, Females

Alcohol-related Causes of Death (Chronic alcoholism, Alcohol psychoses, Alcohol cirrhosis of the liver, Accidental poisoning by alcohol) Age-standardized Death Rates at working ages (per 100, 000)

Multivariate analysis n n n n Do ethnic mortality differentials at adult ages remain once we account for differences in education and urban/rural residence? Negative binomial regression Dependent variable: deaths from all causes; deaths by major cause (7) Explanatory variables: exposure, dummy variables for age, ethnicity, urban/rural residence, education (3 cat. ) Males and Females analyzed separately Model 1: age, ethnicity Model 2: age, ethnicity, education, residence

Males, all causes of death

Risk Ratio Slavs/CA Males

Risk Ratio Slavs/CA Females NS NS
 is")
Conclusions n n n Excess mortality among adult Slavs (Soviet and post-Soviet period) is not likely due to data artifacts or migration effects Excess mortality due to important ethnic differences in cause-specific mortality – alcohol and suicide in particular Differences remain unexplained by education or residence

Conclusions n Role of cultural characteristics? Alcohol tied to cultural practices (“culture of alcohol” among Russians; Impact of Islam for Central Asians) n Denser social networks and stronger social support among Central Asian ethnic groups? n

Further developments Divergent paths for adult mortality in Russia and Central Asia: Evidence from Kyrgyzstan n By M. Guillot, N. S. Gavrilova and L. Torgashova n Presented at the annual meeting of the European Association for Population Studies (2011)

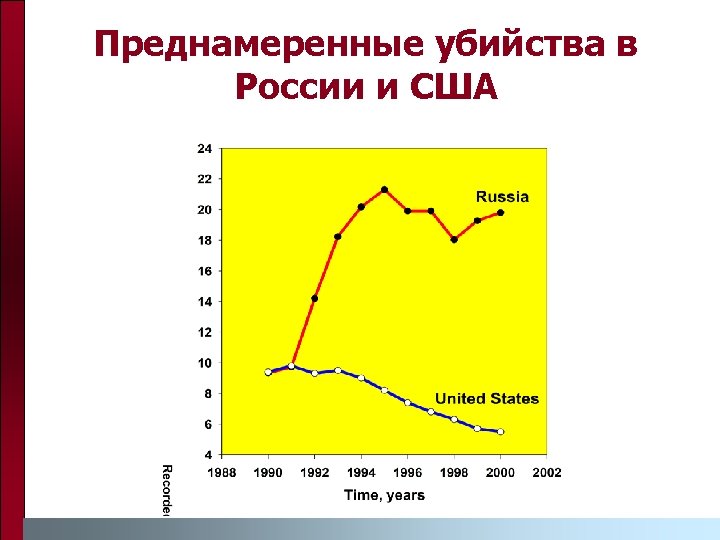
Age-standardized mortality rate, 40 M 20 Kyrgyzstan and Russia, 1981 -2006

Age-standardized mortality rate, 40 M 20 Kyrgyzstan and Russia, 1981 -2006

n n Study of autopsies in Barnaul during 1990 -2004 (Zaridze et al. , 2009) Among 5732 autopsied men aged 3569 years who were reported to have died from circulatory diseases 49% had alcohol detected in their blood and in 21% concentration of ethanol was 4 g/l and higher (lethal dose) Of 5880 autopsied men aged 35 -69 years who were reported to have died from injuries 76% had alcohol in their blood and in 38% concentration of ethanol was 4 g/l and higher

Codes used for the calculation of cause-specific mortality in Russia And Kyrgyzstan

Age-standardized mortality rate, 40 M 20 Kyrgyzstan, 1981 -2006, all causes and broad causes

Age-standardized mortality rate, 40 M 20 Kyrgyzstan, 1981 -2006, all causes and broad causes
 – 40 M 20 (Kyrgyzstan), 1989 -1999, all causes and")
40 M 20 (Russia) – 40 M 20 (Kyrgyzstan), 1989 -1999, all causes and strongly alcohol related causes
 – 40 M 20 (Kyrgyzstan), 1989 -1999, all causes and")
40 M 20 (Russia) – 40 M 20 (Kyrgyzstan), 1989 -1999, all causes and strongly alcohol related causes
 – 40 M 20 (Kyrgyzstan), 1979 -2009, all causes and")
40 M 20 (Russia) – 40 M 20 (Kyrgyzstan), 1979 -2009, all causes and strongly alcohol related causes

Framework for Understanding Health Crisis in Russia vs. Central Asia Russia Kyrgyzstan (Central Asia? ) Infant mortality Declined Stalled Adult mortality Large increase Moderate increase Explanatory framework Greater importance of of detrimental adult health care health behaviors deterioration

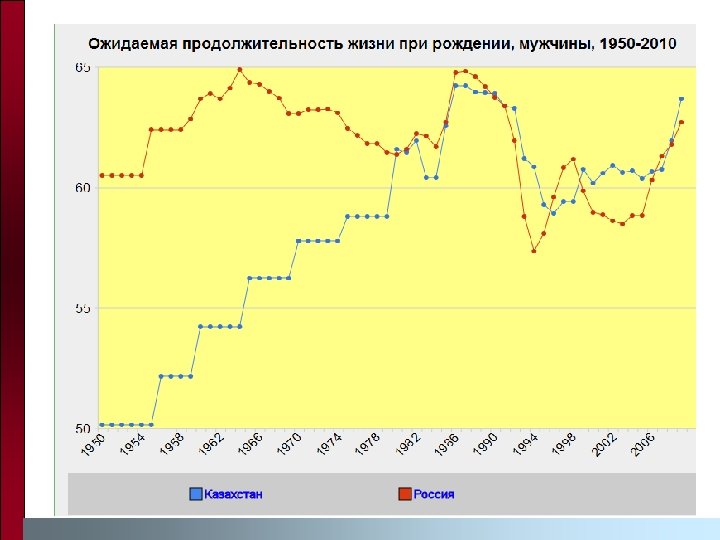
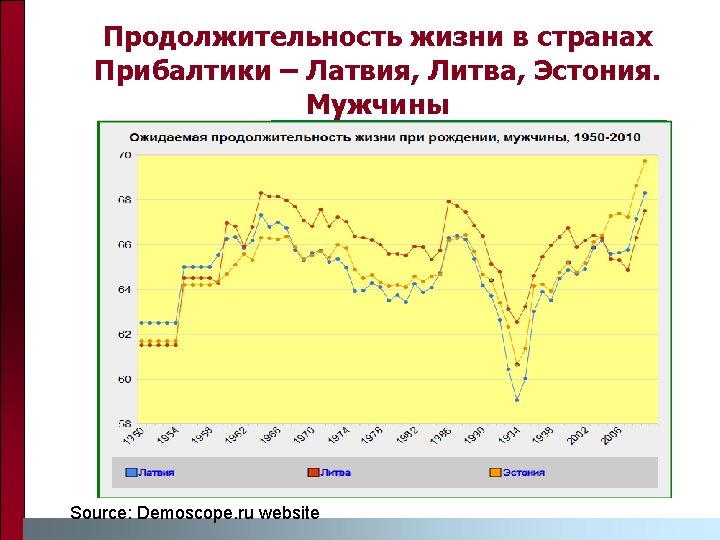
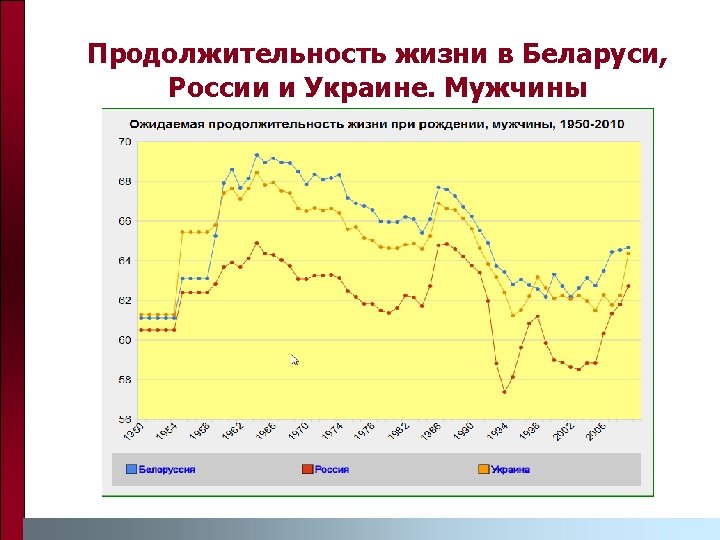
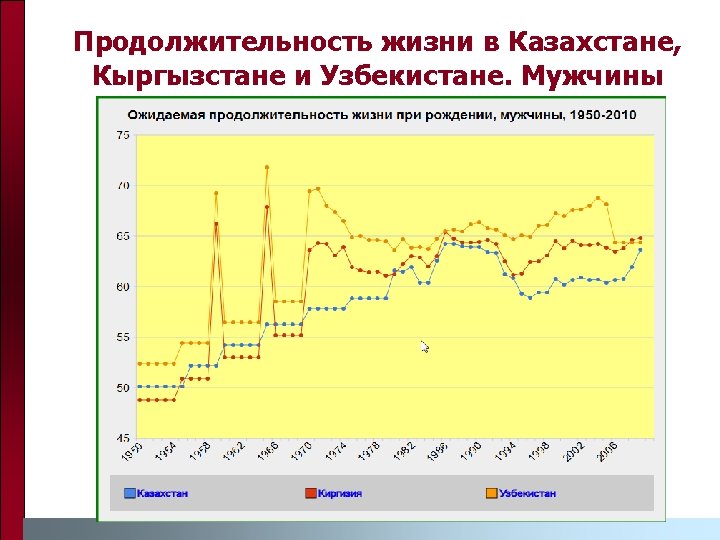
Trends in Life Expectancy: Men

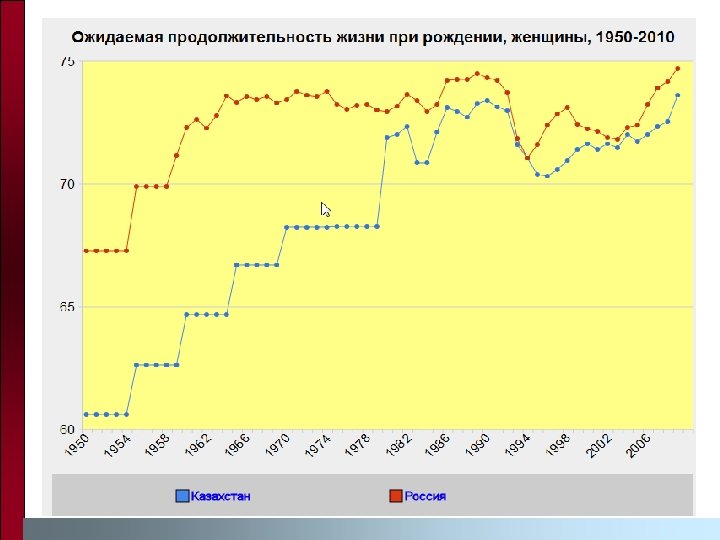
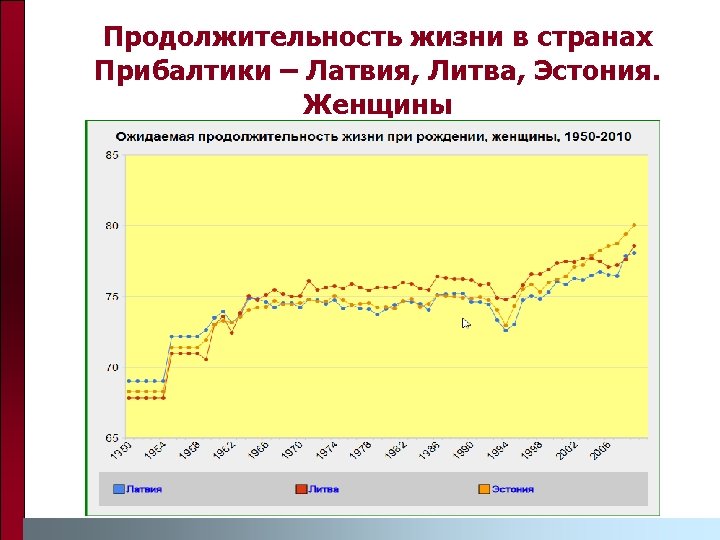
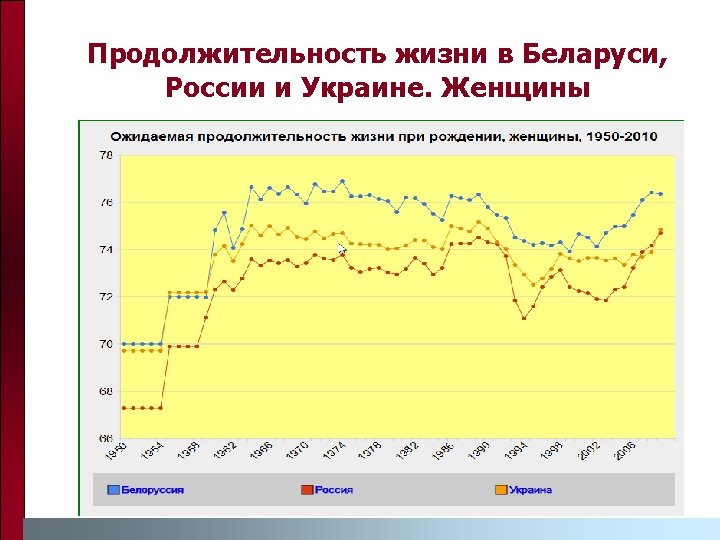
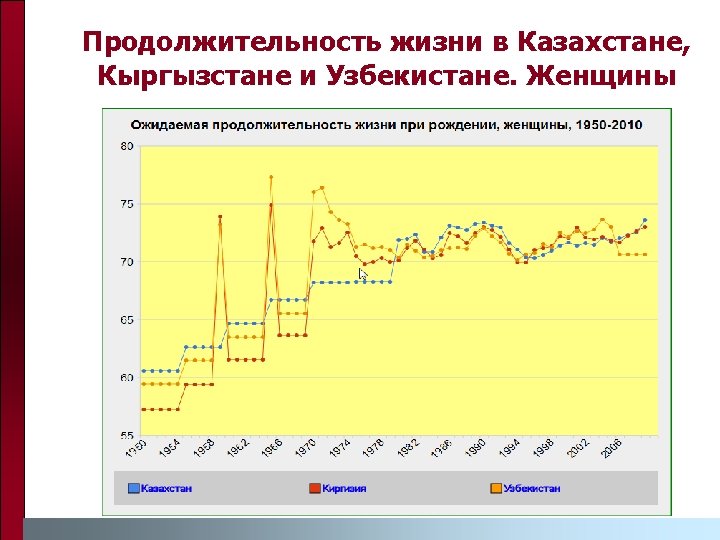
Trends in Life Expectancy: Women

Workshop in Almaty, Kazakhstan, July 2011 n Organized by the United Nations Population Fund (UNFPA) n Results of applying new methods to demographic estimation of mortality in Central Asian countries

Almaty is surrounded by mountains

Workshop in Almaty

‘Montmartre’ in Almaty

Acknowledgements n n n National Statistical Committee of the Kyrgyz Republic Zarylbek Kudabaev, Orozmat Abdykalykov, Liudmila Torgashova, Larissa Mimbaeva, Elena Komandirova and Mikhail Denisenko NICHD: R 03 HD 38752, R 01 HD 045531
- Slides: 168