
n o i t a i c o




- Slides: 62
n o i t a i c o s s A n i d a o L c i m e c Dietary Gly s m o t p m y S l a u r t s n e m e r P Done by: Mariam Hafiz Sahar Bin Afif Supervisrd by: Mariam Al-Hilou Eman AL-Omari Mariam AL-Helou Dr. Rania Hussien 1
Contents : • • • Introduction. Methodology. Results. Discussion. Conclusion. Acknowledgement. Mariam Al-Hilou 2
Introduction Mariam Al-Hilou 3
Premenstrual Syndrome (PMS) • A common cyclic disorder of young and middle-aged women. • Characterized by emotional and physical symptoms. • Occurs during the luteal phase of the menstrual cycle. Mariam Al-Hilou 4
premenstrual dysphoric disorder • Women with more severe affective symptoms are classified as having premenstrual dysphoric disorder. (PMDD) Mariam Al-Hilou 5
Common Symptoms of Premenstrual Syndrome • Behavioral symptoms. • Psychologic symptoms. • Physical symptoms. • The length of symptom expression varies between a few days and 2 weeks. Mariam Al-Hilou 6
The key criteria for a diagnosis of PMS 1 - Symptoms consistent with PMS. 2 - Consistent occurrence of symptoms only during the luteal phase of the menstrual cycle. 3 - Negative impact of symptoms on some facts of the woman’s life. 4 - Exclusion of other diagnoses that may better explain the symptoms. Mariam Al-Hilou 7
Etiology and Pathophysiology: • The etiology of PMS is multifactorial. • researchers suggest a variety of causes like: 1. 2. 3. 4. Altered regulation of neurohormones and neurotransmitters. Enhanced sensitivity to progesterone in women with underlying serotonin deficiency. Deficiencies in prostaglandins. Genetic factors and Others. Mariam Al-Hilou 8
Management: • Diagnosis is best achieved through daily rating symptoms over at least one menstrual cycle; by: - Ask patients to choose their worst symptoms and chart the severity daily. - Select a validated scale such as the Daily Record of Severity of Problems. Mariam Al-Hilou 9
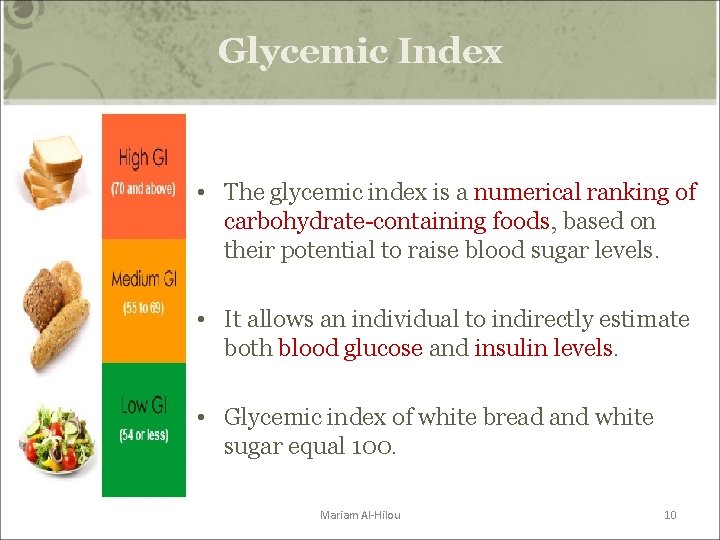
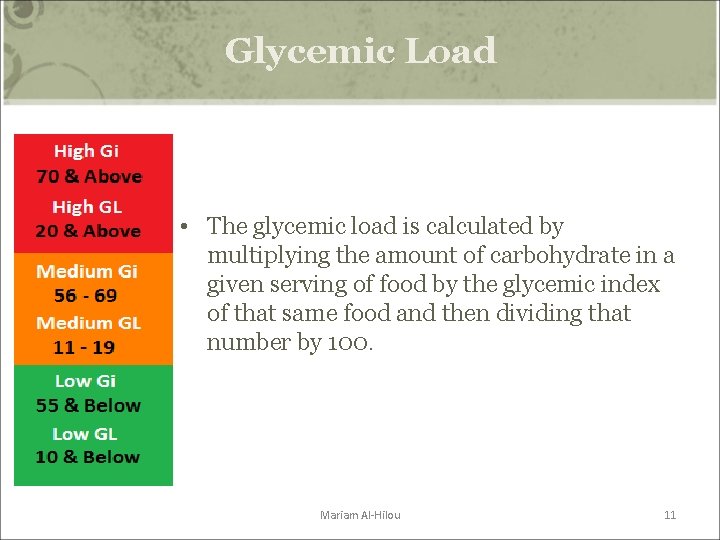
Glycemic Index • The glycemic index is a numerical ranking of carbohydrate-containing foods, based on their potential to raise blood sugar levels. • It allows an individual to indirectly estimate both blood glucose and insulin levels. • Glycemic index of white bread and white sugar equal 100. Mariam Al-Hilou 10
Glycemic Load • The glycemic load is calculated by multiplying the amount of carbohydrate in a given serving of food by the glycemic index of that same food and then dividing that number by 100. Mariam Al-Hilou 11
• Although books and magazine articles for the lay public have touted the benefit of restricting sugar and eating multiple small meals as management of PMS, there is little support for these strategies. • At the same time, studies of diets that ↑relative intake of carbohydrates suggest benefit, which might be due to an enhanced transport of tryptophan into the brain, leading to a transient increase in the synthesis of the serotonin. Mariam Al-Hilou 12
Subjects and Method Eman Al-Omari 13
Goal To study the relation between premenstrual syndrome and dietary glycemic load in adolescent girls, students at KAU, Jeddah. Eman Al-Omari 14
Objectives 1. To estimate the prevalence of premenstrual syndrome in adolescent girls in KAU. 2. To identify the difference in MDQ (menstrual distress questionnaire) total and subscale scores according to. DGL dietary glycemic load and DGI(dietary glycemic index) 3. To correlate between MDQ total and subscale scores and different dietary and non dietary variables. Eman Al-Omari 15
Methods Study design: Cross sectional study. Study setting: Faculty of Applied Medical Sciences, KAU, in Muharram 1432 Target population: adolescent girls , students at faculty of Applied Medical Sciences , KAU, Jeddah. Eman Al-Omari 16
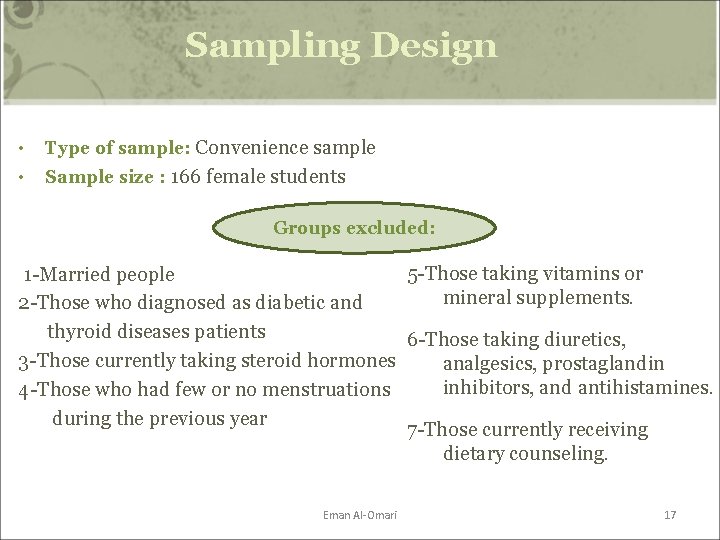
Sampling Design • Type of sample: Convenience sample • Sample size : 166 female students Groups excluded: 5 -Those taking vitamins or 1 -Married people mineral supplements. 2 -Those who diagnosed as diabetic and thyroid diseases patients 6 -Those taking diuretics, 3 -Those currently taking steroid hormones analgesics, prostaglandin inhibitors, and antihistamines. 4 -Those who had few or no menstruations during the previous year 7 -Those currently receiving dietary counseling. Eman Al-Omari 17
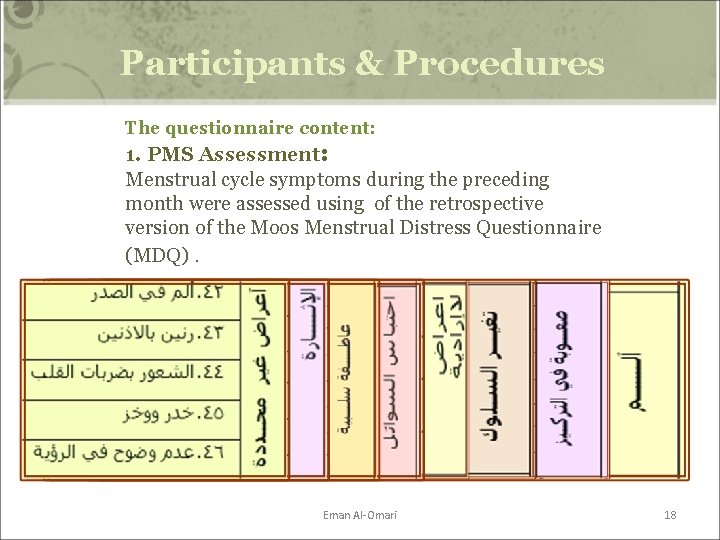
Participants & Procedures The questionnaire content: 1. PMS Assessment: Menstrual cycle symptoms during the preceding month were assessed using of the retrospective version of the Moos Menstrual Distress Questionnaire (MDQ). Eman Al-Omari 18
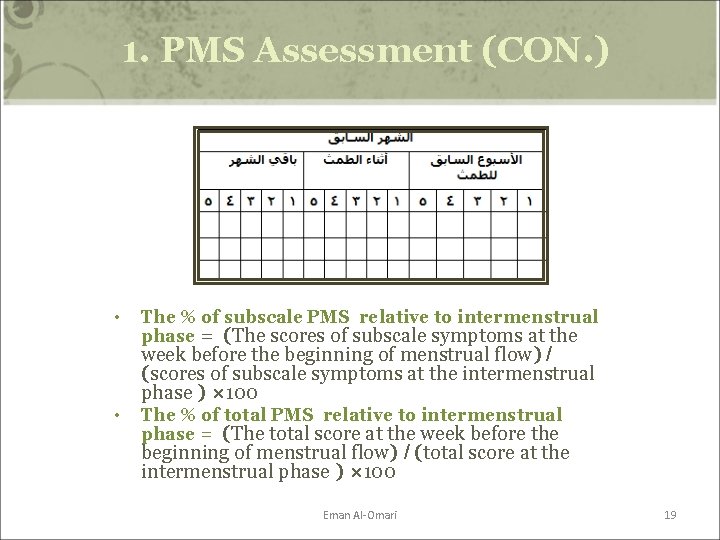
1. PMS Assessment (CON. ) • The % of subscale PMS relative to intermenstrual phase = (The scores of subscale symptoms at the week before the beginning of menstrual flow) / (scores of subscale symptoms at the intermenstrual phase ) × 100 • The % of total PMS relative to intermenstrual phase = (The total score at the week before the beginning of menstrual flow) / (total score at the intermenstrual phase ) × 100 Eman Al-Omari 19
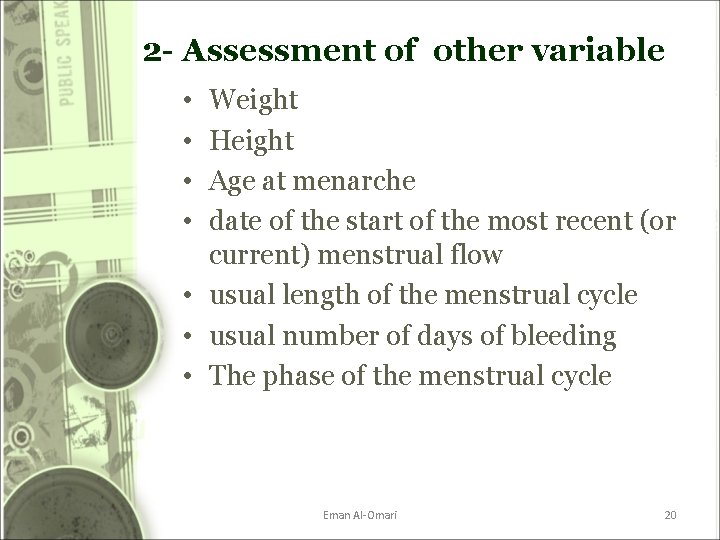
2 - Assessment of other variable • • Weight Height Age at menarche date of the start of the most recent (or current) menstrual flow • usual length of the menstrual cycle • usual number of days of bleeding • The phase of the menstrual cycle Eman Al-Omari 20
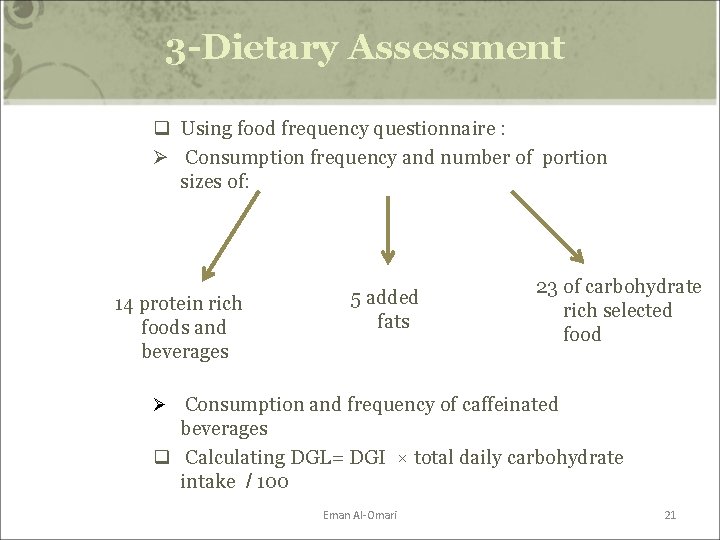
3 -Dietary Assessment q Using food frequency questionnaire : Ø Consumption frequency and number of portion sizes of: 14 protein rich foods and beverages 5 added fats 23 of carbohydrate rich selected food Ø Consumption and frequency of caffeinated beverages q Calculating DGL= DGI × total daily carbohydrate intake / 100 Eman Al-Omari 21
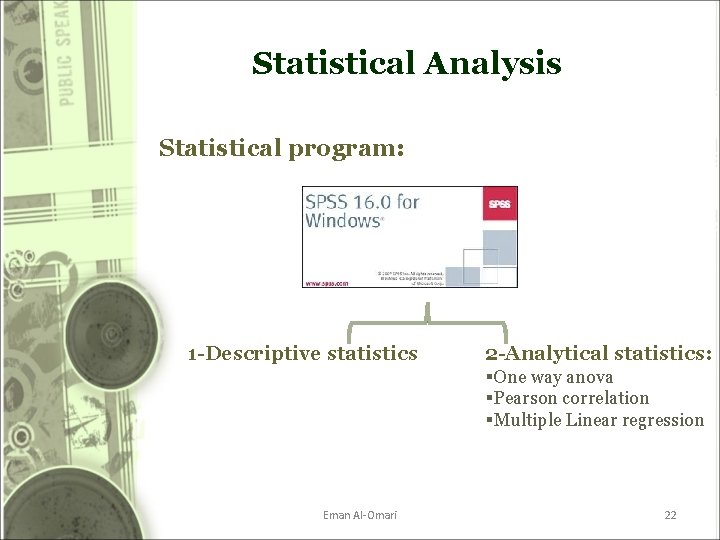
Statistical Analysis Statistical program: 1 -Descriptive statistics 2 -Analytical statistics: §One way anova §Pearson correlation §Multiple Linear regression Eman Al-Omari 22
Results Mariam Hafiz 23
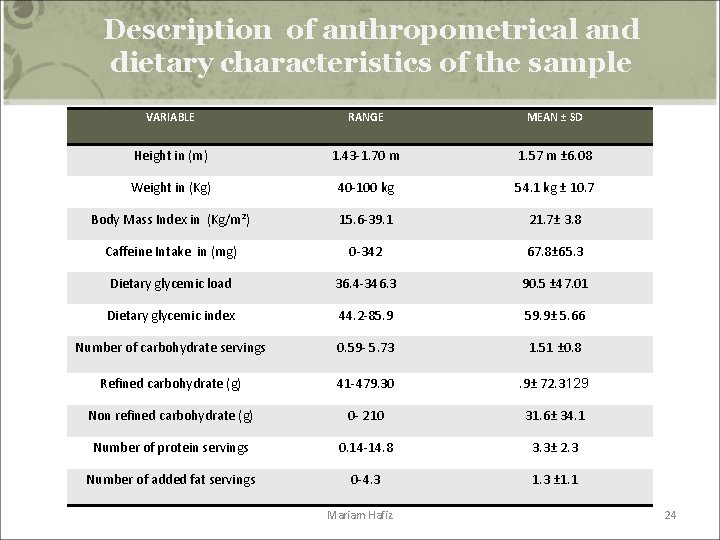
Description of anthropometrical and dietary characteristics of the sample VARIABLE RANGE MEAN ± SD Height in (m) 1. 43 -1. 70 m 1. 57 m ± 6. 08 Weight in (Kg) 40 -100 kg 54. 1 kg ± 10. 7 Body Mass Index in (Kg/m²) 15. 6 -39. 1 21. 7± 3. 8 Caffeine Intake in (mg) 0 -342 67. 8± 65. 3 Dietary glycemic load 36. 4 -346. 3 90. 5 ± 47. 01 Dietary glycemic index 44. 2 -85. 9 59. 9± 5. 66 Number of carbohydrate servings 0. 59 - 5. 73 1. 51 ± 0. 8 Refined carbohydrate (g) 41 -479. 30 . 9± 72. 3129 Non refined carbohydrate (g) 0 - 210 31. 6± 34. 1 Number of protein servings 0. 14 -14. 8 3. 3± 2. 3 Number of added fat servings 0 -4. 3 1. 3 ± 1. 1 Mariam Hafiz 24
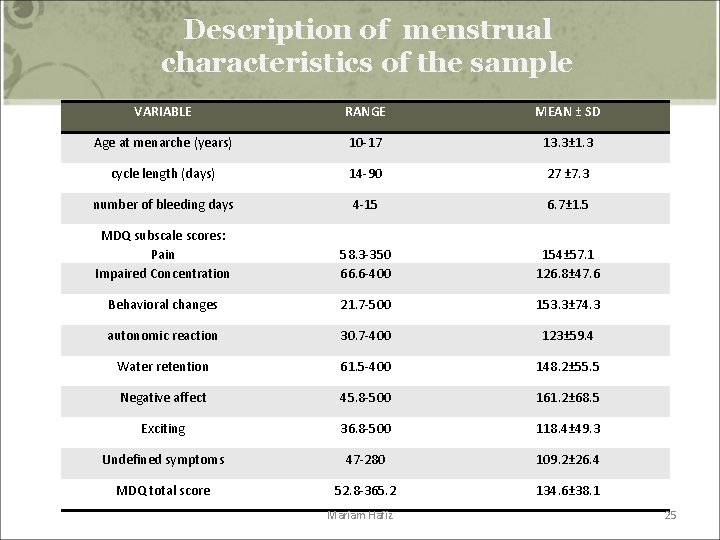
Description of menstrual characteristics of the sample VARIABLE RANGE MEAN ± SD Age at menarche (years) 10 -17 13. 3± 1. 3 cycle length (days) 14 -90 27 ± 7. 3 number of bleeding days 4 -15 6. 7± 1. 5 MDQ subscale scores: Pain Impaired Concentration 58. 3 -350 66. 6 -400 154± 57. 1 126. 8± 47. 6 Behavioral changes 21. 7 -500 153. 3± 74. 3 autonomic reaction 30. 7 -400 123± 59. 4 Water retention 61. 5 -400 148. 2± 55. 5 Negative affect 45. 8 -500 161. 2± 68. 5 Exciting 36. 8 -500 118. 4± 49. 3 Undefined symptoms 47 -280 109. 2± 26. 4 MDQ total score 52. 8 -365. 2 134. 6± 38. 1 Mariam Hafiz 25
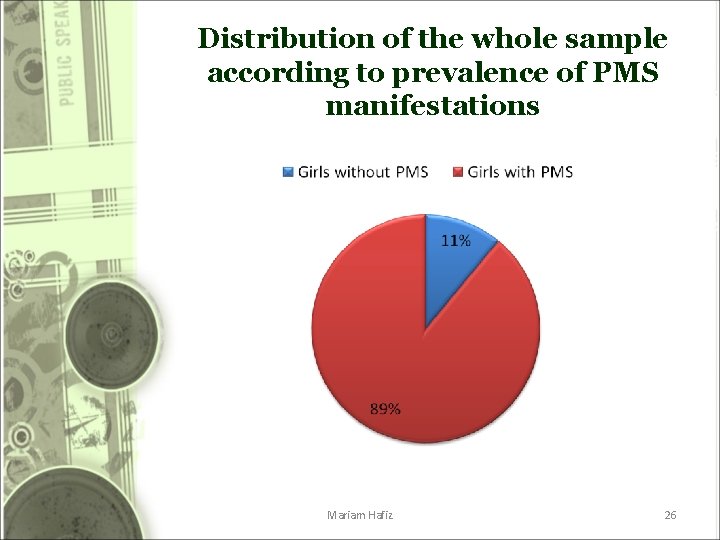
Distribution of the whole sample according to prevalence of PMS manifestations Mariam Hafiz 26
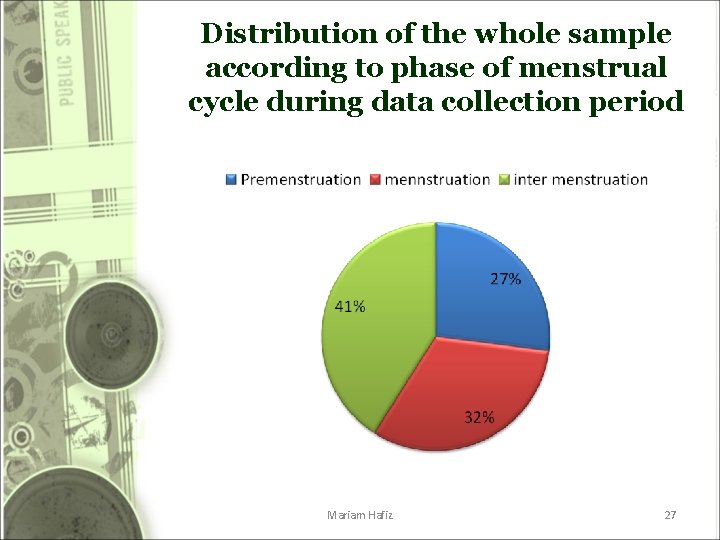
Distribution of the whole sample according to phase of menstrual cycle during data collection period Mariam Hafiz 27
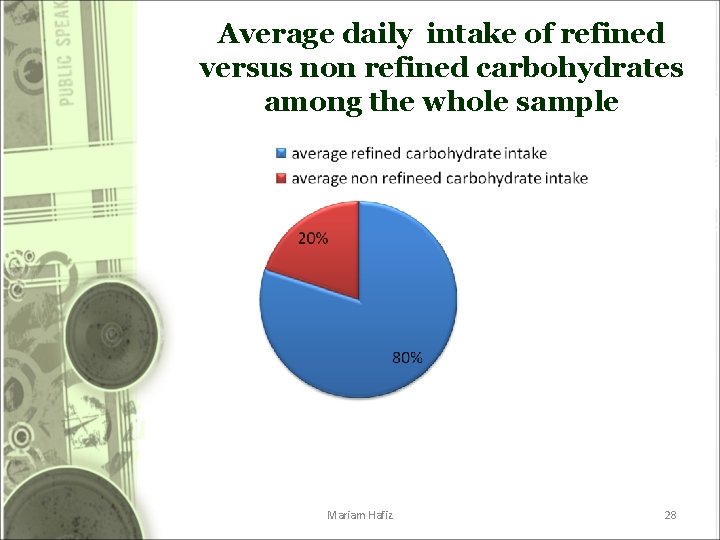
Average daily intake of refined versus non refined carbohydrates among the whole sample Mariam Hafiz 28
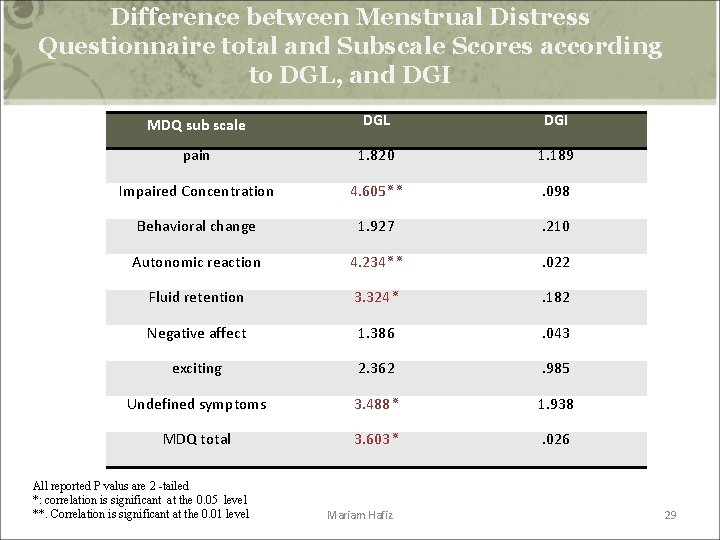
Difference between Menstrual Distress Questionnaire total and Subscale Scores according to DGL, and DGI MDQ sub scale DGL DGI pain 1. 820 1. 189 Impaired Concentration 4. 605 ٭٭ . 098 Behavioral change 1. 927 . 210 Autonomic reaction 4. 234 ٭٭ . 022 Fluid retention 3. 324 ٭ . 182 Negative affect 1. 386 . 043 exciting 2. 362 . 985 Undefined symptoms 3. 488 ٭ 1. 938 MDQ total 3. 603 ٭ . 026 All reported P valus are 2 -tailed *: correlation is significant at the 0. 05 level **. Correlation is significant at the 0. 01 level Mariam Hafiz 29
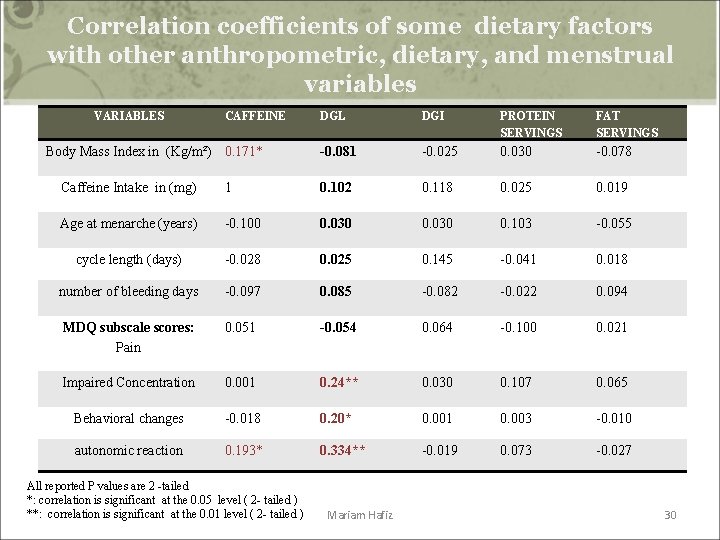
Correlation coefficients of some dietary factors with other anthropometric, dietary, and menstrual variables VARIABLES CAFFEINE Body Mass Index in (Kg/m²) 0. 171* DGL DGI PROTEIN SERVINGS FAT SERVINGS -0. 081 -0. 025 0. 030 -0. 078 Caffeine Intake in (mg) 1 0. 102 0. 118 0. 025 0. 019 Age at menarche (years) -0. 100 0. 030 0. 103 -0. 055 cycle length (days) -0. 028 0. 025 0. 145 -0. 041 0. 018 number of bleeding days -0. 097 0. 085 -0. 082 -0. 022 0. 094 MDQ subscale scores: Pain 0. 051 -0. 054 0. 064 -0. 100 0. 021 Impaired Concentration 0. 001 0. 24** 0. 030 0. 107 0. 065 Behavioral changes -0. 018 0. 20* 0. 001 0. 003 -0. 010 autonomic reaction 0. 193* 0. 334** -0. 019 0. 073 -0. 027 All reported P values are 2 -tailed *: correlation is significant at the 0. 05 level ( 2 - tailed ) **: correlation is significant at the 0. 01 level ( 2 - tailed ) Mariam Hafiz 30
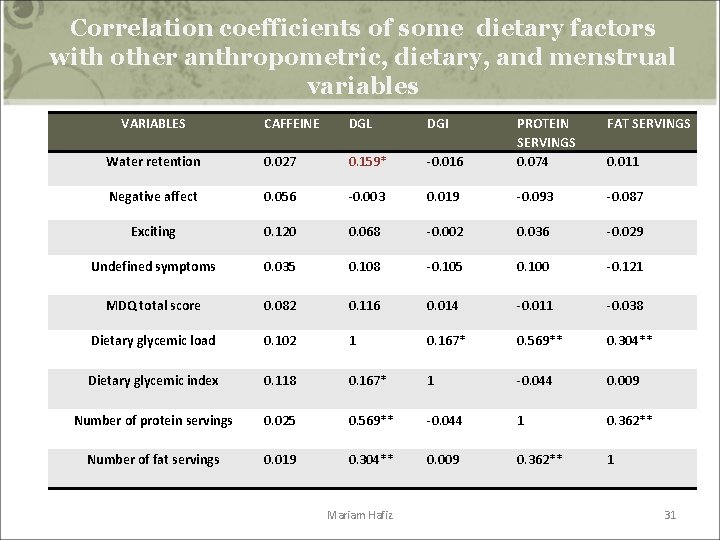
Correlation coefficients of some dietary factors with other anthropometric, dietary, and menstrual variables VARIABLES CAFFEINE DGL DGI FAT SERVINGS -0. 016 PROTEIN SERVINGS 0. 074 Water retention 0. 027 0. 159* Negative affect 0. 056 -0. 003 0. 019 -0. 093 -0. 087 Exciting 0. 120 0. 068 -0. 002 0. 036 -0. 029 Undefined symptoms 0. 035 0. 108 -0. 105 0. 100 -0. 121 MDQ total score 0. 082 0. 116 0. 014 -0. 011 -0. 038 Dietary glycemic load 0. 102 1 0. 167* 0. 569** 0. 304** Dietary glycemic index 0. 118 0. 167* 1 -0. 044 0. 009 Number of protein servings 0. 025 0. 569** -0. 044 1 0. 362** Number of fat servings 0. 019 0. 304** 0. 009 0. 362** 1 Mariam Hafiz 0. 011 31
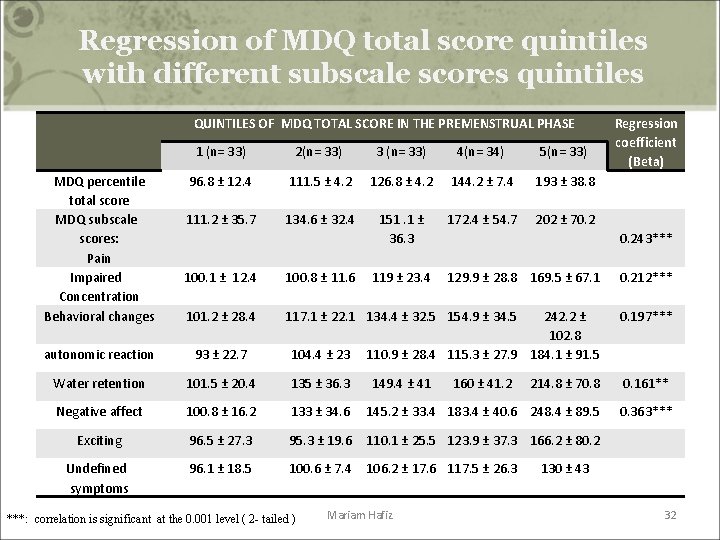
Regression of MDQ total score quintiles with different subscale scores quintiles QUINTILES OF MDQ TOTAL SCORE IN THE PREMENSTRUAL PHASE MDQ percentile total score MDQ subscale scores: Pain Impaired Concentration Behavioral changes 1 (n= 33) 2(n= 33) 3 (n= 33) 4(n= 34) 5(n= 33) 96. 8 ± 12. 4 111. 5 ± 4. 2 126. 8 ± 4. 2 144. 2 ± 7. 4 193 ± 38. 8 111. 2 ± 35. 7 134. 6 ± 32. 4 151. 1 ± 36. 3 172. 4 ± 54. 7 202 ± 70. 243*** 100. 1 ± 12. 4 100. 8 ± 11. 6 101. 2 ± 28. 4 117. 1 ± 22. 1 134. 4 ± 32. 5 154. 9 ± 34. 5 autonomic reaction 93 ± 22. 7 104. 4 ± 23 Water retention 101. 5 ± 20. 4 135 ± 36. 3 Negative affect 100. 8 ± 16. 2 Exciting Undefined symptoms 119 ± 23. 4 129. 9 ± 28. 8 169. 5 ± 67. 1 242. 2 ± 102. 8 110. 9 ± 28. 4 115. 3 ± 27. 9 184. 1 ± 91. 5 0. 197*** 0. 161** 133 ± 34. 6 145. 2 ± 33. 4 183. 4 ± 40. 6 248. 4 ± 89. 5 0. 363*** 96. 5 ± 27. 3 95. 3 ± 19. 6 110. 1 ± 25. 5 123. 9 ± 37. 3 166. 2 ± 80. 2 96. 1 ± 18. 5 100. 6 ± 7. 4 106. 2 ± 17. 6 117. 5 ± 26. 3 Mariam Hafiz 160 ± 41. 2 0. 212*** 214. 8 ± 70. 8 ***: correlation is significant at the 0. 001 level ( 2 - tailed ) 149. 4 ± 41 Regression coefficient (Beta) 130 ± 43 32
Discussion Mariam Hafiz 33
• In our study, age of girls ranged between 19 and 22 years, the prevalence of PMS among them was 89%. • This is consistent with Pray W S, Pray J J study, who found that approximately 40% to 90% of females report symptoms of PMS. Mariam Hafiz 34
• Our study revealed that negative affect had the highest score among PMS subscales , with a mean± SD equal to 161. 2± 68. 5. • In a study of adolescent girls, researchers discovered that the most common manifestation of PMS was negative affect Mariam Hafiz 35
• Excitement scored very low (mean± SD= 118. 4± 49. 3) , moreover showed an absent correlation with any of dietary variables (caffeine, DGL, DGI, protein, fat). • Parlee's study found the same observation on a small group of women. Mariam Hafiz 36
• The etiology of PMS is a result of an interaction between sex steroids and central neurotransmitters. • The levels of sex steroids, estrogen, progesterone, and testosterone are normal Mariam Hafiz 37
Serotonergic dysregulation with reduced serotonergic function in the luteal phase is the most plausible theory 1. carbohydrate ingestion → ↑tryptophan→↑ serotonin → Mood improvement 2. carbohydrate cravers select carbohydraterich foods to self-medicate negative mood Mariam Hafiz 38
Dietary Habits of Saudi adolescent girls as regards carbohydrate intake Mariam Hafiz 39
• A study conducted on students in Abha revealed that diets of adolescent female students were rich in carbohydrates, and deficient in fiber • Similarly, in our study, refined sugars and carbohydrates constituted about 80 % of total carbohydrate intake of our sample. Mariam Hafiz 40
Refined sugars may have a harmful effect 1. Several Studies showed that PMS patients consume more refined sugar 2. consumption of refined sugar may deplete the body of its reserves of B vitamins → reduced glucose metabolism 3. Refined sugar triggers insulin release → hypoglycemia and sugar craving 4. Refined sugars lack fibers Mariam Hafiz 41
Effect of dietary fiber on estrogen metabolism 1. alter enterohepatic circulation of estrogen →↑fecal estrogen excretion 2. ↓estrogen bioavailability 3. Direct action on hypothalamic pituitary gonadal system Mariam Hafiz 42
Effect of dietary fiber on estrogen metabolism luteal administration of estrogen has been reported to aggravate PMS Mariam Hafiz 43
So it was logic to find a positive correlation between DGL (with 80% as refined sugars) and impaired concentration, behavioral changes, autonomic reactions , and Water retention Mariam Hafiz 44
• Five subscales were highly significant predictors of MDQ total score: negative affect, impaired concentration, pain, behavioral change, and fluid retention. • They could explain 71. 4 % of MDQ total score variation. Sahr Bin Afif 45
Our sample consumed a low fiber diet , still their DGI failed to predict any of total or subscale scores in PMS: explanation: 1. Person specific variables. . 2. Food specific variables. . 3. Heterogeneity of glycemic response among persons who are obese versus lean. 4. No universal recognized objective measure of carbohydrate quality. Sahr Bin Afif 46
Age at menarche • Age at menarche ranged between 10 and 17 years, with a mean of 13. 3± 1. 3 SD. This is consistent with a study done in Saudi Arabia which showed the mean as 13. 05 years. Sahr Bin Afif 47
Age at menarche • Age at menarche in our study showed a non significant negative association with PMS. – earlier menstruation →↑number of menstrual cycles → ↑ fluctuation of sex steroids. – responsibility at younger age → physical and psychological stress → PMS. Sahr Bin Afif 48
In our study, Caffeine intake showed a significant positive association with autonomic reactions: explanation: parasympathetic nerve activity is lower in the late luteal phase in women with PMS. 1. Caffeine is a CNS stimulant → ↑imbalance in the Sympathetic and parasympathetic divisions 2. Caffeine → ↓ blood flow to brain. Sahr Bin Afif 49
Caffeine Intake and PMS • caffeine effect was unclear on impaired concentration, behavioral changes, Negative affect, and exciting. • The explanation is that caffeine kinetics are nonlinear: Regarding psychomotor effects after caffeine intake: – ↓doses produce a favorable effect. – ↑doses produce unpleasant effect. Sahr Bin Afif 50
Caffeine Intake and BMI • Significant positive correlation was found between caffeine intake and BMI. • Obese and overweight girls might consume more coffee to control their body weight. Sahr Bin Afif 51
Strengths & Limitations Sahr Bin Afif 52
Strengths 1 - Adjustment of potentially confounding variables. 2 - providing a valuable insight from a prevention perspective. Sahr Bin Afif 53
Limitations 1 - The cross-sectional nature of the study did not permit assessment of causality due to uncertain temporal association. Sahr Bin Afif 54
Limitations (cont. ) 2 - Small sample size is not representative of the Saudi adolescent population as a whole. – However , It afforded sufficient statistical power to detect differences in PMS with DGL. Sahr Bin Afif 55
Limitations (cont. ) 3 - Subjectivity of the questions in the reference to the intensity of symptoms , and in self administered dietary assessment questionnaire. – However , the instrument was present for all the girls and thus be considered a nondifferential source of error. Sahr Bin Afif 56
Limitations (cont. ) 4 - we assessed premenstrual symptoms using a retrospective questionnaire (i. e. , MDQ) – providing an over estimation of symptom severity – rely on subjects’ memory of past menstrual-related symptoms. • However , The MDQ is the most widely recognized and used questionnaire. Sahr Bin Afif 57
Conclusion • In our study we found a significant positive association between DGL and several MDQ subscale scores, including impaired concentration, behavioral change, autonomic reactions, and fluid retention. • Caffeine intake correlated positively with autonomic reactions in the premenstrual phase. Eman Al-Omari 58
Conclusion The correlation between CHO quality with PMS total and subscale scores need more prospective studies to confirm whether nutrition treatment can be used for women with mild to moderate PMS. Eman Al-Omari 59
Acknowledgment • We praise and thank Allah, who help us and drove us to this scientific stage • We would like to express our deepest thanks and gratitude to our supervisor, Dr. Rania Hussein for supporting this project and for the special effort she exerted. Eman Al-Omari 60
References • • Moos RH. The development of a menstrual distress questionnaire. Psychosomatic medicine 1968; 30(6): 853 -67. Silva CM, Gigante DP, Minten GC. Premenstrual symptoms and syndrome according to age at menarche in a 1982 birth cohort in southern Brazil. Cadernos de saúde pública / Ministério da Saúde, Fundação Oswaldo Cruz, Escola Nacional de Saúde Pública 2008; 24(4): 835 -44. Neuhouser M L, Tinker LF, Thomson C , Caan B , Horn L V, Snetselaar L , et al. Development of a glycemic index database for food frequency questionnaires used in epidemiologic studies. The journal of nutrition 2006; 136(6): 1604 -9 Babay Z A, Addar M H , Shahid K , Meriki N. Age at menarche and the reproductive performance of Saudi women. Annals of saudi medicine 2004: 354 -6. Matsumoto T, Ushiroyama T, Kimura T, Hayashi T, Moritani T. Altered autonomic nervous system activity as a potential etiological factor of premenstrual syndrome and premenstrual dysphoric disorder. Biopsychosocial medicine 2007 1: 24 Kondo M, Hirano T, Okamura Y. Changes in autonomic nerve function during the normal menstrual cycle measured by the coefficient of variation of R-R intervals. Nippon Sanka Fujinka Gakkai Zasshi 1989; 41: 513 - 8. Nehlig A, Daval JL, Debry G. Caffeine and the central nervous system: mechanisms of action, biochemical, metabolic and psychostimulant effects. Brain research review 1992; 17(2): 13970 Eman Al-Omari 61
• • • Dickerson LM, Mazyck PJ , Hunter MH. Premenstrual syndrome. American Family Physician 2003 ; 67(8) : 1743 -52. Yonkers KA, O’Brien PM, Eriksson E. Premenstrual syndrome. Lancet 2008; 371: 1200– 10. Taylor D. Perimenstrual symptoms and syndromes: guidelines for symptoms management and self care. Obstetrics and gynecology 2005; 5(5): 228 -41. Freeman EW, Sondheimer SJ, Rickels K. Gonadotropin-releasing hormone agonist in the treatment of premenstrual symptoms with and without ongoing dysphoria: a controlled study. Psychopharmacology bulletin 1997; 33: 303 -9. Campbell B. Glycemic load versus glycemic index. National strength and conditioning association. Available at http: //www. nscalift. org/Hot. Topic/download/Glycemic%20 Load. pdf. Accessed 2/1/ 2011. Eman Al-Omari 62