
Myelodysplastic Syndromes Palak Desai MD MDS MDS comprises


- Slides: 88
Myelodysplastic Syndromes Palak Desai, MD
MDS • MDS comprises a group of malignant stem cell disorders characterized by ineffective blood cell production and variable risk of transformation to acute leukemia.
MDS Predisposition • Senescence • Heritable Germline Mutations and Syndromes • Genotoxic stress (secondary or treatment induced) • Antineoplastic Agents • Ionizing Radiation • Autologous SCT • Environmental/Occupational • Industrial chemicals • Tobacco • PNH • Aplastic Anemia
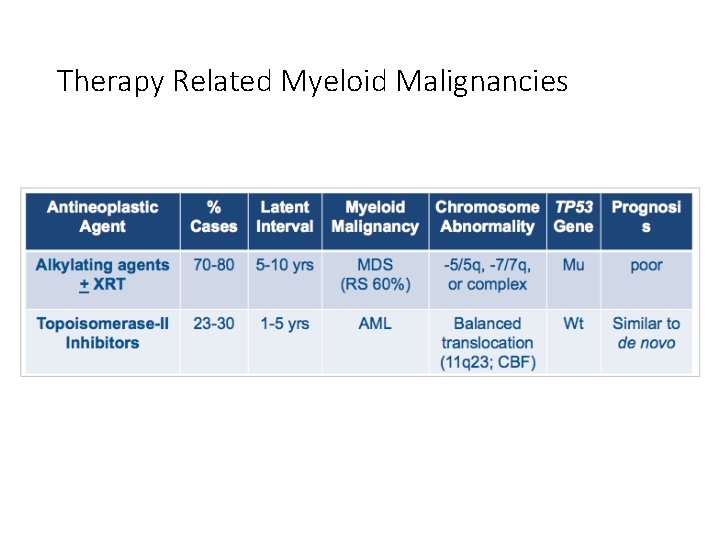
Therapy Related Myeloid Malignancies
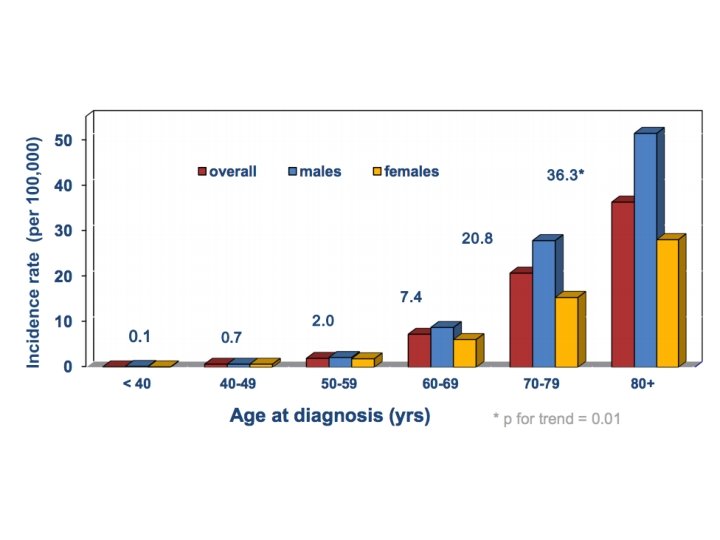
Epidemiology • Sex: A slight male predominance is noted in all age groups. • Age: MDS primarily affects elderly people, with the median onset in the seventh decade of life. • The median age of these patients is 65 years, with ages ranging from the early third decade of life to older than 80 years. • The syndrome may occur in persons of any age group, including the pediatric population.
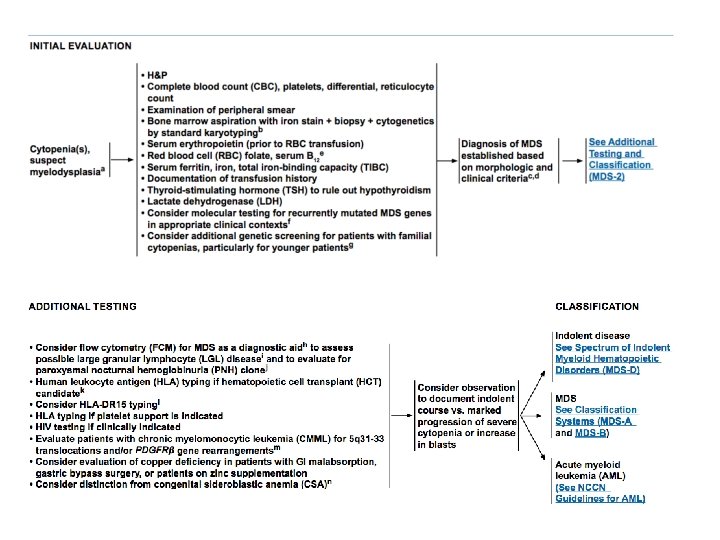
MDS diagnosis • Is based on morphological evidence of dysplasia upon visual examination of a bone marrow aspirate and biopsy • Information obtained from additional studies such as karyotype, flow cytometry, or molecular genetics is complementary but not diagnostic
MDS- diagnosis • Aplastic anaemia and some disease accompanied by marrow dysplasia, including wit. B 12 and/or folate deficiency, exposure to heavy metals, recent cytotoxic therapy and ongoing inflammation (including HIV and chronic liver disease/alcohol use) should be ruled out
MDS – clinical findings • These are non-specific, and are usually the consequences of cytopenias, including: - symptoms of anemia - infections due to neutropenia, but also to the frequently associated defect in neutrophil function - bleeding due to thrombocytopenia (may also occur in moderately thrombocytopenic patients or even in patients with normal platelets count, because of its abnormal function)
Characterization of MDS • Diagnosis • Morphologic Classification- FAB vs WHO • Prognostic Information- IPSS and Modifiers • Pathobiology • Gene mutations • Genotype/phenotype • Management • Low/Int-1 risk MDS • Int-2/High risk MDS • Treatment Algorithm
Dyserythropoiesis • Anemia • Normocytic or macro-ovalocytes • Low retic count • Megaloblastic changes • Ringed sideroblast • Basophilic stippling
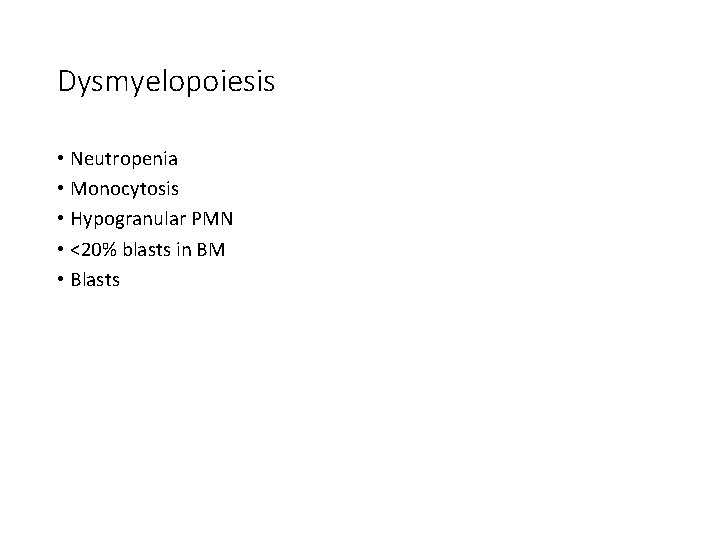
Dysmyelopoiesis • Neutropenia • Monocytosis • Hypogranular PMN • <20% blasts in BM • Blasts
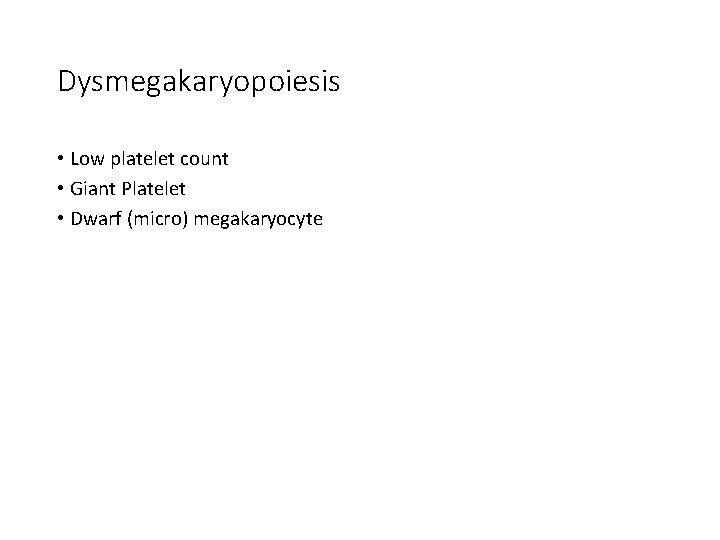
Dysmegakaryopoiesis • Low platelet count • Giant Platelet • Dwarf (micro) megakaryocyte
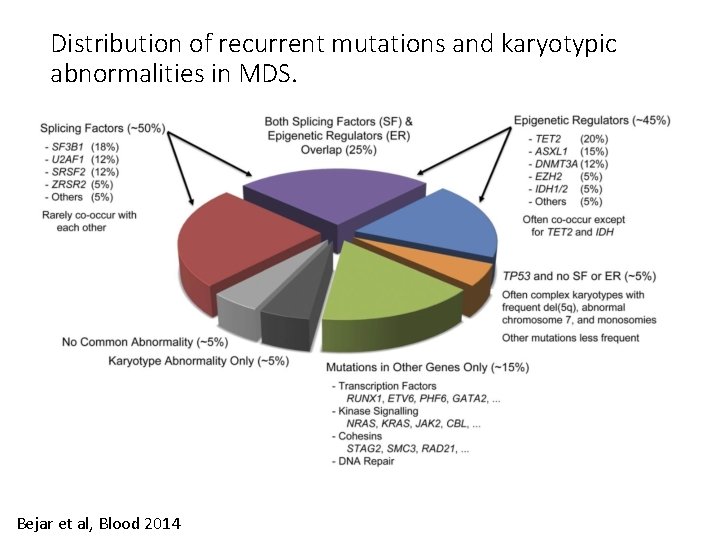
Distribution of recurrent mutations and karyotypic abnormalities in MDS. Bejar et al, Blood 2014
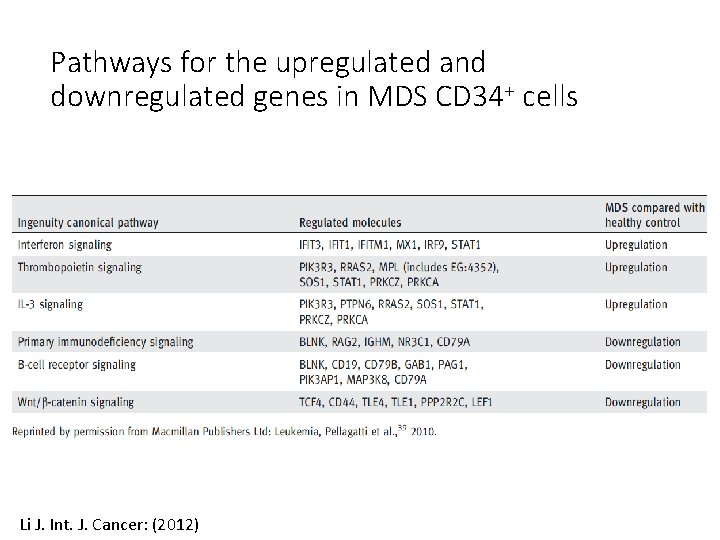
Pathways for the upregulated and downregulated genes in MDS CD 34+ cells Li J. Int. J. Cancer: (2012)
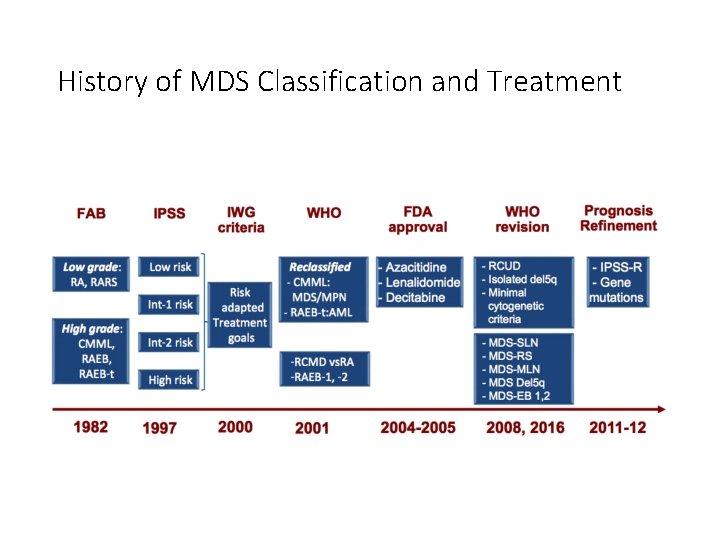
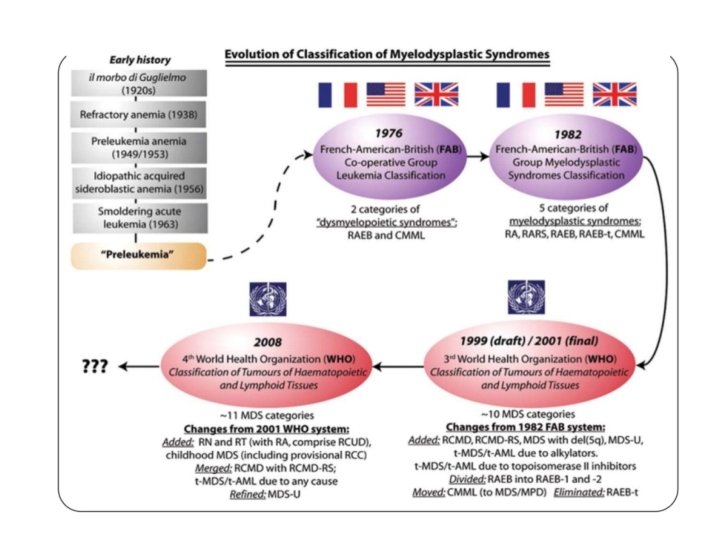
History of MDS Classification and Treatment
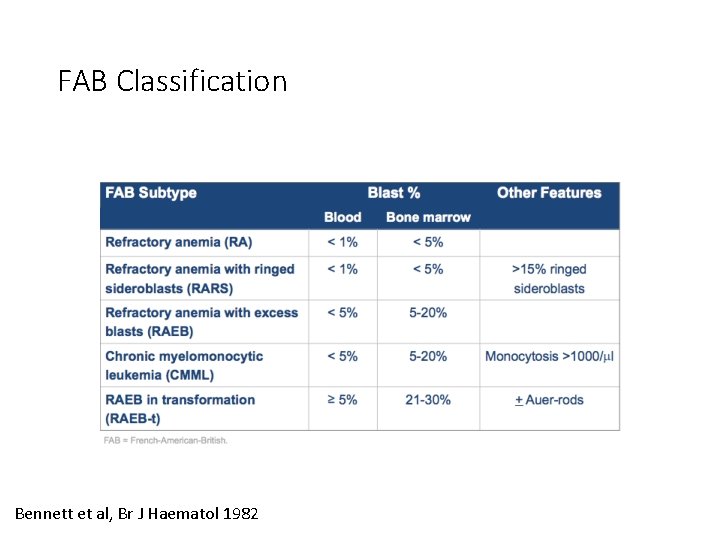
FAB Classification Bennett et al, Br J Haematol 1982
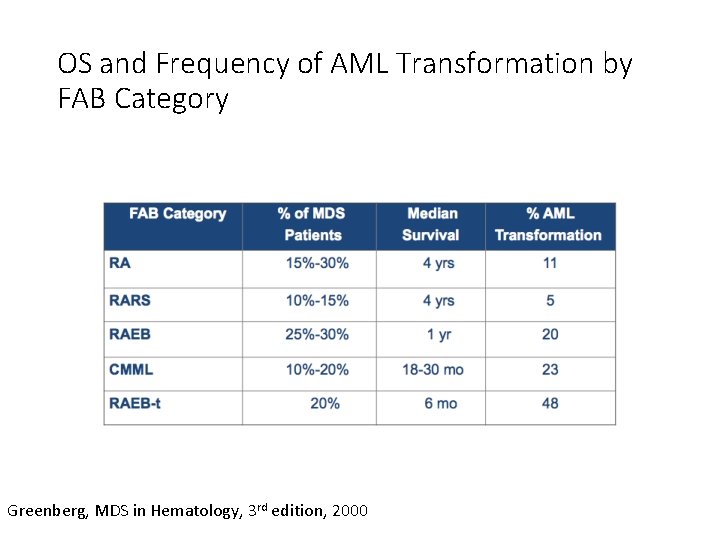
OS and Frequency of AML Transformation by FAB Category Greenberg, MDS in Hematology, 3 rd edition, 2000
Limitations of FAB Classification • Prognostic differences between refractory anemia (RA) with and without evident myelodysplastic features in other lineages. • Prognostic differences between RAEB according to whether the bone marrow percentage is 5 -10% or 10 -20% blasts • Patients categorized at RAEB-T on the basis of presence of Auer rods, but with BM blasts <20% were found to have better prognosis than those categorized as RAEB-T on basis of blast count in PS and BM • Patients with RAEB-T with more than 20% bone marrow blasts were increasingly regarded and treated as acute myeloid leukemia
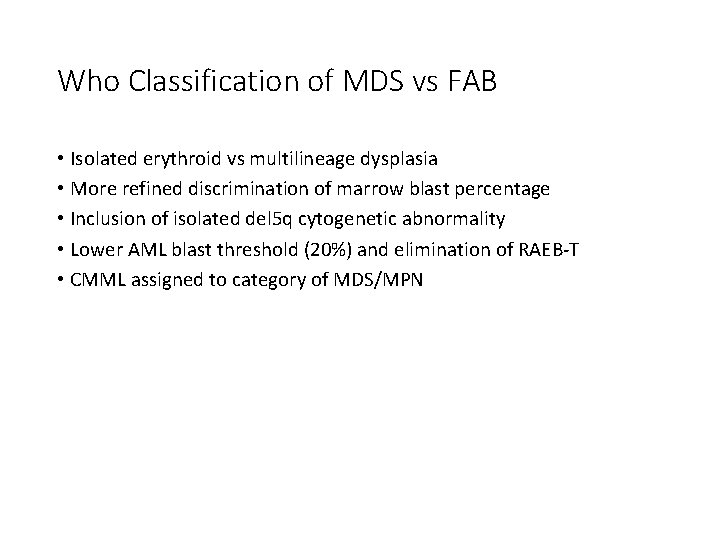
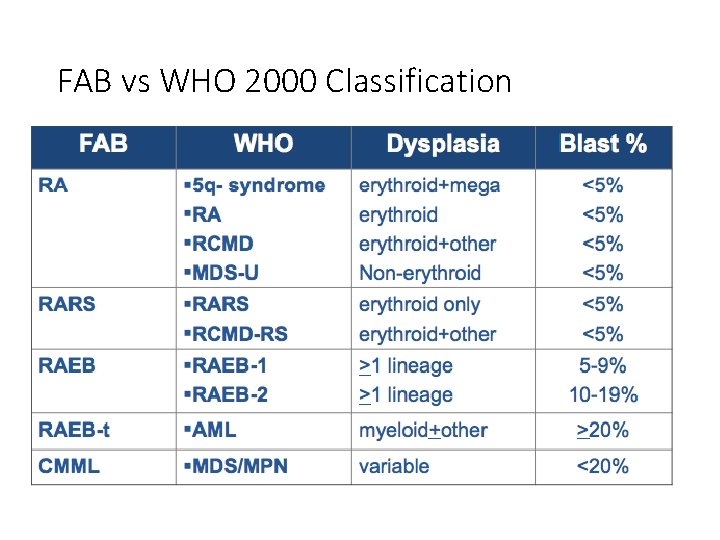
Who Classification of MDS vs FAB • Isolated erythroid vs multilineage dysplasia • More refined discrimination of marrow blast percentage • Inclusion of isolated del 5 q cytogenetic abnormality • Lower AML blast threshold (20%) and elimination of RAEB-T • CMML assigned to category of MDS/MPN
FAB vs WHO 2000 Classification
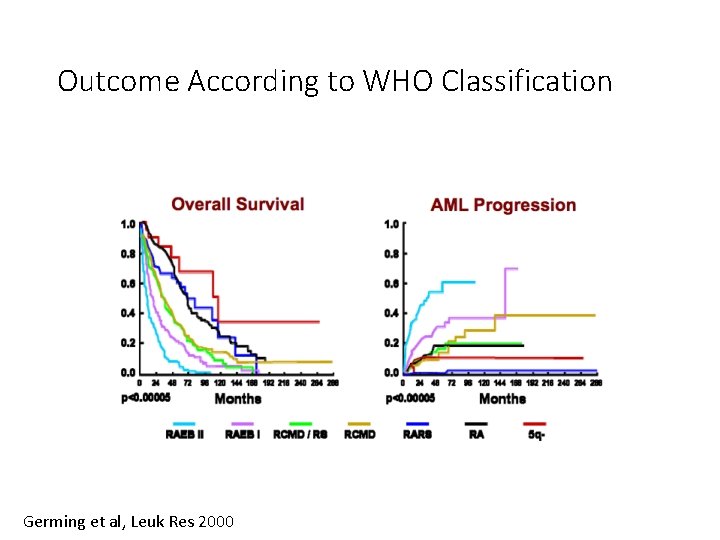
Outcome According to WHO Classification Germing et al, Leuk Res 2000
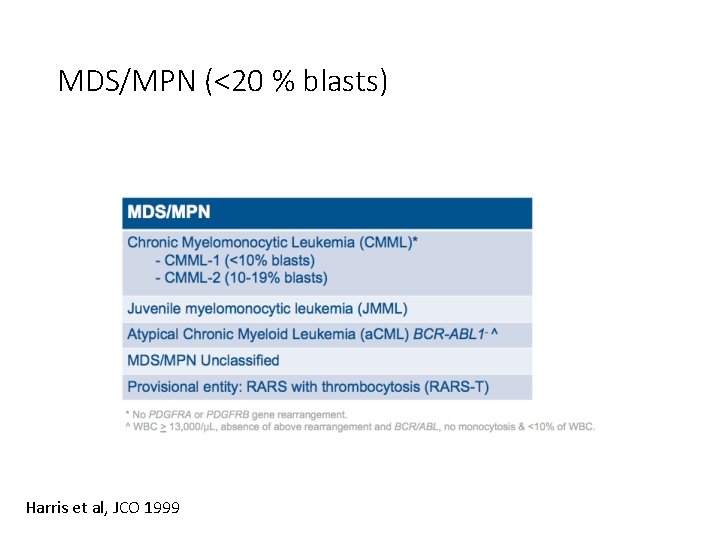
MDS/MPN (<20 % blasts) Harris et al, JCO 1999
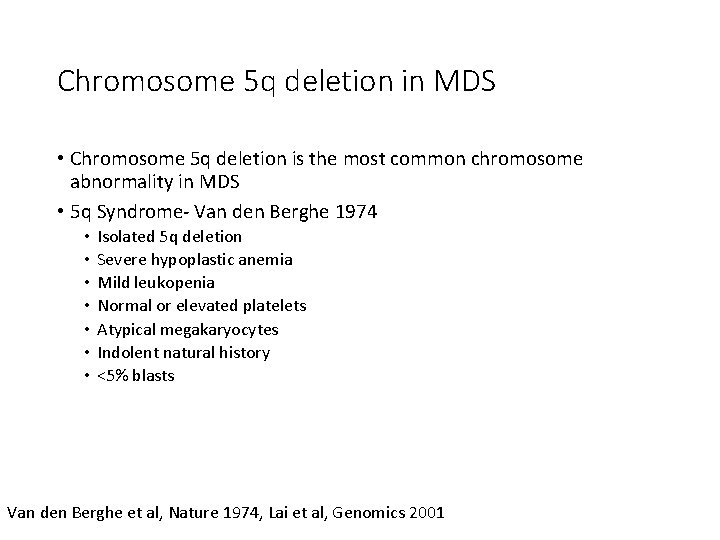
Chromosome 5 q deletion in MDS • Chromosome 5 q deletion is the most common chromosome abnormality in MDS • 5 q Syndrome- Van den Berghe 1974 • • Isolated 5 q deletion Severe hypoplastic anemia Mild leukopenia Normal or elevated platelets Atypical megakaryocytes Indolent natural history <5% blasts Van den Berghe et al, Nature 1974, Lai et al, Genomics 2001
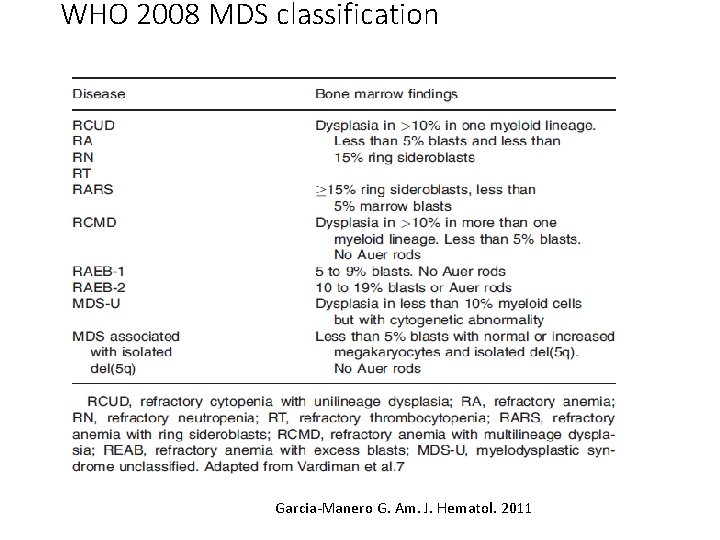
WHO 2008 MDS classification Garcia-Manero G. Am. J. Hematol. 2011
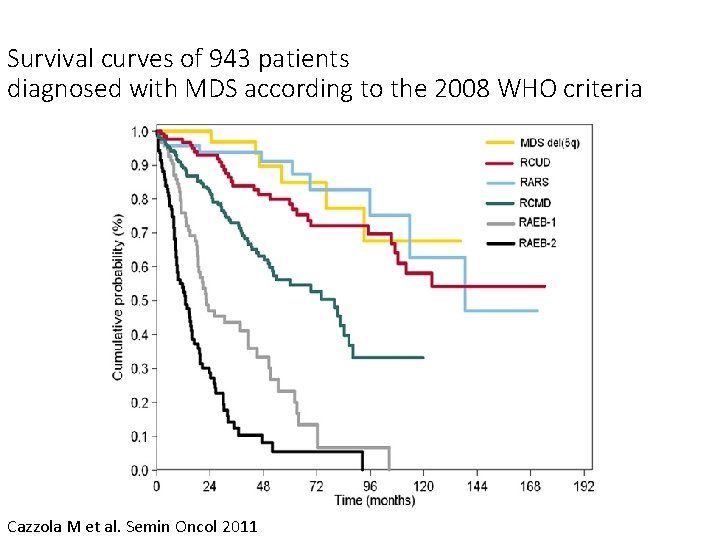
Survival curves of 943 patients diagnosed with MDS according to the 2008 WHO criteria Cazzola M et al. Semin Oncol 2011
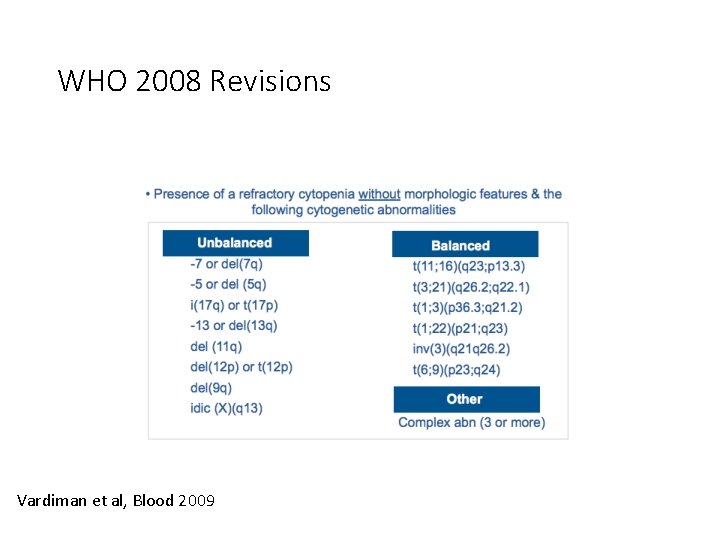
WHO 2008 Revisions Vardiman et al, Blood 2009
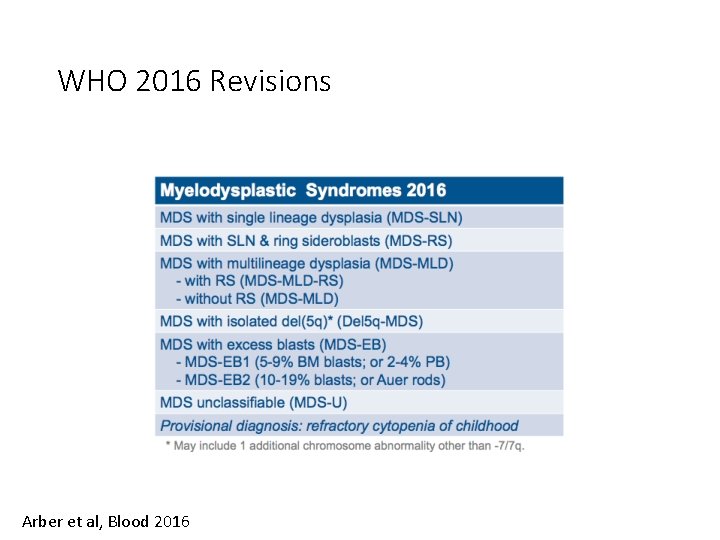
WHO 2016 Revisions Arber et al, Blood 2016
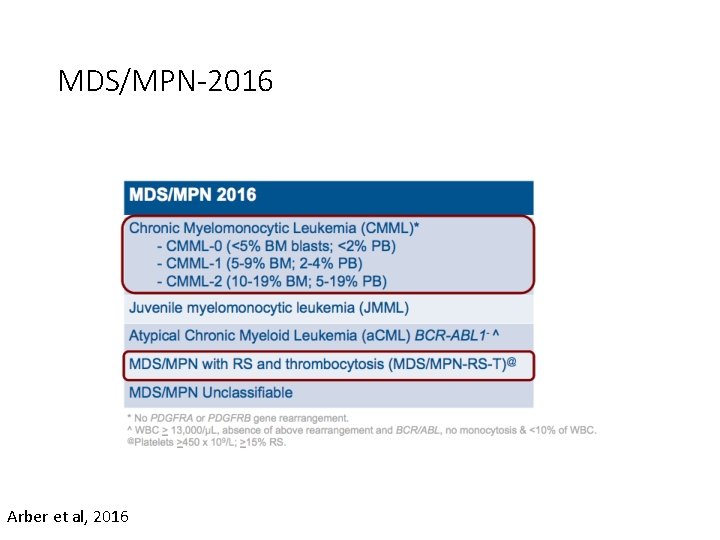
MDS/MPN-2016 Arber et al, 2016
Prognostic Models
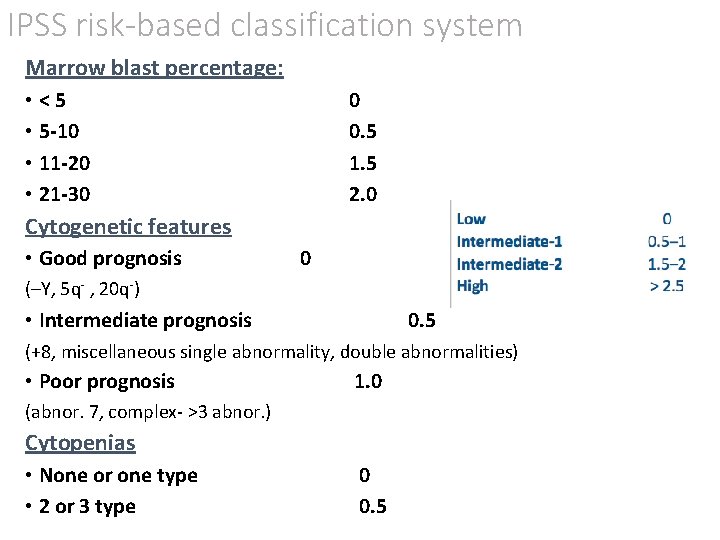
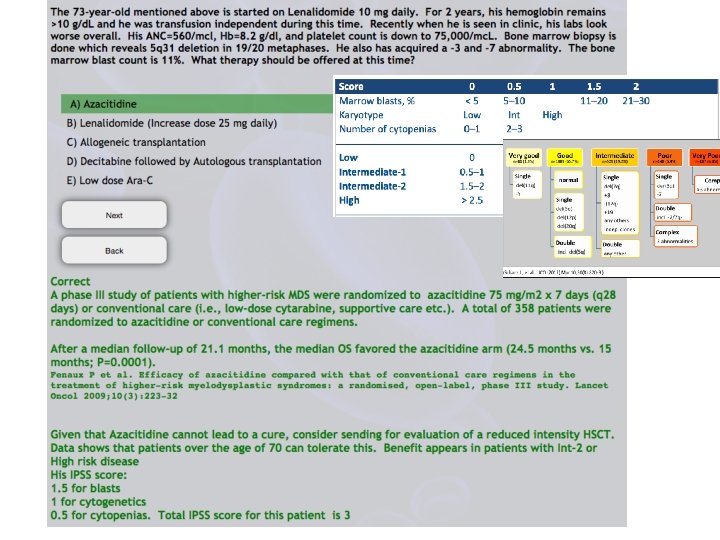
IPSS risk-based classification system Marrow blast percentage: • <5 • 5 -10 • 11 -20 • 21 -30 0 0. 5 1. 5 2. 0 Cytogenetic features • Good prognosis 0 (–Y, 5 q- , 20 q-) • Intermediate prognosis 0. 5 (+8, miscellaneous single abnormality, double abnormalities) • Poor prognosis 1. 0 (abnor. 7, complex- >3 abnor. ) Cytopenias • None or one type • 2 or 3 type 0 0. 5
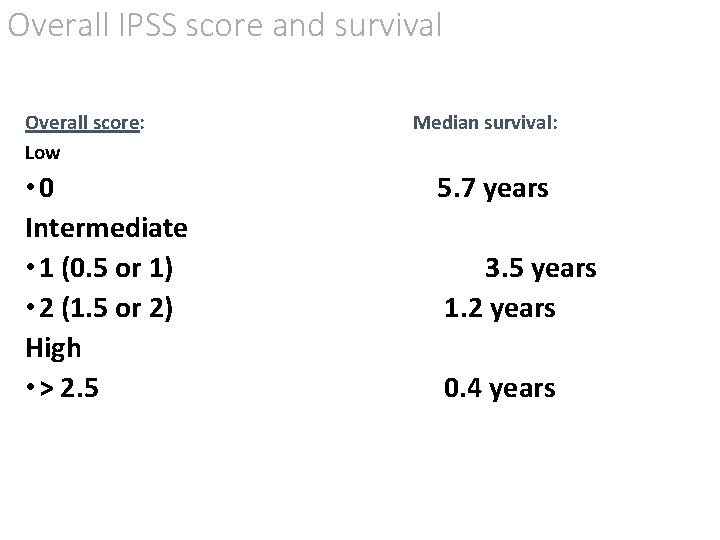
Overall IPSS score and survival Overall score: Low • 0 Intermediate • 1 (0. 5 or 1) • 2 (1. 5 or 2) High • > 2. 5 Median survival: 5. 7 years 3. 5 years 1. 2 years 0. 4 years
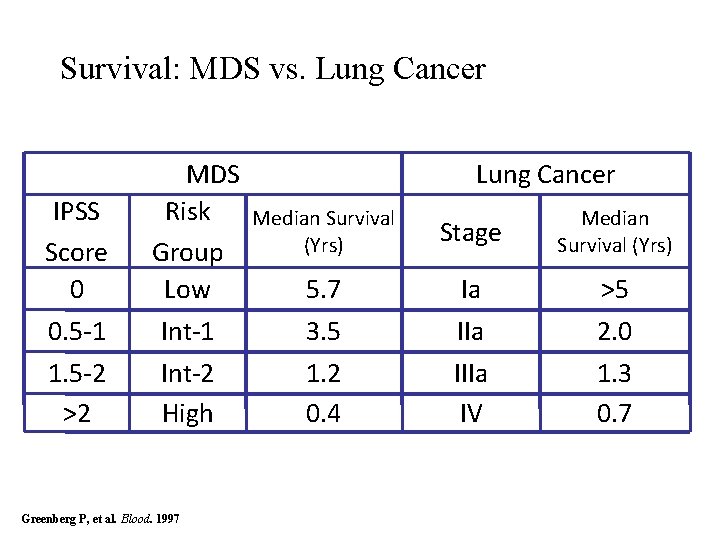
Survival: MDS vs. Lung Cancer IPSS Score 0 MDS Risk Group Low 0. 5 -1 1. 5 -2 >2 Int-1 Int-2 High Greenberg P, et al. Blood. 1997 Lung Cancer Median Survival (Yrs) Stage Median Survival (Yrs) 5. 7 Ia >5 3. 5 1. 2 0. 4 IIa IV 2. 0 1. 3 0. 7
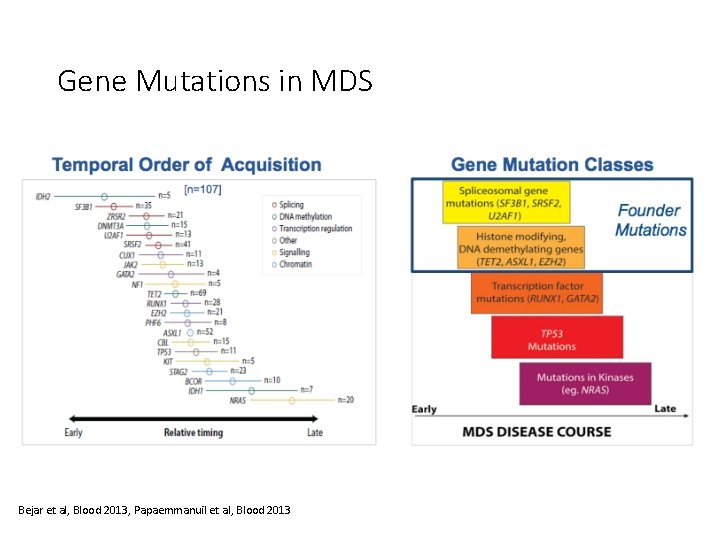
Gene Mutations in MDS Bejar et al, Blood 2013, Papaemmanuil et al, Blood 2013
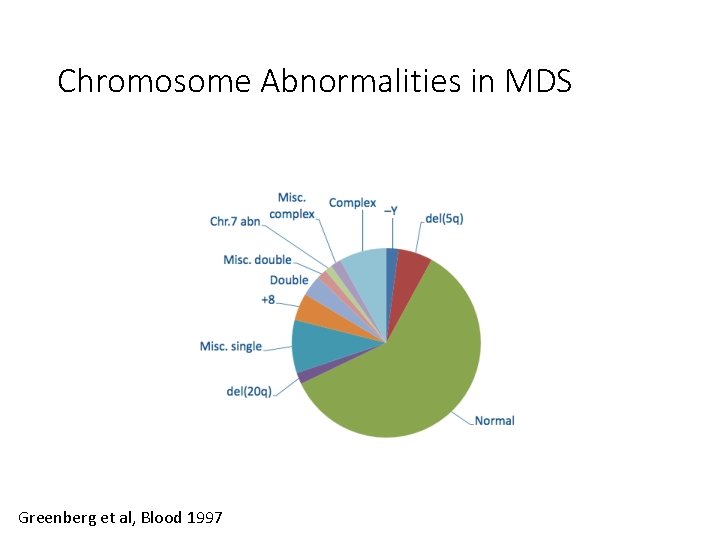
Chromosome Abnormalities in MDS Greenberg et al, Blood 1997
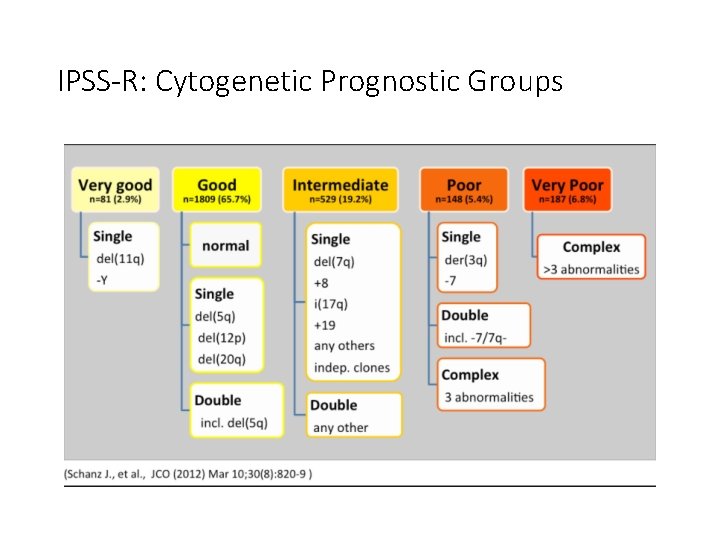
IPSS-R: Cytogenetic Prognostic Groups
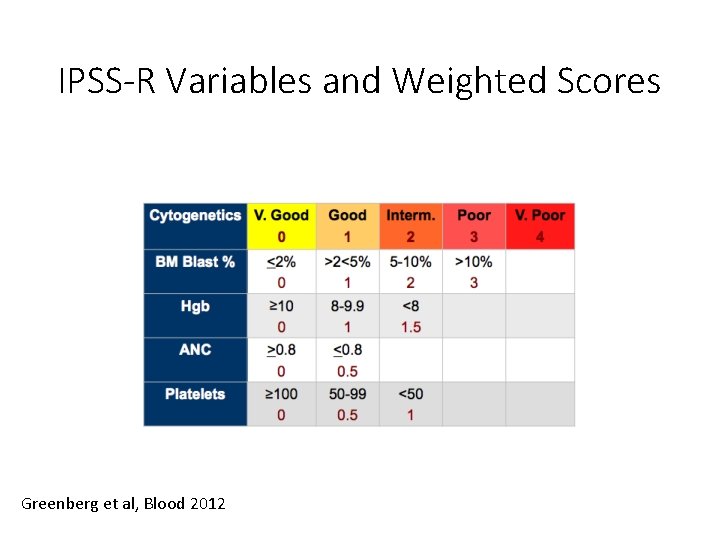
IPSS-R Variables and Weighted Scores Greenberg et al, Blood 2012
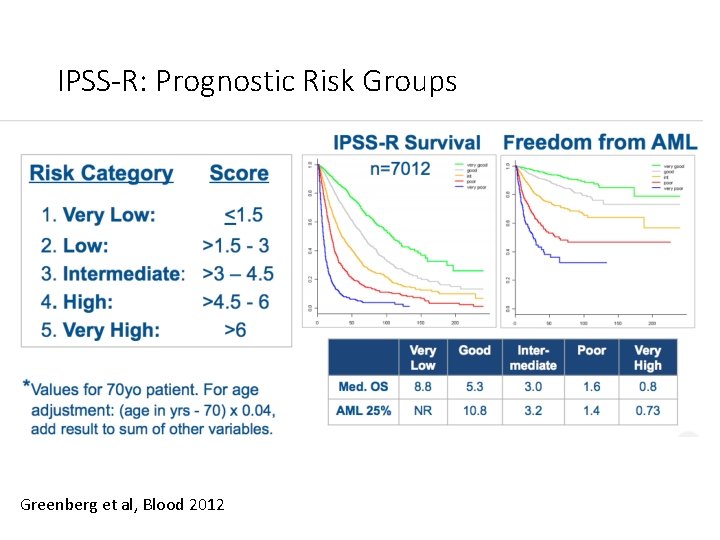
IPSS-R: Prognostic Risk Groups Greenberg et al, Blood 2012
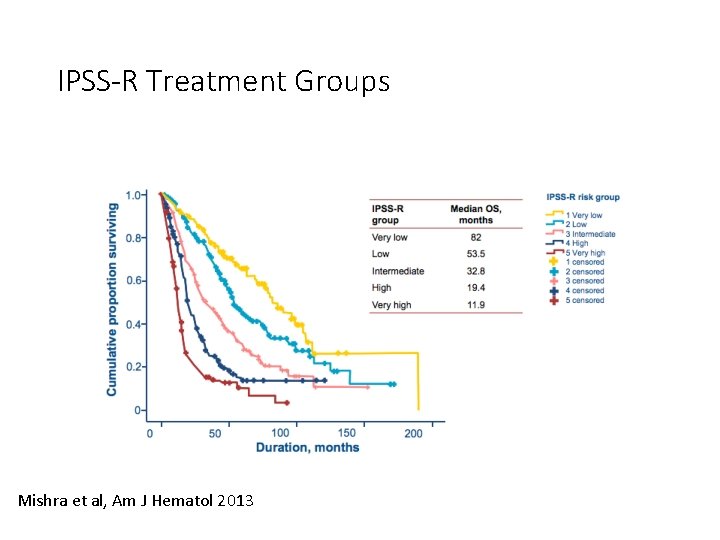
IPSS-R Treatment Groups Mishra et al, Am J Hematol 2013
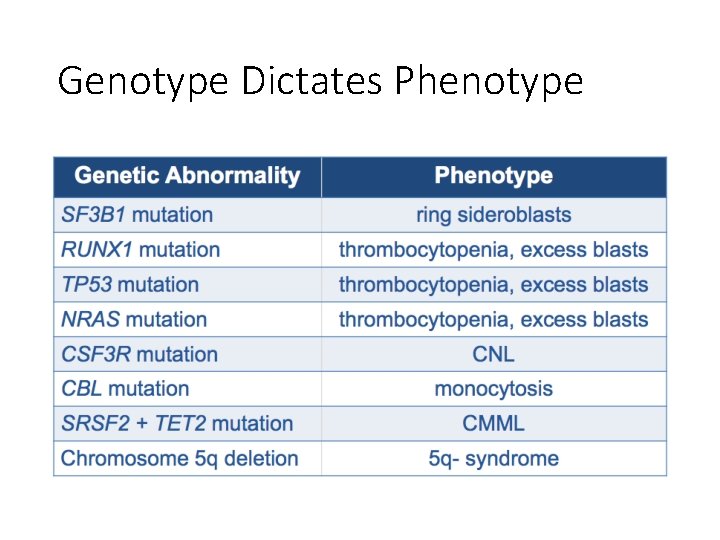
Genotype Dictates Phenotype
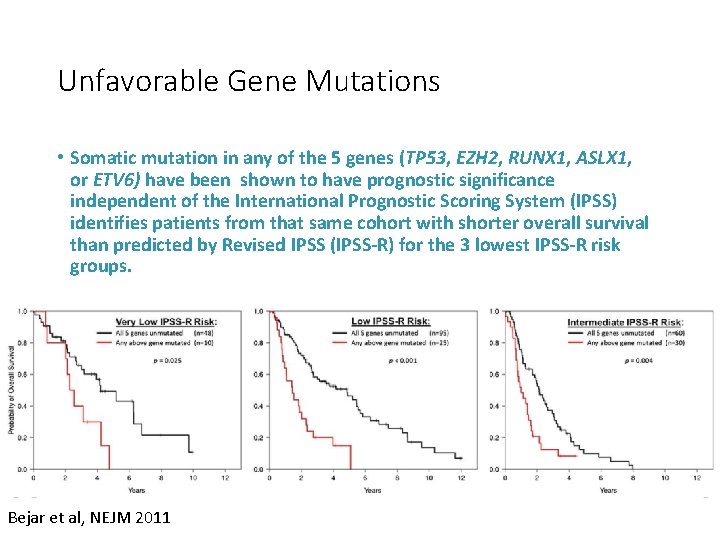
Unfavorable Gene Mutations • Somatic mutation in any of the 5 genes (TP 53, EZH 2, RUNX 1, ASLX 1, or ETV 6) have been shown to have prognostic significance independent of the International Prognostic Scoring System (IPSS) identifies patients from that same cohort with shorter overall survival than predicted by Revised IPSS (IPSS-R) for the 3 lowest IPSS-R risk groups. Bejar et al, NEJM 2011
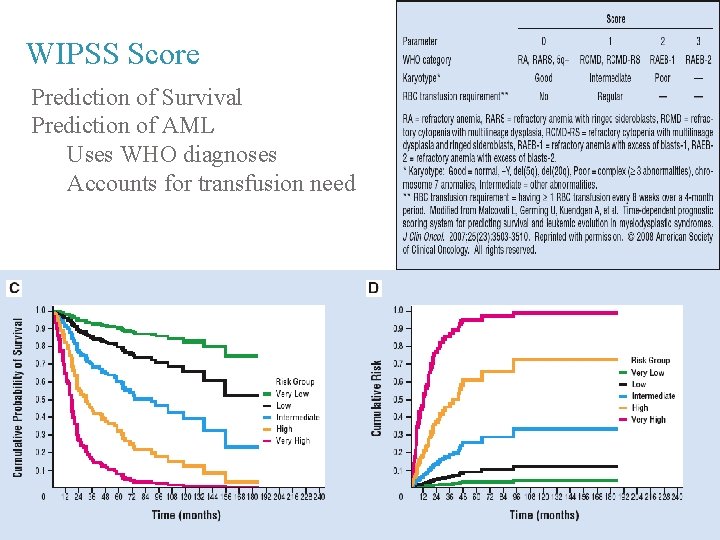
WIPSS Score Prediction of Survival Prediction of AML Uses WHO diagnoses Accounts for transfusion need
Treatment
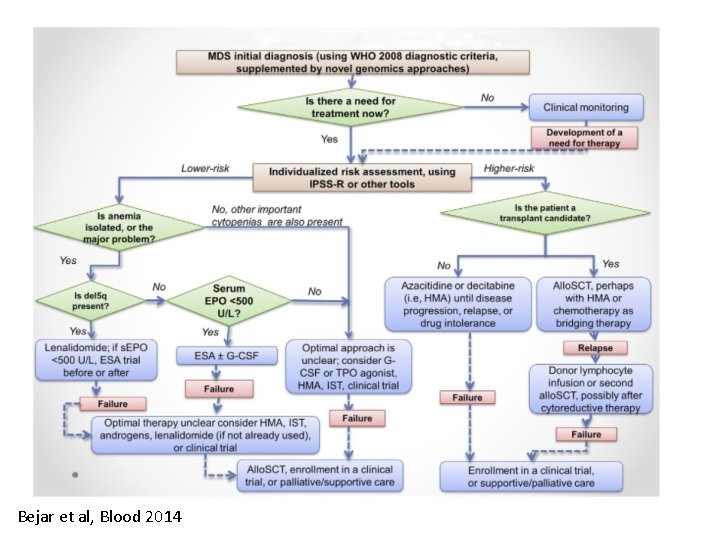
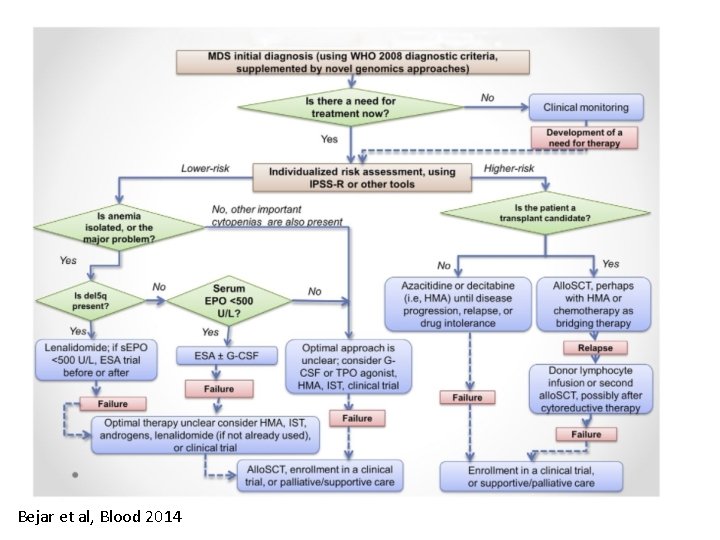
Bejar et al, Blood 2014
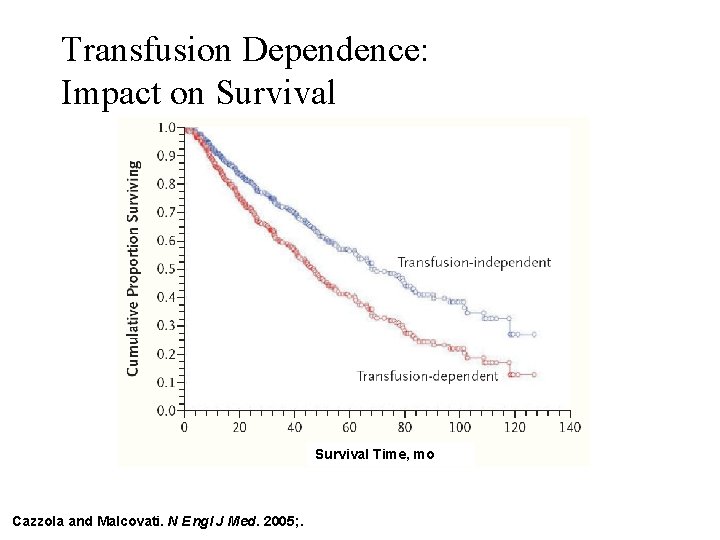
Transfusion Dependence: Impact on Survival Time, mo Cazzola and Malcovati. N Engl J Med. 2005; . 47
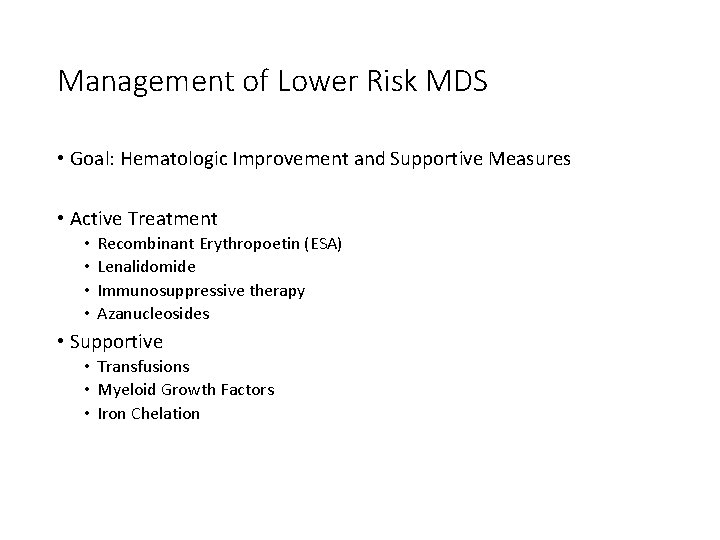
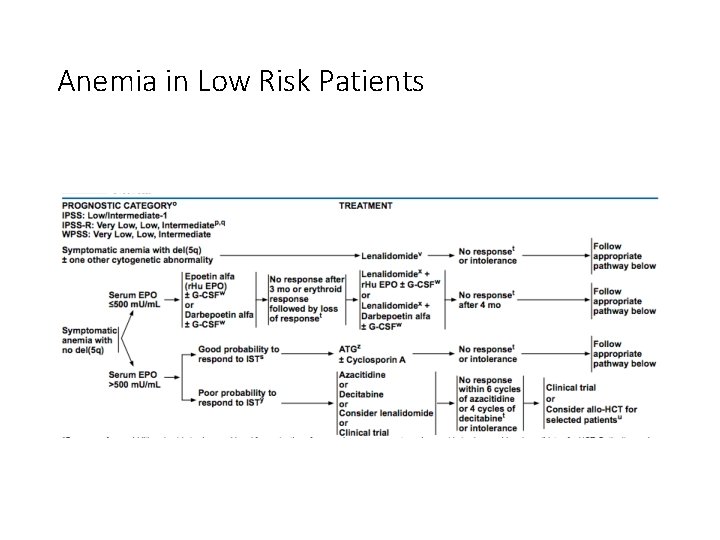
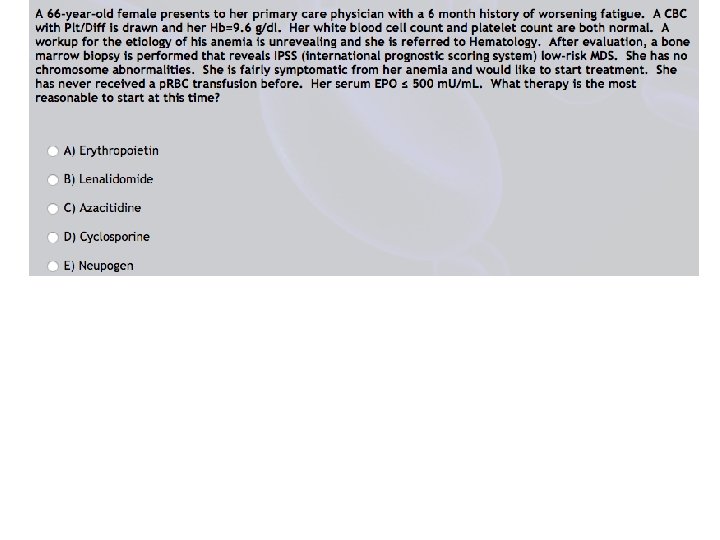
Management of Lower Risk MDS • Goal: Hematologic Improvement and Supportive Measures • Active Treatment • • Recombinant Erythropoetin (ESA) Lenalidomide Immunosuppressive therapy Azanucleosides • Supportive • Transfusions • Myeloid Growth Factors • Iron Chelation
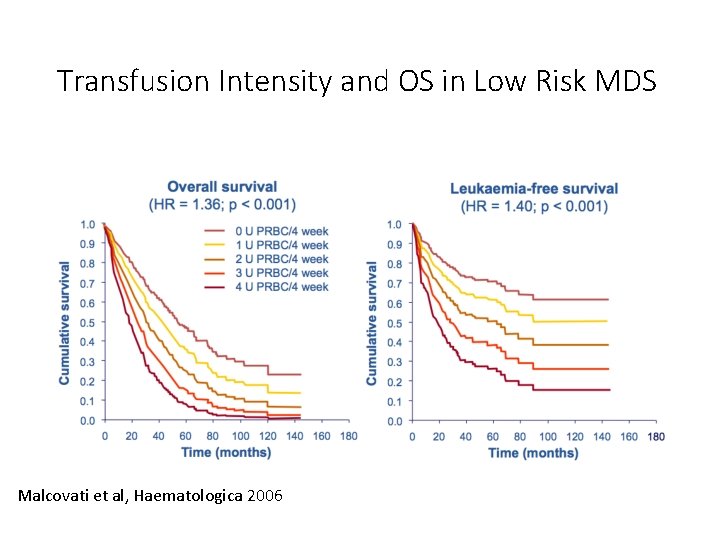
Transfusion Intensity and OS in Low Risk MDS Malcovati et al, Haematologica 2006
Anemia in Low Risk Patients
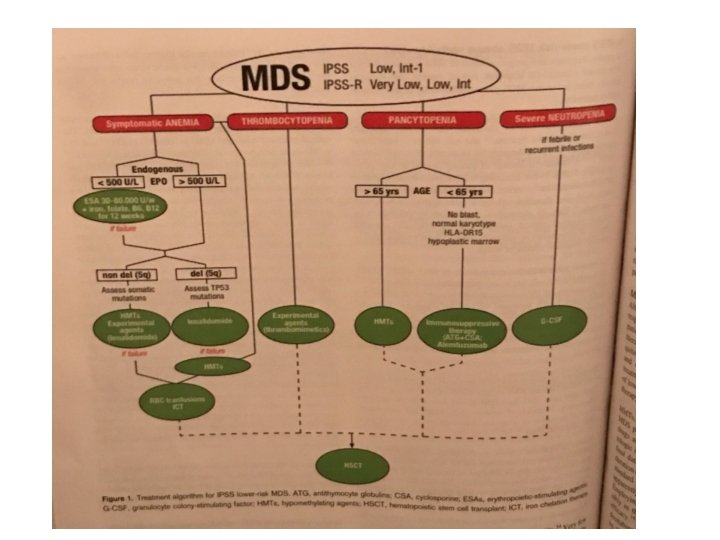
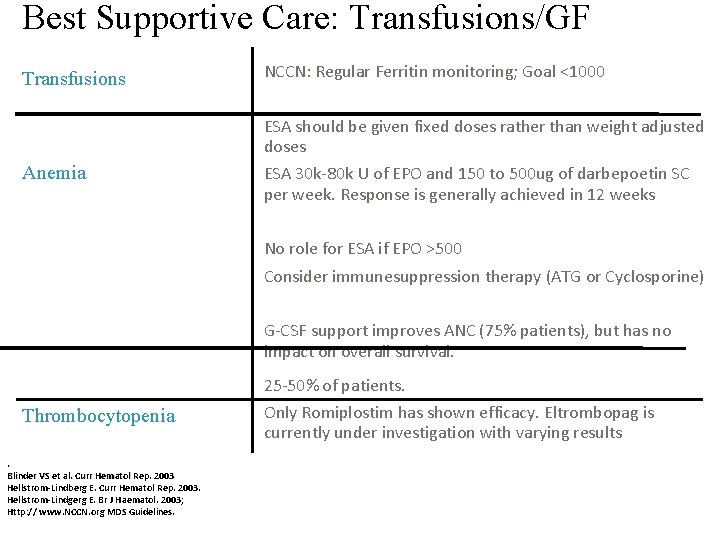
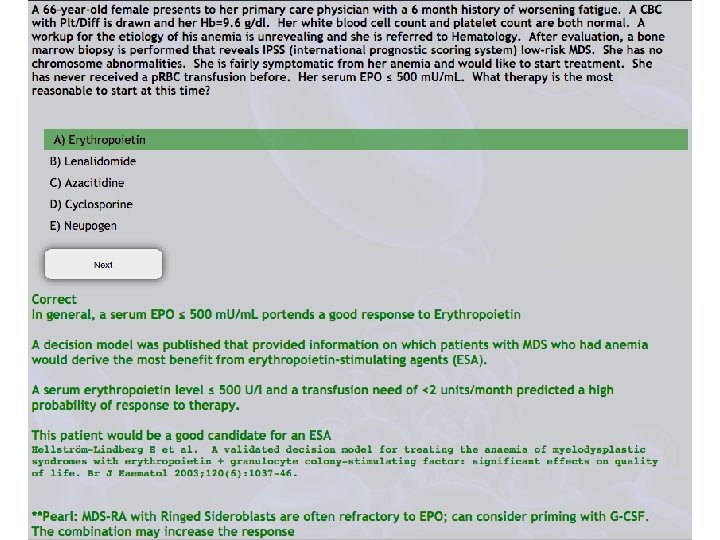
Best Supportive Care: Transfusions/GF Transfusions NCCN: Regular Ferritin monitoring; Goal <1000 ESA should be given fixed doses rather than weight adjusted doses Anemia ESA 30 k-80 k U of EPO and 150 to 500 ug of darbepoetin SC per week. Response is generally achieved in 12 weeks No role for ESA if EPO >500 Consider immunesuppression therapy (ATG or Cyclosporine) G-CSF support improves ANC (75% patients), but has no impact on overall survival. 25 -50% of patients. Thrombocytopenia. Blinder VS et al. Curr Hematol Rep. 2003 Hellstrom-Lindberg E. Curr Hematol Rep. 2003. Hellstrom-Lindgerg E. Br J Haematol. 2003; Http: // www. NCCN. org MDS Guidelines. Only Romiplostim has shown efficacy. Eltrombopag is currently under investigation with varying results
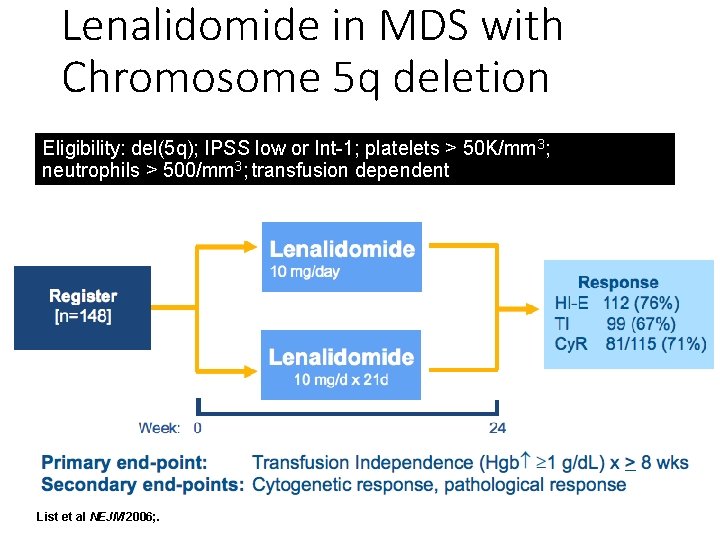
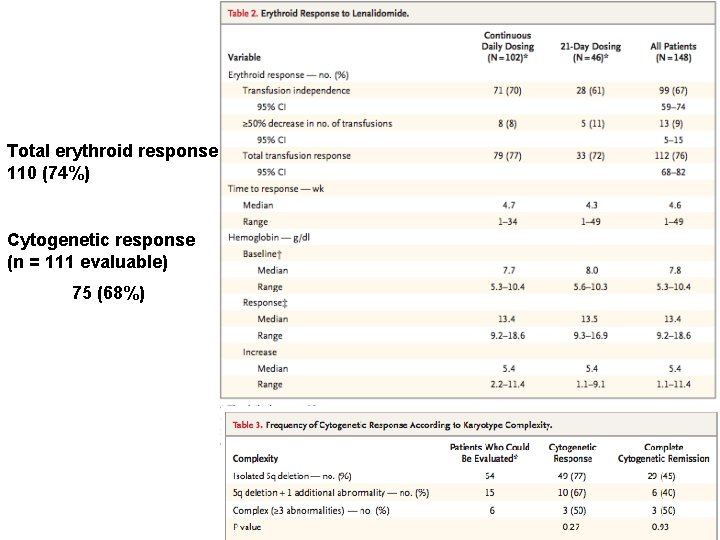
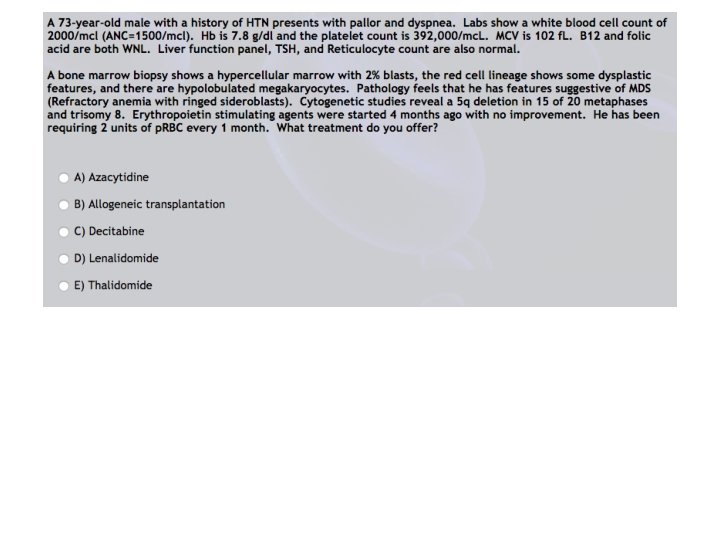
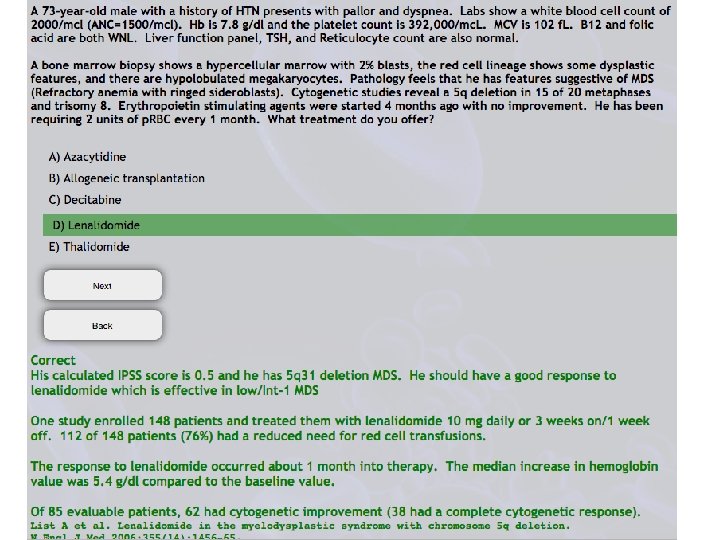
Lenalidomide in MDS with Chromosome 5 q deletion Eligibility: del(5 q); IPSS low or Int-1; platelets > 50 K/mm 3; neutrophils > 500/mm 3; transfusion dependent List et al NEJM 2006; .
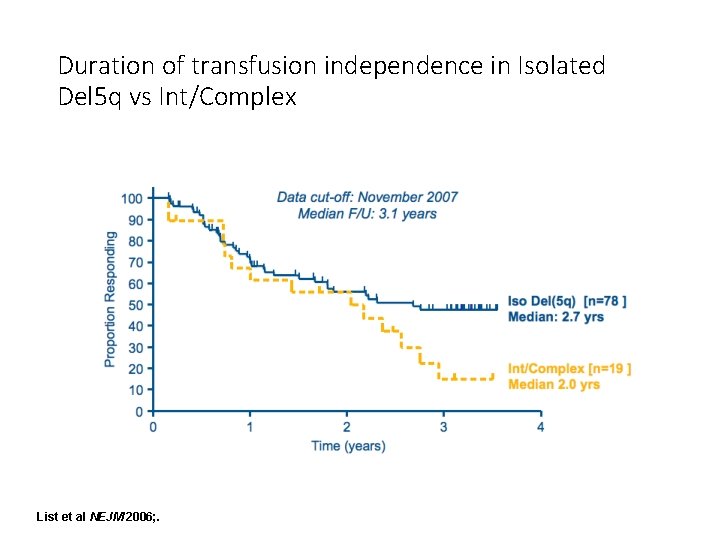
Duration of transfusion independence in Isolated Del 5 q vs Int/Complex List et al NEJM 2006; .
Total erythroid response 110 (74%) Cytogenetic response (n = 111 evaluable) 75 (68%)
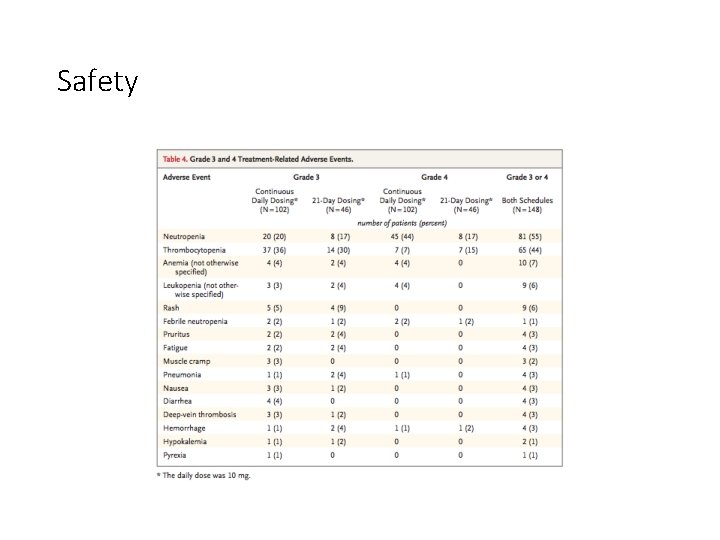
Safety
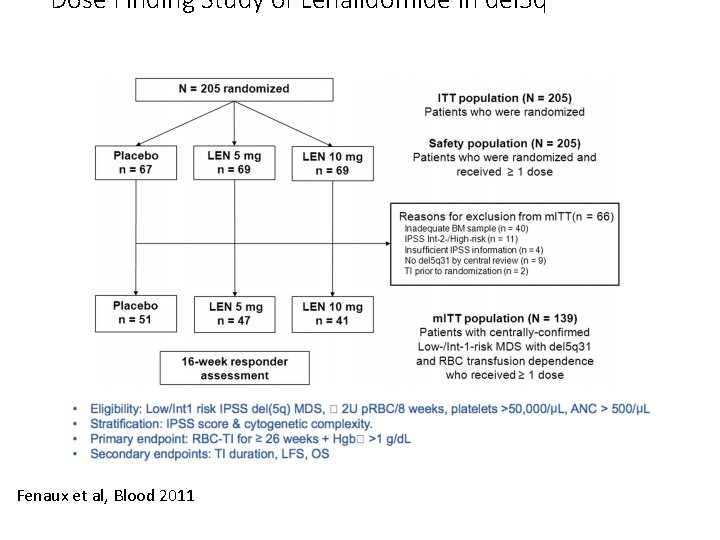
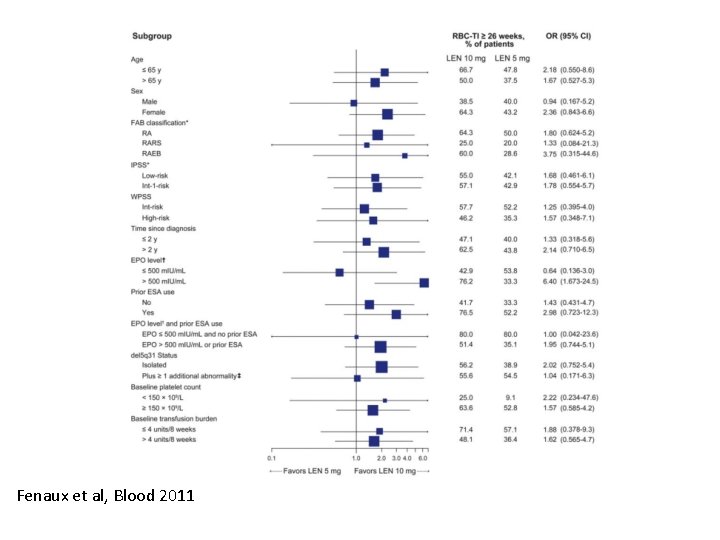
Dose Finding Study of Lenalidomide in del 5 q Fenaux et al, Blood 2011
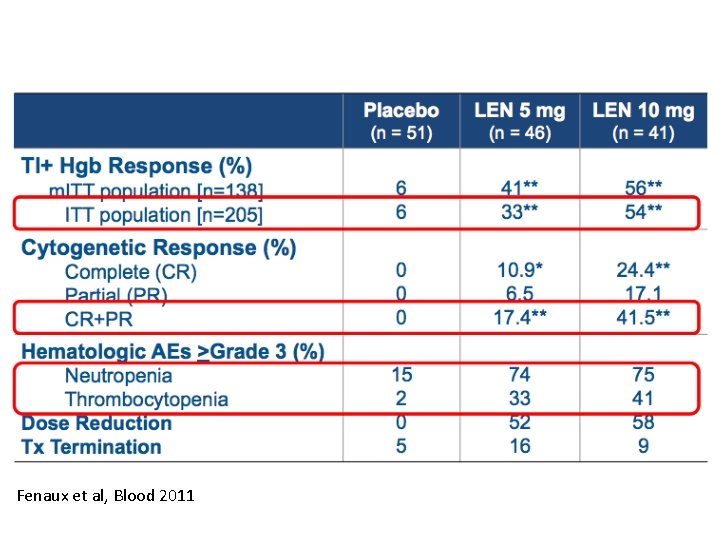
Fenaux et al, Blood 2011
Fenaux et al, Blood 2011
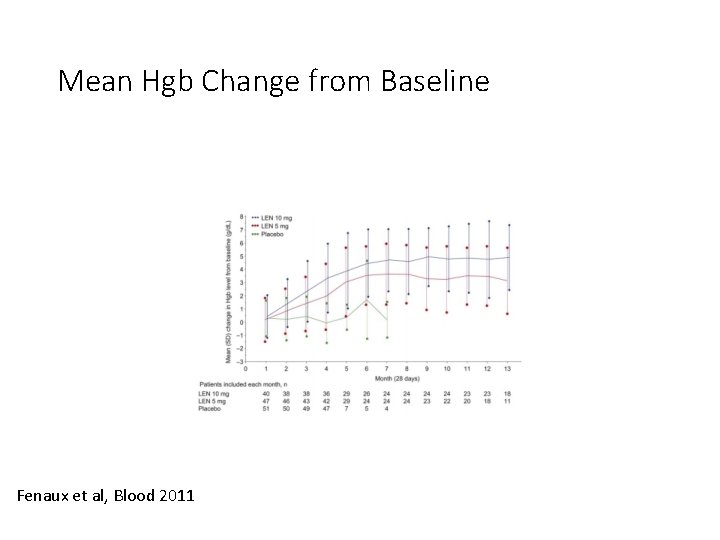
Mean Hgb Change from Baseline Fenaux et al, Blood 2011
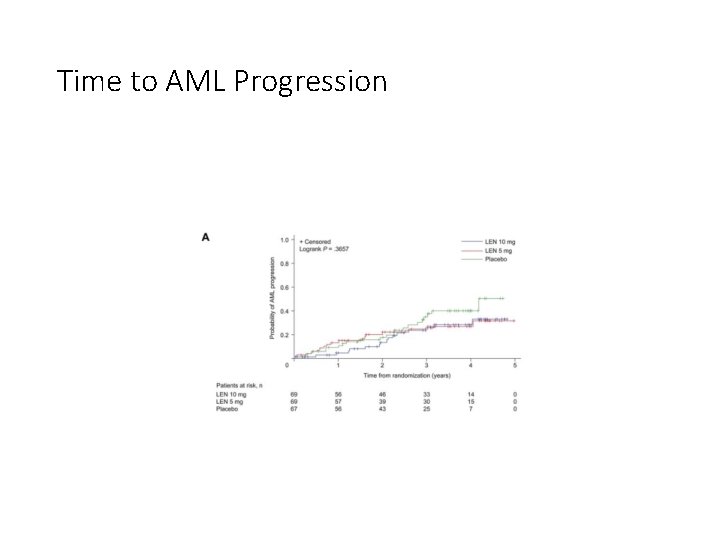
Time to AML Progression
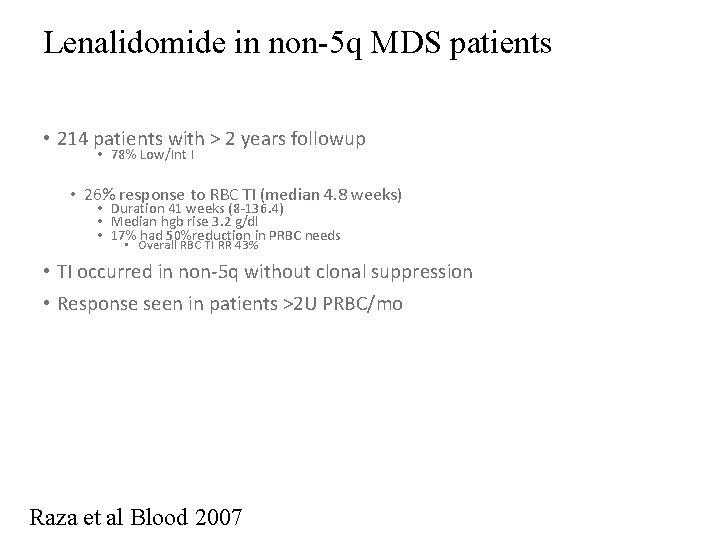
Lenalidomide in non-5 q MDS patients • 214 patients with > 2 years followup • 78% Low/Int I • 26% response to RBC TI (median 4. 8 weeks) • Duration 41 weeks (8 -136. 4) • Median hgb rise 3. 2 g/dl • 17% had 50%reduction in PRBC needs • Overall RBC TI RR 43% • TI occurred in non-5 q without clonal suppression • Response seen in patients >2 U PRBC/mo Raza et al Blood 2007 62
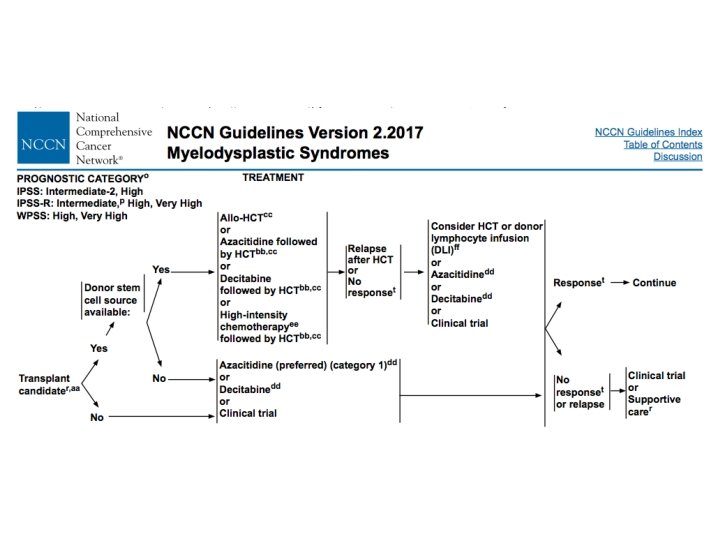
Treatment for Higher Risk MDS • Disease Modifying Therapy • Azanucleosides • Allogeneic HSCT • Induction Chemotherapy
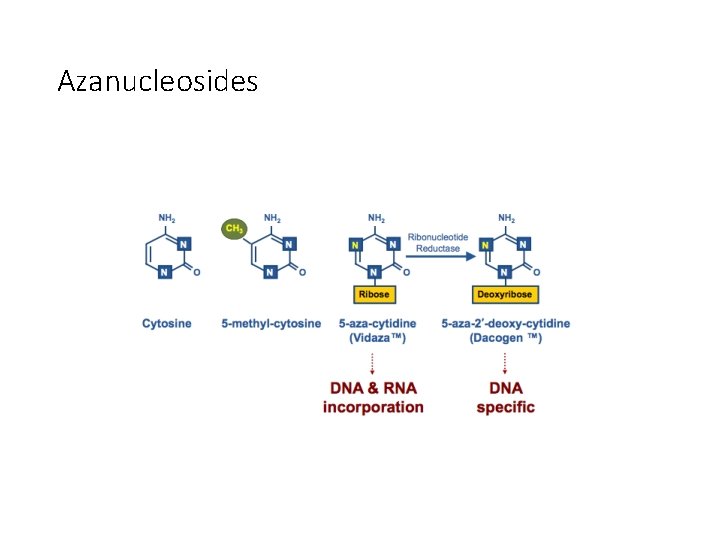
Azanucleosides
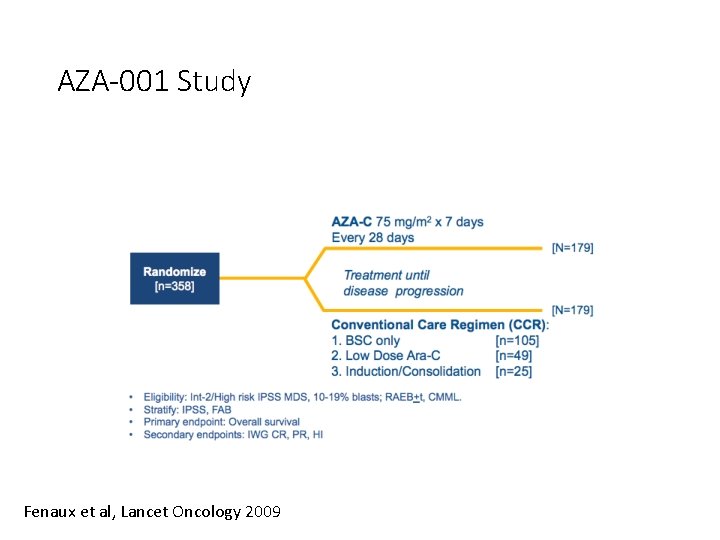
AZA-001 Study Fenaux et al, Lancet Oncology 2009
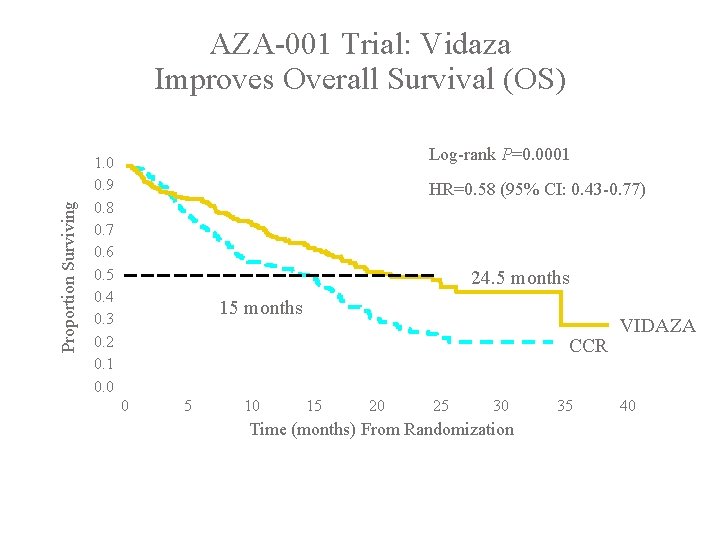
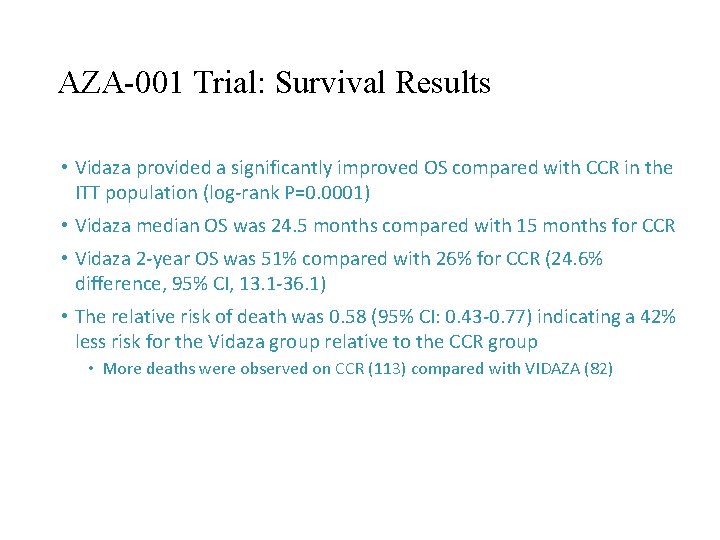
Proportion Surviving AZA-001 Trial: Vidaza Improves Overall Survival (OS) Log-rank P=0. 0001 1. 0 0. 9 0. 8 0. 7 0. 6 0. 5 0. 4 0. 3 0. 2 0. 1 0. 0 HR=0. 58 (95% CI: 0. 43 -0. 77) 24. 5 months 15 months CCR 0 5 10 15 20 25 30 Time (months) From Randomization 35 VIDAZA 40
AZA-001 Trial: Survival Results • Vidaza provided a significantly improved OS compared with CCR in the ITT population (log-rank P=0. 0001) • Vidaza median OS was 24. 5 months compared with 15 months for CCR • Vidaza 2 -year OS was 51% compared with 26% for CCR (24. 6% difference, 95% CI, 13. 1 -36. 1) • The relative risk of death was 0. 58 (95% CI: 0. 43 -0. 77) indicating a 42% less risk for the Vidaza group relative to the CCR group • More deaths were observed on CCR (113) compared with VIDAZA (82)
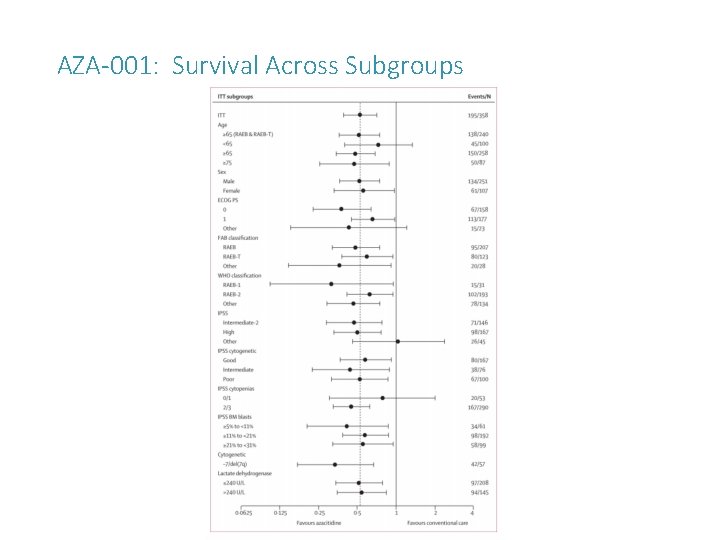
AZA-001: Survival Across Subgroups
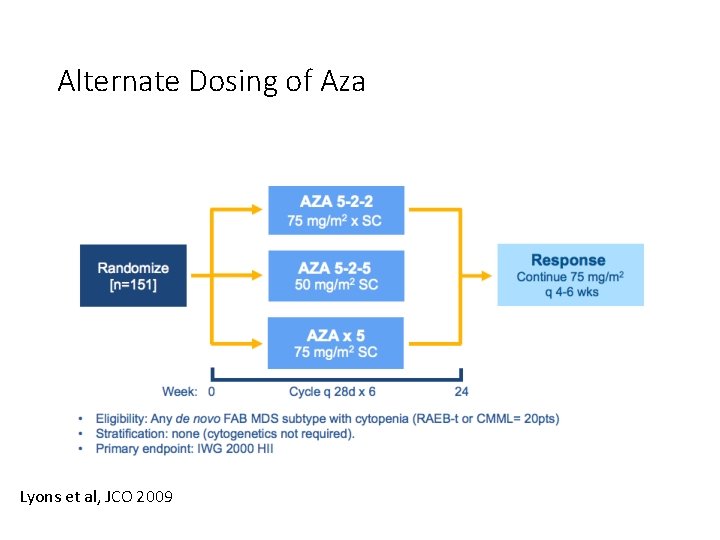
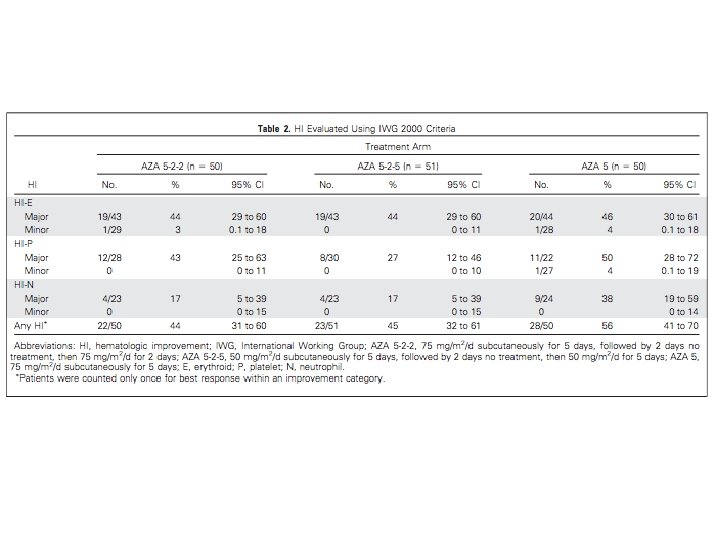
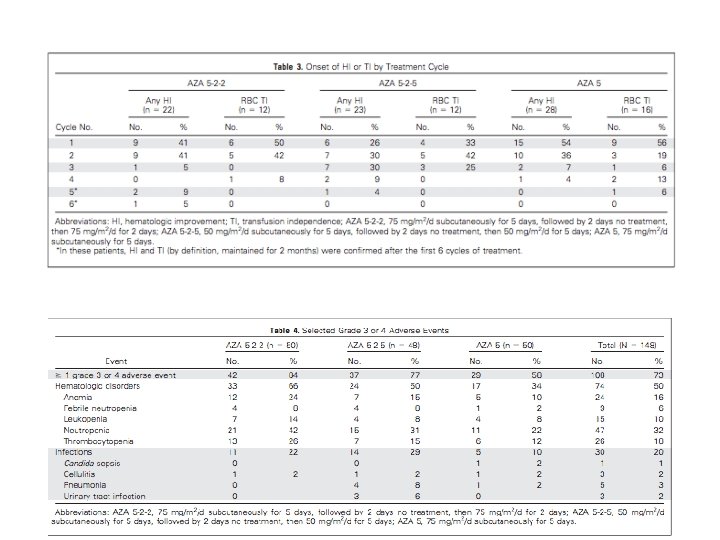
Alternate Dosing of Aza Lyons et al, JCO 2009
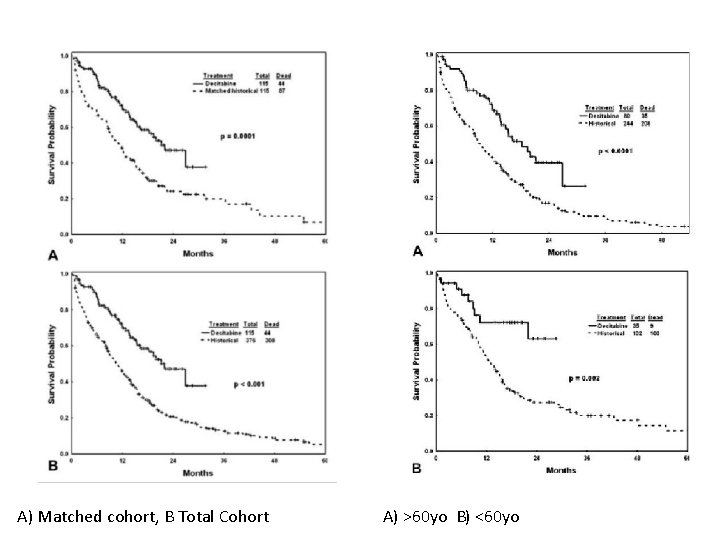
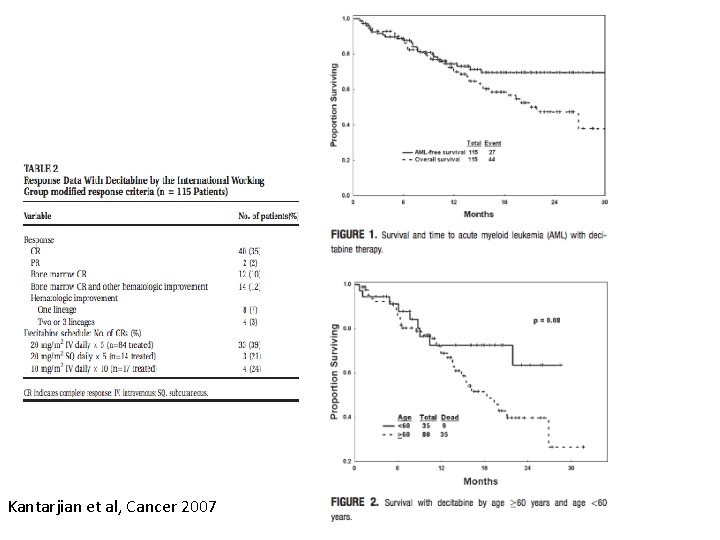
Decitabine • Kantarjian et al, Cancer 2006 • 115 patients treated with lower intensity decitabine • 376 historic controls (115 matched according to age, IPSS scores, and cytogenetics) and second cohort was all 376 patients • Historic controls received intensive chemotherapy
A) Matched cohort, B Total Cohort A) >60 yo B) <60 yo
Kantarjian et al, Cancer 2007
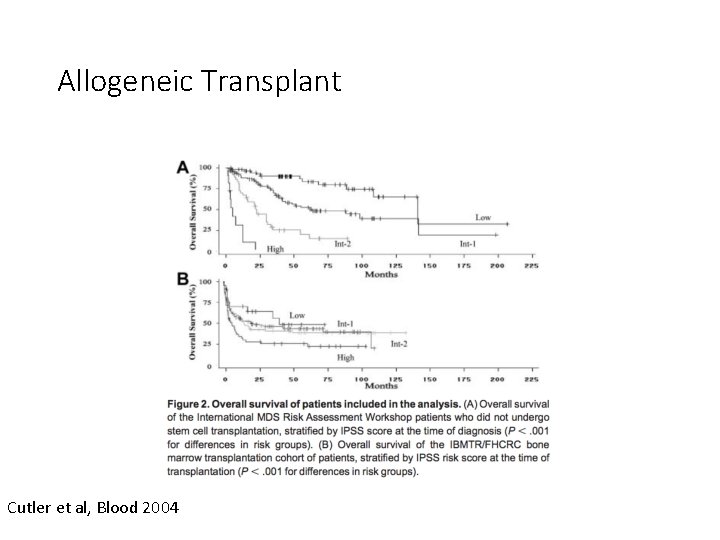
Allogeneic Transplant Cutler et al, Blood 2004
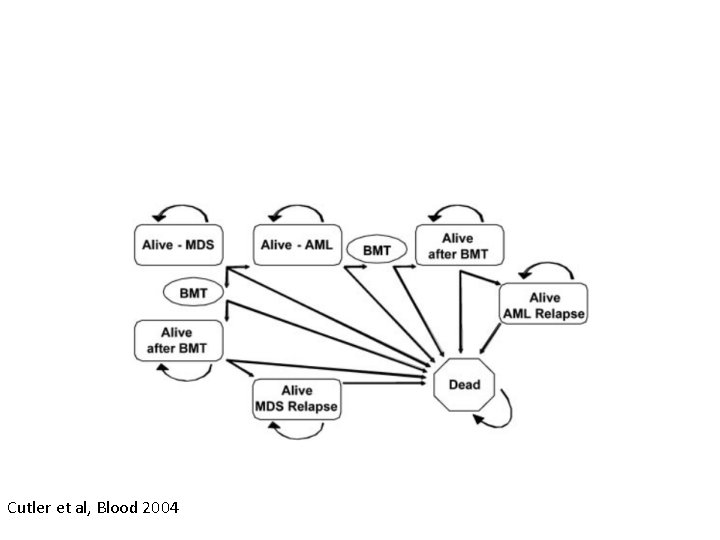
Cutler et al, Blood 2004
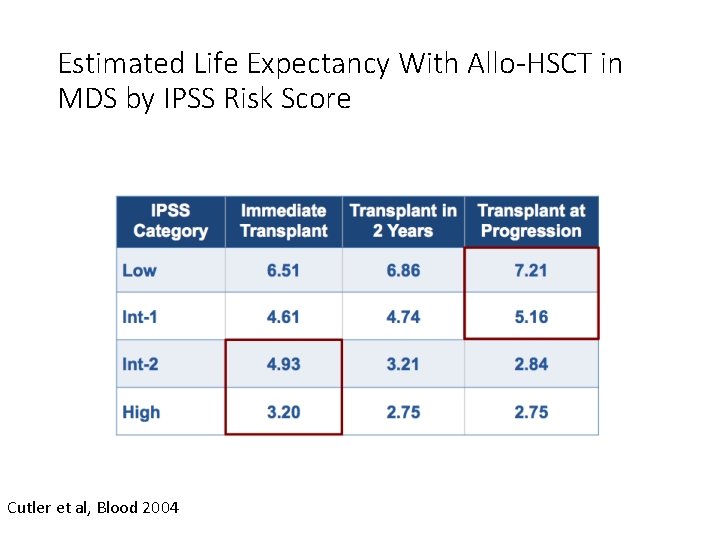
Estimated Life Expectancy With Allo-HSCT in MDS by IPSS Risk Score Cutler et al, Blood 2004
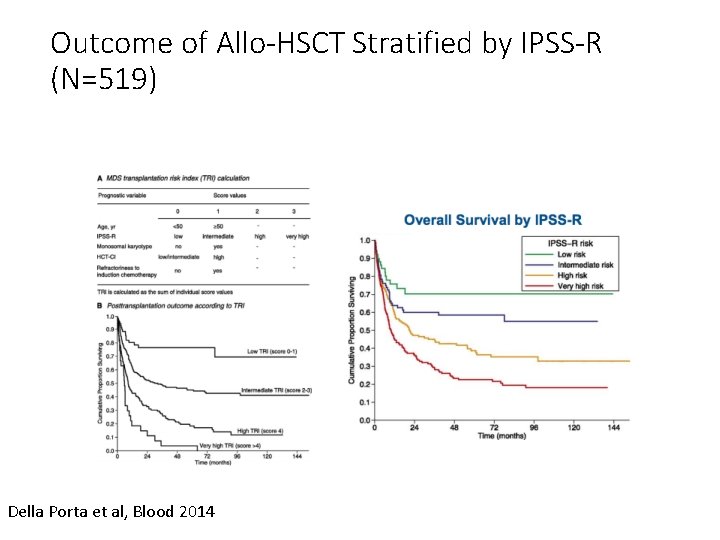
Outcome of Allo-HSCT Stratified by IPSS-R (N=519) Della Porta et al, Blood 2014
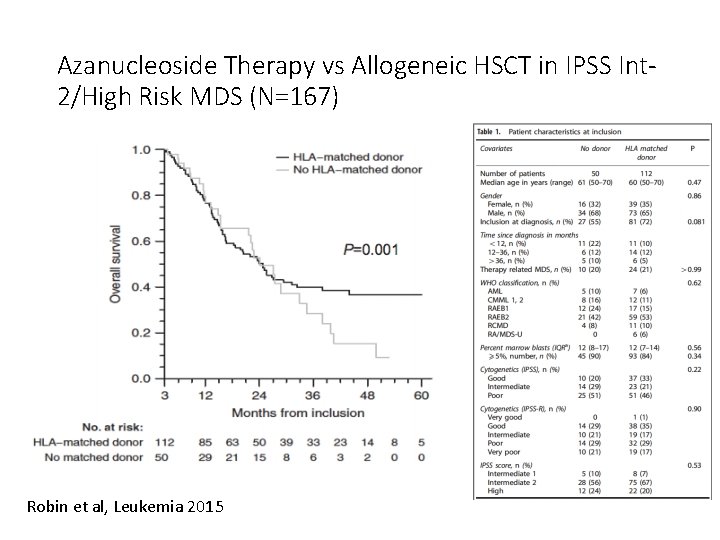
Azanucleoside Therapy vs Allogeneic HSCT in IPSS Int 2/High Risk MDS (N=167) Robin et al, Leukemia 2015
Bejar et al, Blood 2014
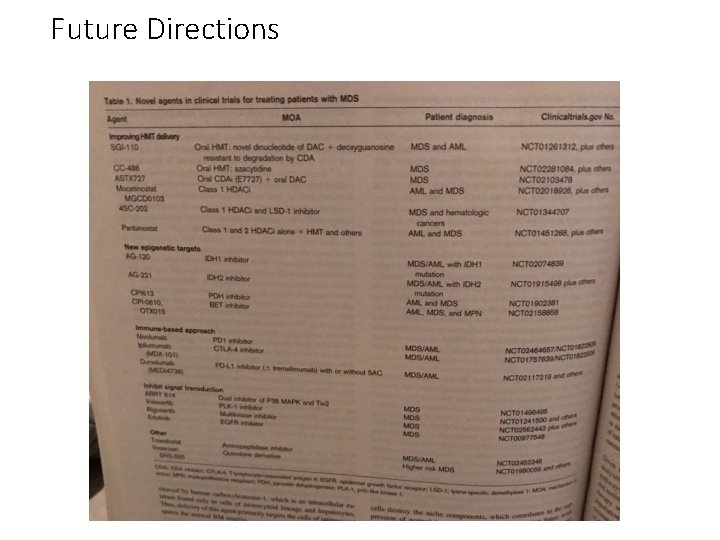
Future Directions
• Thank You