MVP Module 7 Lesson 1 MVP NC Math


 be the numerical length of the nth line segment in this sequence.")


- Slides: 30
MVP Module 7 Lesson 1 MVP NC Math 2 2019 -20
READY? Topic: Recalling Direct Variation Functions Pre. K-12 Mathematics
Pre. K-12 Mathematics
Identify whether the given equation represents a direct variation. If it does, state the constant of variation. If not, explain why. YES/NO Why? k? y – 7 x = 0 -2 x + 5 y = 0 5 x + y = 10 17 y = -34 x Pre. K-12 Mathematics
State whether or not each table represents a direct variation relationship. If it does, write the equation in y = kx form. Pre. K-12 Mathematics
State whether or not each table represents a direct variation relationship. If it does, write the equation in y = kx form. Pre. K-12 Mathematics
Which graph shows a direct variation relationship? Identify the features of a direct variation graph. Pre. K-12 Mathematics
Lesson Essential Question Pre. K-12 Mathematics
Lesson 7: Growing Roots A Develop Understanding Task Pre. K-12 Mathematics
In your previous math work with the Pythagorean Theorem you have learned about square roots as a number. In this task we will consider the square root function. We will begin by examining the context that gave rise to the name of this function, the relationship between the area and side length of a square.
Determine the area and side length of each of the following squares, and label both quantities on the diagram. Illustrate or explain how you found the measure of each quantity.
You may recall the following definition of square root: The square root of a number, N, is the factor, n, such that when a number is multiplied by itself, n x n, the product is N.
The diagram below was created using the following recursive process:
Determine the length of each line segment in this sequence, measured from the origin to the endpoint labeled in the diagram:
Let f(n) be the numerical length of the nth line segment in this sequence. Define f(n) recursively: f(1) = 1, and f(n) = Define f(n) explicitly: f(n) =
Use a compass to draw circles on the diagram, centered at the origin with radii of 1, 2, 3, and 4 units. What is significant about the endpoints in the diagram that lie on these circles? If we were to continue to construct line segments using this recursive patter, how many endpoints would lie between the circle of radius 4 and the circle of radius 5? What observations can you make about the number of endpoints that lie between consecutive circles?
The domain of this discrete sequence is the natural numbers. To graph this sequence, we could use the lengths of the line segments in the diagram to determine the value of the sequence for each natural number, as shown in the graph below.
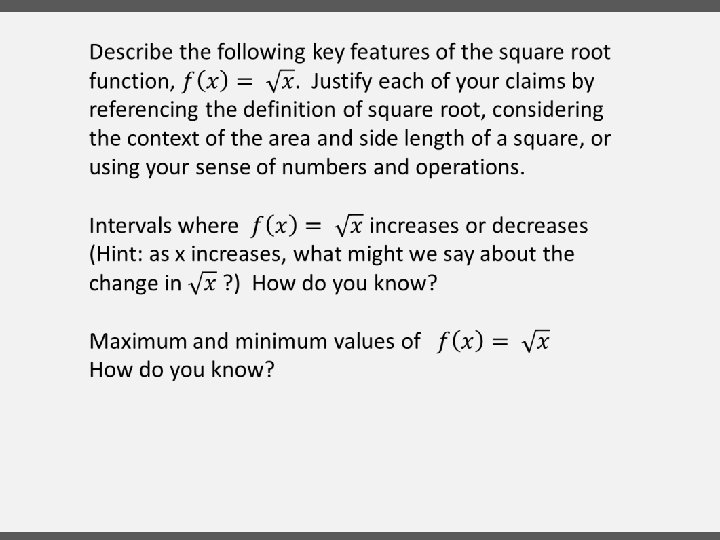
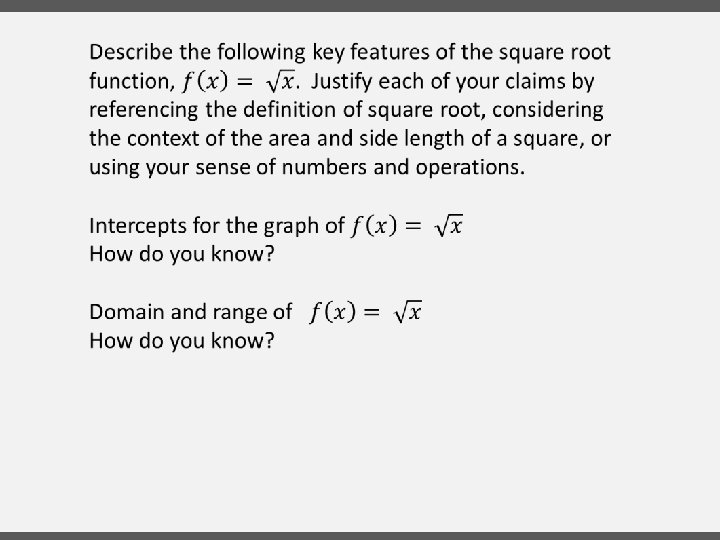
SET? Topic: Identifying features of the square root function
Explain the reason for selecting 0, 1, 4, 9 and 16 for the x-values?
Circle all of the features that apply to the graph of the square root function. If you identify a feature, write the specific value(s) that describe the feature, if possible.
Circle all of the functions that represent a square root function.
GO! Topic: Graphing quadratic functions with transformations
Describe the transformation on each parabola. Then graph the function.
Describe the transformation on each parabola. Then graph the function.
Describe the transformation on each parabola. Then graph the function.
Describe the transformation on each parabola. Then graph the function.
EXIT TICKET Illustrate and annotate the key features of a square root function graph.