MVP 3 Module 4 Lesson 6 MVP NC


 Graph the relationship between braking distance d(s), and speed (s), below.")
 What if the driver of the Ferrari 550 was cruising along and suddenly")
 Part of the job of police officers is to investigate traffic accidents to")
 Write an equation of the function s(d) that gives the speed the car")
 Students were given a set of data to")
 Describe a sequence of transformations that would take Ethan’s graph onto Emma’s. Ethan’s")
 A baseball is hit upward from a height of 3 feet with an")


) is indicating that you replace x in f(x) with")
 -5 1 0 5 10 2 3 4")
- Slides: 20
MVP 3 Module 4 Lesson 6 MVP NC Math 3 2020 -21
READY? Topic: Solving for a variable Solve for x. Pre. K-12 Mathematics
Pre. K-12 Mathematics
Lesson Essential Question Do all functions have inverses? If so, are their inverses always functions? Pre. K-12 Mathematics
4. 6 Flipping Ferraris A Solidify Understanding Task Pre. K-12 Mathematics
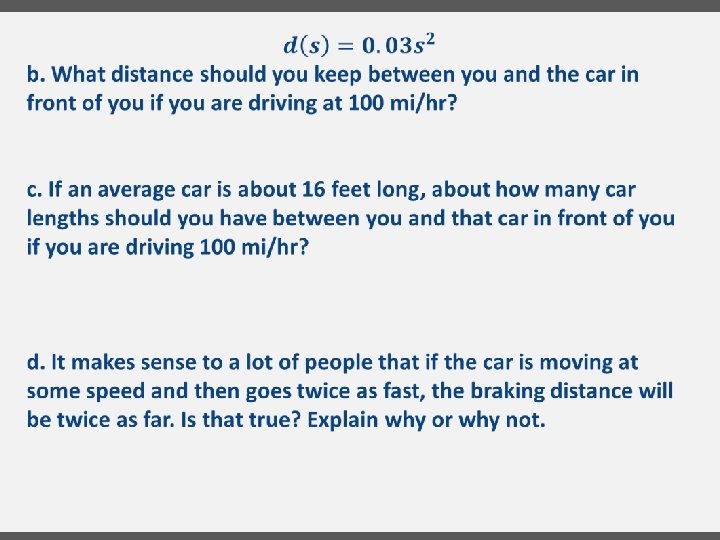
When people first learn to drive, they are often told that the faster they are driving, the longer it will take to stop. So, when you’re driving on the freeway, you should leave more space between your car and the car in front of you than when you are driving slowly through a neighborhood. Have you ever wondered about the relationship between how fast you are driving and how far you travel before you stop, after hitting the brakes? 1) Think about it for a minute. What factors do you think might make a difference in how far a car travels after hitting the brakes?
There has actually been quite a bit of experimental work done (mostly by police departments and insurance companies) to be able to mathematically model the relationship between the speed of a car and the braking distance (how far the car goes until it stops after the driver hits the brakes).
3) Graph the relationship between braking distance d(s), and speed (s), below.
5) What if the driver of the Ferrari 550 was cruising along and suddenly hit the brakes to stop because she saw a cat in the road? She skidded to a stop, and fortunately, missed the cat. When she got out of the car she measured the skid marks left by the car so that she knew that her braking distance was 31 ft. a. How fast was she going when she hit the brakes? b. If she didn’t see the cat until she was 15 feet away, what is the fastest speed she could be traveling before she hit the brakes if she wants to avoid hitting the cat?
6) Part of the job of police officers is to investigate traffic accidents to determine what caused the accident and which driver was at fault. They measure the braking distance using skid marks and calculate speeds using the mathematical relationships just like we have here, although they often use different formulas to account for various factors such as road conditions. Let’s go back to the Ferrari on a smooth, dry road since we know the relationship. Create a table that shows the speed the car was traveling based upon the braking distance.
7) Write an equation of the function s(d) that gives the speed the car was traveling for a given braking distance. 8)Graph the function s(d) and describe its features. 9) What do you notice about the graph of s(d) compared to the graph of d(s)? What is the relationship between the functions d(s) and s(d)?
SET? Topic: Exploring inverse functions 10) Students were given a set of data to graph. After they had completed their graphs, each student shared his graph with his shoulder partner. When Ethan and Emma saw each other’s graphs, they exclaimed together, “Your graph is wrong!” Neither graph is wrong. Explain what Ethan and Emma have done with their data. Ethan’s graph Emma’s graph
11) Describe a sequence of transformations that would take Ethan’s graph onto Emma’s. Ethan’s graph Emma’s graph
12) A baseball is hit upward from a height of 3 feet with an initial velocity of 80 feet per second (about 55 mph). The graph shows the height of the ball at any given second during its flight. Use the graph to answer the questions below. a. Approximate the time that the ball is at its maximum height. b. Approximate the time that the ball hits the ground. c. At what time is the ball 67 feet above the ground?
d. Make a new graph that shows the time when the ball is at the given heights. e. Is your new graph a function? Explain.
GO! Topic: Using function notation to evaluate a function Calculate the indicated function values. Simplify your answers.
Notice that the notation f(g(x)) is indicating that you replace x in f(x) with g(x). Simplify the following.
Exit Ticket x f(x) -5 1 0 5 10 2 3 4