Municipal solid waste management Unit 1 Sources and


 content of the waste")


 1, 22, 800")


- Slides: 42
Municipal solid waste management Unit 1 Sources and Types of Municipal solid wastes By Ms. S. Sethukkarasi Assistant Professor VCET
Definition of solid waste
Solid waste management • Any material that is discarded , useless or unwanted is considered as a waste • Waste management is the collection, transport , processing, recycling or disposal and monitoring of waste materials
SOLID WASTE MANAGEMENT Objectives • • • Public hygiene and health Reuse , Recovery and Recycle Energy generation Sustainable development Aesthetics
Sources of solid waste
Sources of Wastes Agriculture Fisheries
Sources of Wastes Households Commerce and Industry
Generally …………
Cont…. .
Classification of Municipal solid waste management • Source-based MSW • Commercial • Residential • Construction & Demolition • Industries • Hospitals & clinics • Power plants • Public areas • Street sweeping • Agricultural areas • Type-based MSW • Garbage & Rubbish • Ashes & Residues • Construction & demolition • Bulky waste • Bio degradable and non-biodegradable • Horticulture waste • Dead animals • Abandoned vehicles • Recyclable and non recyclable
Composition
What’s happening in India? ? ?
Impacts of solid waste
Consequences of improper management of solid waste on Public health • Disease vectors and pathways • Flies • Mosquitoes • Roaches Environment • Air, water and Land pollution • Visual pollution • Noise pollution • Odour pollution • Rodents • Explosion hazards • Animals • Occupational hazards
Factors Affecting the quantity of Generation of solid waste • Source reduction/recycling • Legislation • Geographic location • Public attitudes • Season/climate • Size of households(economic) • Collection Frequency • Population density • Pay-As-You Throw Programs • Population increase
How to determine the quantity of the solid waste? ? ? ?
Generation Rate of Municipal Solid Waste • Determination of the generation rate of solid waste is important to obtain data in order to determine waste volume and for subsequent solid waste management. • In addition to knowing the source and composition of solid waste, it is equally important to have uniform units of expression. • Household waste (kg/capita/day) • Commercial waste (kg/x/day where x can be m 2 of floor area of commercial establishment, unit volume or dollar in sales, the number of employees, etc. ) • Institutional waste (kg/x/day where x can be the number of students, m 2 of the area of park or public place, number of visitors, etc. ) • Industrial waste (kg/x/day where x can be unit volume or dollar of production output, m 2 of floor area, the number of employees, etc. ) • total waste (kg/capita/day) 18
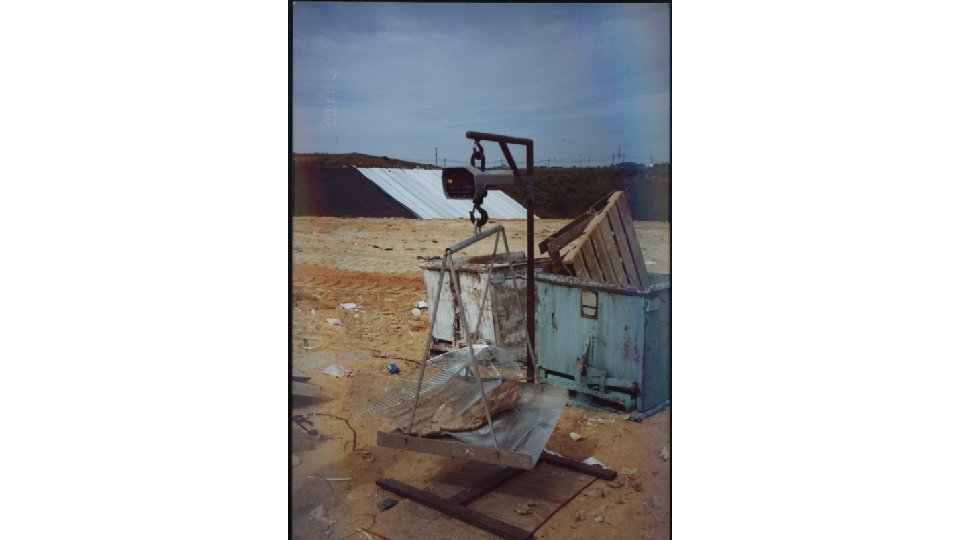
Generation Rate of Municipal Solid Waste. . Methods of Estimate MSW • Quantities Waste quantities are usually estimated on the basis of data gathered by conducting a waste characterization study, using previous waste generation data or some combination of the two approaches. • Load-Count Analysis: In this method, the number of individual loads and the corresponding waste characteristics (types of waste, estimate volume) are noted over a specified time period. If scales are available, weight data are also recorded. • Weight-volume analysis: measuring the volume of the truck and weight of each load will give sample data. • Materials Mass Balance Analysis: The only way to determine the generation and movement of solid wastes with any degree of reliability for each generation source, such as an individual home or a commercial or industrial activity. In some cases, the materials balance method of analysis will be required to obtain the data needed to verify compliance with state-mandated recycling programs. 19
Generation Rate of Municipal Solid Waste. . Methods of Estimate MSW Quantities… Preparation of Materials Mass Balances: • Draw a system boundary around the unit to be studied. It will be possible to simplify the mass balance computations. • Identify all the activities that cross or occur within the boundary and affect the generation of wastes. • Identify the rate of waste generation associated with each of these activities. • Using appropriate mathematical relationships, determine the distribution which is about 40 to 50 percent rubbish , 20 to 30 percent wood and related products, and 20 to 30 percent miscellaneous wastes (painted or contaminated lumber, metals tar-based products, plaster, glass, white goods, asbestos and other insulation material, and plumbing, heating and electrical parts). 20
Generation Rate of Municipal Solid Waste… • Solid waste generation rates estimate the amount of waste created by residences or businesses over a certain amount of time (day, year, etc. ). • Waste generation includes all materials discarded, whether or not they are later recycled or disposed in a landfill. • Waste generation rates for residential and commercial activities can be used to estimate the impact of new developments on the local waste stream. • They may be useful in providing a general level of information for planning purposes. 21
Characteristics of solid waste Three types of characteristics: 1. Physical 2. Chemical 3. Biological
Physical characteristics • Density • Moisture content • Size Chemical characteristics • lipids • Carbohydrates • Proteins • Natural fibres • Synthetic organic material (plastics) • Non-combustibles • Heating values • Ultimate analysis • Proximate analysis Biological characteristics
Biodegradability Organic fraction often equated with the volatile solids (VS) content of the waste However, not all organic materials are easily degradable Biodegradable fraction Degradation produces odours Hydrogen sulfide, H 2 S (rotten eggs) Methyl mercaptans Aminobutyric acid Methane is odourless. Attracts flies, vermin, rodents (vectors)
Sample Plan • Load Selection • Number of Samples
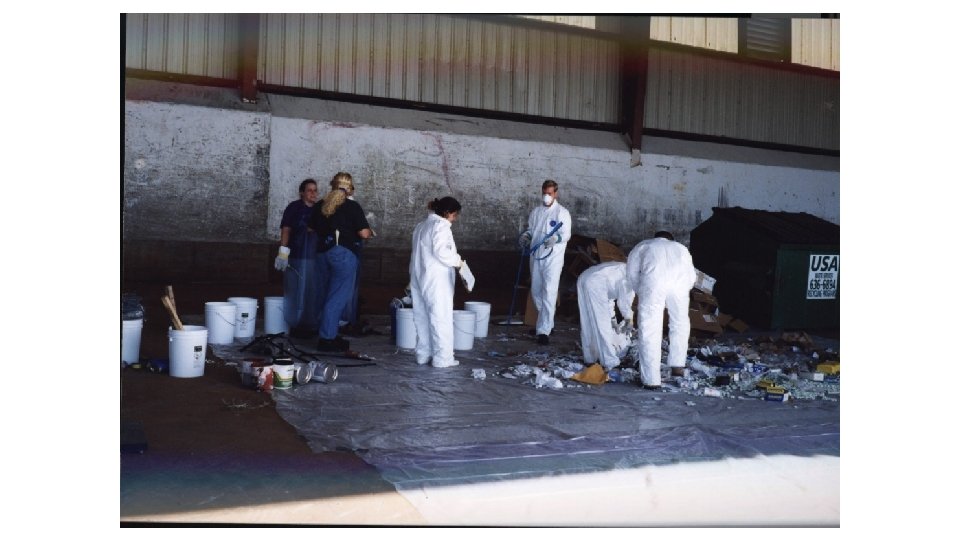
Sampling Procedure • Vehicle Unloading • Sample Selection and Retrieval • Container Preparation • Sample Placement • Sorting
Waste contents are unloaded for sorting
Appropriate mass of material is selected randomly
Each load is separated manually by component example - Wood, concrete, plastic, metal, etc.
Components are separated
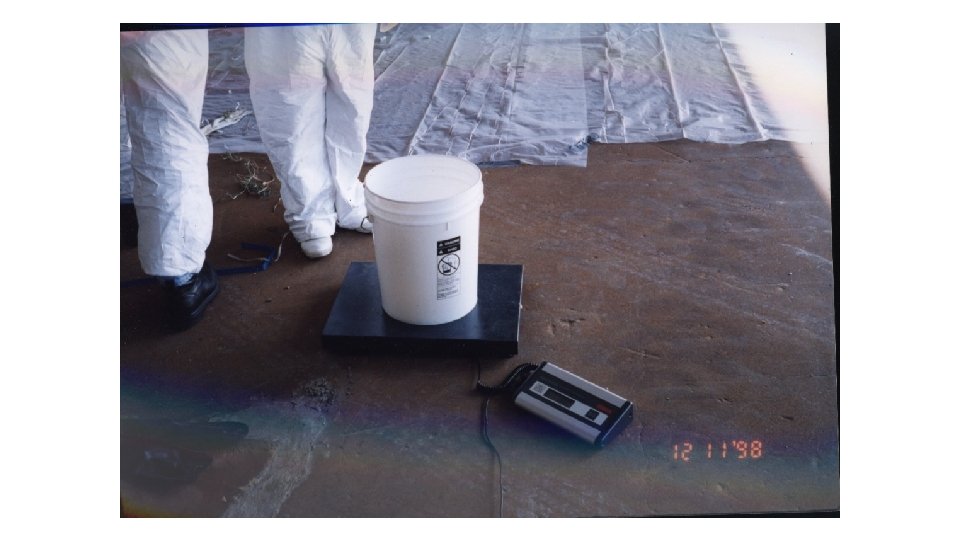
Each component is weighed and weights recorded
Data Interpretation • Weighted Average based on Generator Source Composition/Distribution • Contamination Adjustment
Roe of NGO’S in solid waste management
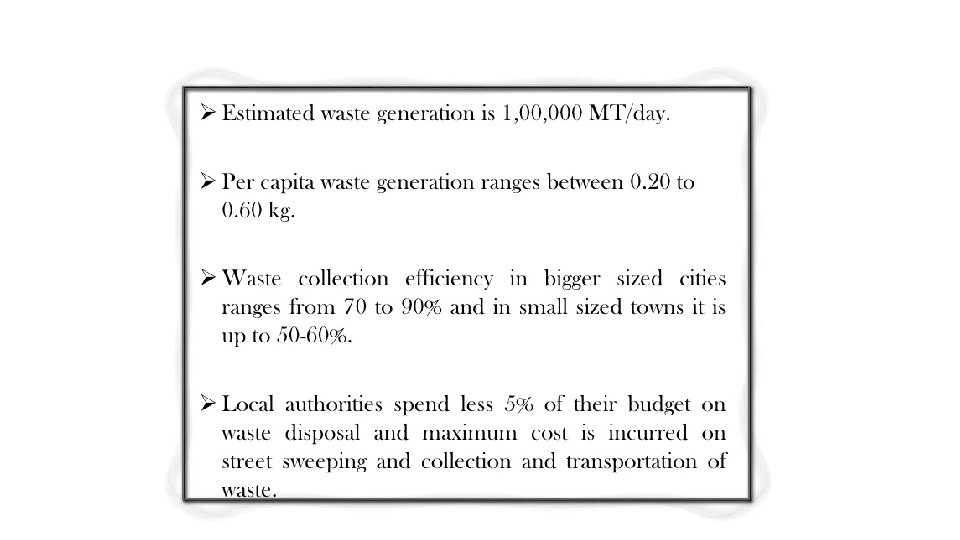
INTRODUCTION • Growth of human population, increasing economic activities and standard of living generates more municipal solid waste. • Increased urbanization , rapid industrialization and changing lifestyles influences solid waste generation. • The problem of solid waste is more severe in urban areas. • Improper disposal methods. • The per capita municipal solid waste (MSW) generated daily in India ranges from about 100 g in small towns to 500 g in large towns (Singhal and Pandey, 2001). • Contd. . .
Contd…. . ØOpen dumping of garbage facilitates the breeding for disease vectors. ØMSWM is not taken up seriously either by public or by concerned authority in most places. ØDiversified nature of solid waste. ØThe present study has been carried out in three municipalities of Manipur, NE India and highlights the participation of NGOs and other community based organisations in the management process.
STUDY AREA Districts Area Location Population Density Imphal (East and West) 1, 22, 800 (hectares) 24 o 33´ N to 25 o 55´ N latitudes and 93 o 42´ E to 94 o 7´ E longitudes 8, 39, 258 856 and 557 persons/sq. km for East & West respectively Thoubal 514 (sq. km) 23 o 45´ N and 24 o 45´ N latitude and 93 o 45´ E and 94015´ E longitude. 3, 64, 140 708 persons per sq. km. Bishnupur 496 sq. km. 24 o 15´ and 24 o 45´ N latitudes and 93 o 30´ and 94 o 0´ E longitudes 2, 08, 369 420 persons per sq. km
WASTE SAMPLING LOCATIONS Name of Municipality Sampling locations Imphal Municipality S-1 Lamphel disposal site, S-2 Nagamapal, S-3 Sanjenthong officer’s quarter, S-4 Sangolband Moirang leirak Machin and S-5 Iroisemba Community Hall represents disposal area, market, high income, mixed and low income areas respectively. Thoubal Municipality T-1 Disposal site, T-2 Thoubal Achouba, T-3 Athokpam makha, T-4 Thoubal wangmataba parking and T-5 Thoubal Khunou represents disposal area, market, high income, mixed and low income areas respectively. Bishnupur Municipality B-1 Disposal site, B-2 Bishnupur bazar, B-3 Thiyam Leikai, B-4 Behind District Library and B-5 Chothe represents disposal area, market, high income, mixed and low income areas respectively.
METHODOLOGY Ø The waste samples were collected from each sampling site taking 10 grabs samples(to make 1 kg each) from different areas of the waste heap at a particular sampling site and then mixed thoroughly to get a composite sample for each sampling location (Nanda et al. , 2003, Ingle and Mali, 2000). Ø The samples were then segregated in different components. The contents of each component were weighted on wet weight basis and results were expressed in percentage (Malviya et al. , 2002). Contd. . .
contd • The average of weighted components of the five sampling locations of each study sites was calculated. • The data for the study is collected largely from the primary sources and also from the secondary data. • Data about quantity of municipal solid waste, daily disposal system, and availability of containers, collection frequency and vehicles used in transportation was collected from the municipal authority and also verified during field survey. • Secondary as well as primary data was collected on the participation of NGOs and community based organisation. Interviews were conducted with residents to obtain data.