Multnomah County What Works Conference Craig Prins Executive


- Slides: 43
Multnomah County What Works Conference Craig Prins, Executive Director Michael Wilson, Economist Criminal Justice Commission 1
Outline o o o Crime Rates Incarceration and spending trends Sentencing Risk Assessment Cost-Benefit 2
Oregon’s Crime Rates 3
How do we measure crime? o FBI reports on two key measures o Violent Crime Index n Murder, Forcible Rape, Robbery, Aggravated Assault o Property Crime Index n Burglary, Larceny Theft, Motor Vehicle Theft, Arson o Only certain offenses “made known” to law enforcement o Statewide Crime Rate o National, historical comparisons 4
Oregon’s Violent Crime Drop was Larger than the Nation o Violent crime in Oregon fell by 2% from 2008 to 2009, lowest rate since 1969 o From 2004 to 2009 violent crime dropped 15% (5 th largest drop of all states) and from 1995 to 2009 dropped 51% (2 nd largest drop behind NY) 5
Long term Context for Violent Crime Rate o Oregon and the US have a similar long-term trend 6
Violent crime in Oregon o Decreases in violent crime in Oregon can largely be attributed to decreases in Portland 7
Oregon’s Property Crime Drop was Larger than the Nation o Property crime in Oregon fell by 10% from 2008 to 2009, lowest rate since 1966 o First time Oregon has been below the U. S. average since comparable data were collected beginning in 1960 o From 2004 to 2009 the property crime rate dropped 36% (largest drop of all states) and from 1995 to 2009 dropped 51% (3 rd largest drop) 8
Similar trends with property crime 9
Oregon’s Incarceration and Public Safety Spending 10
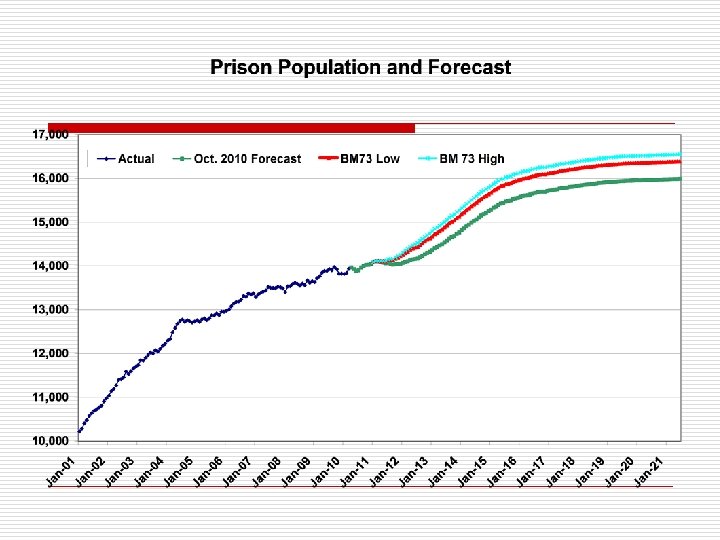
Incarceration Trends o Below U. S. average – 28 th highest o Since the 90’s Oregon’s incarceration rate has increased faster than the U. S. average o M 73 and reinstatement of M 57 will cause the forecast to continue to grow 11
Prison Incarceration Rate Comparison 5. 0 4. 5 State Total Oregon Incarceration Rate Per 1, 000 4. 0 Washington 3. 5 3. 0 2. 5 2. 0 1. 5 1. 0 0. 5 0. 0 1982 1984 1986 1988 1990 1992 1994 1996 1998 2000 2002 2004 2006 2008 12
General Fund Growth by Category o Inflation adjusted criminal justice spending per household has more than doubled since 85 -87, mostly due to DOC (up 217%) o Courts includes the criminal portion of OJD, Public Defense and the District Attorney’s and their Deputies 14
15
Oregon’s Sentencing Structure 16
Oregon’s Sentencing Structure o Sentencing Guidelines, 1989 o Mandatory, Appellate review n Offender’s criminal history n Severity of Offense n “substantial and compelling” departure Superseded by mandatory minimums and other sentencing enhancements n n Measure 11, 1995 Repeat Property Offender, 1997 Measure 57 (suspended), 2009 Measure 73, 2010
Oregon Sentencing o Pre-Guidelines n n Judge and Parole Board control sentence Release Matrix implemented 1975 to 1987 prison population doubled 1980 federal decree to reduce (vacated) o 1989 “capacity based” guidelines n Legislative control o 1994 Citizen Control n DA control through application
Most Prison Intakes are Impacted by Voter Approved Initiatives 19
20
How is Measure 11 Applied? o Impacts more than 50% of prison months o M 11 conviction implies mandatory minimum sentence … in most cases o District Attorneys exercise discretion n Charging decisions n Pursuing M 11 convictions o Data show variation across n Counties n Crimes 21
Conviction of the Most Serious Charge Varies by County (The 5 largest counties are listed) 22
23
Critical Sentencing Question o Which actor in the criminal justice system is best situated to apply sentencing law in an individual case? o Should a party opponent or the judge evaluate the offense, the offender, and the impact to the victim o 22 states and federal system answer that a guidelines system is the best balance of legislative, executive, and judicial powers
Modern Sentencing Guidelines o Discretion moved back to neutral judicial officer o Use 9000 beds built since 1989 o Guide discretion openly and transparently- currently unknown o Guided by last 20 years of corrections research and literature o More convictions for crime actually committed 25
Risk Assessment Tool 26
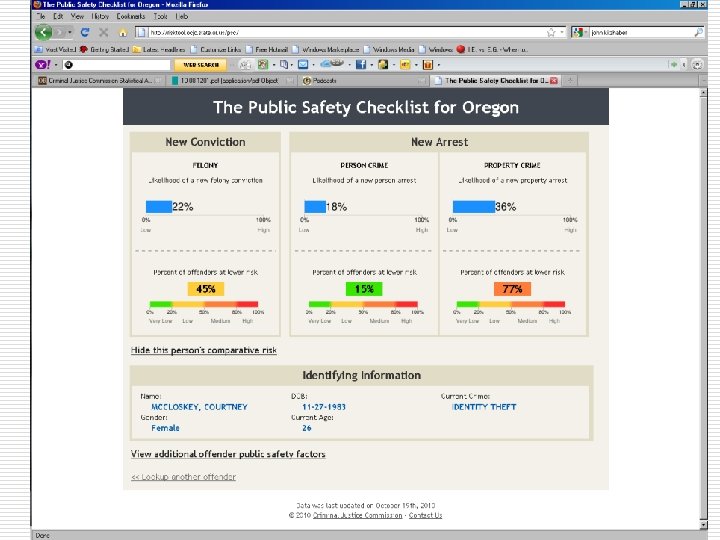
What Does the Risk Assessment Tool Do? o Provides a quick, objective, validated assessment of the probability an offender will be re-convicted of a felony or re-arrested for a person or property offense based on historical Oregon data and the offender’s age, gender, and criminal history. o Group Dynamics to inform individual decision-making 28
Where does it fit in Oregon sentencing? o Today: Laws for the punishment of crime shall be founded on these principles: protection of society, personal responsibility, accountability for one's actions and reformation. o Pre 1996: Laws for the punishment of crime shall be founded on the principles of reformation, and not of vindictive justice. 29
Principles of Sentencing Relevant information for right side doesn’t help the left side o o o o o Personal responsibility Accountability Past Oriented Public Values Just Deserts Blameworthiness Seriousness of Offense Culpability Uniformity Proportionality o o o o o Protection of Society Reformation Future Oriented Public Safety Reduce Recidivism Crime Reduction Incapacitation Deterrence Differentiate Individualized 30
Why does risk matter in sentencing? o Examine property offenders from 2005 -2007 o Examined their risk of being reconvicted of a felony o Overlap where some high risk property offenders were sentenced to prison and some low risk property offenders were sentenced to probation o By using risk at sentencing it is possible to save prison beds while keeping crime constant or to reduce crime while keeping beds constant 31
Distribution of Risk Scores by Sentence Type for Property Offenders Low Risk Prisoners High Risk Probationers 32
What if we swap some of the high-risk probationers with lower-risk prisoners? – There are 781 lower risk prisoners who would have had an estimated 894 arrests if they had been on probation – There are 552 high risk probationers who had 938 arrests while on probation • If we swap these groups we save 229 prison beds and have 44 less arrests in the community
Cost Benefit Analysis 34
What are the soundest investments of taxpayer dollars to increase safety? o Prisons n Have an impact on reducing crime n Also further “just deserts” purpose of sentencing n Certain outcome (Incapacitate) n Expensive ($84/day) o Programs n n Have an impact on reducing crime Experts determine outcome (What Works? ) Less expensive 93% of Oregon offenders leave prison 35
What is cost-benefit analysis? Move beyond “cutting costs” Analyze decisions like a business Return on Investment Bang for your buck A ratio of expected crime avoided per dollar o Puts structure to this discussion o Outcome is maximized crime reduction for dollars invested o o o 36
Where do we invest when we must reduce overall allocation? o Declining state budget will require Oregon to consider decreasing the prison population n Benefit of tax payer savings n Cost of increased crime o Re-Investing some of the tax payer savings in the right programs can result in a win for both tax payers and potential crime victims 37
Cost-Benefit and Programs o Are there programs effective at reducing crime? n Meta-Analysis o Based on available research o Washington State Institute of Public Policy analyzed 571 studies to see what works n In state evaluations o Apply cost-benefit analysis to programs that reduce crime 38
WSIPP Tool o Cost-Benefit tool to be used by states to examine criminal justice reinvestment o Estimates tax payers avoided costs as well as crime changes from sentencing changes o Estimates impact from policy choices and how likely it is the crime impact will be favorable 39
40
Limitations of CBA in criminal justice Requires investment of dollars Requires time for benefit to accrue Requires data on costs and programs Risk Adverse Investors on 2 year cycle o “Past performance does not guarantee future results” o o 41
Summary o Crime is down o Incarceration and Spending is up o Most prison intakes are impacted by voter initiatives o If risk to reoffend is used in sentencing decisions we can reduce prison beds without increasing crime o Can reduce crime and spending by using cost-benefit to wisely invest in programs 42
For More Information Contact. . . • Craig Prins Executive Director, Criminal Justice Commission Craig. Prins@state. or. us (503) 378 -4858 • Michael Wilson Economist, Criminal Justice Commission Michael. K. Wilson@state. or. us (503) 378 -4850