
Multiple Resource Theory as a Computational Model ANDREW

- Slides: 35
Multiple Resource Theory as a Computational Model ANDREW BECK PSYC 792 MARCH 1, 2012
Components of the Computational Model DIFFERENT RESOURCES TASK ANALYSIS SHELL CONFLICT MATRIX COMPUTATIONAL FORMULA TOTAL INTERFERENCE VALUES
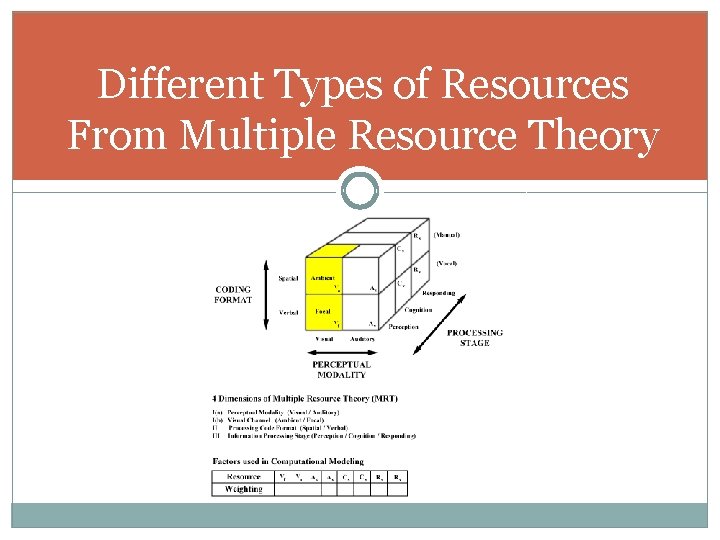
Different Types of Resources From Multiple Resource Theory
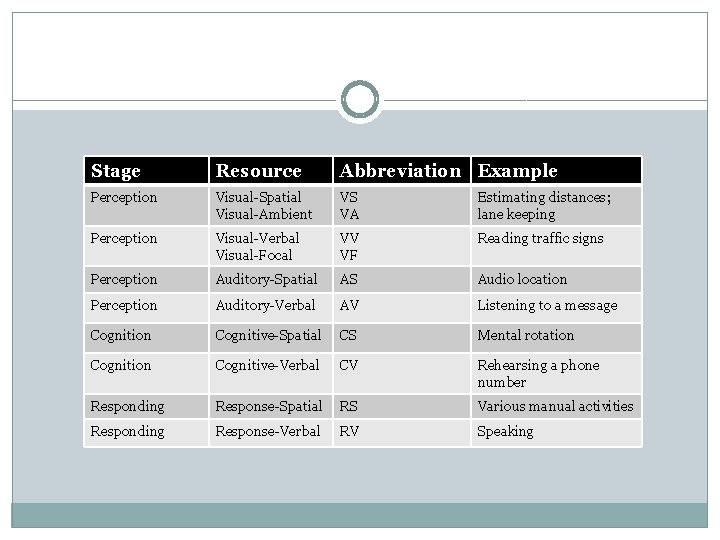
Stage Resource Abbreviation Example Perception Visual-Spatial Visual-Ambient VS VA Estimating distances; lane keeping Perception Visual-Verbal Visual-Focal VV VF Reading traffic signs Perception Auditory-Spatial AS Audio location Perception Auditory-Verbal AV Listening to a message Cognition Cognitive-Spatial CS Mental rotation Cognitive-Verbal CV Rehearsing a phone number Responding Response-Spatial RS Various manual activities Responding Response-Verbal RV Speaking
Task Analysis Shell DEMAND SCALARS DEMAND VECTORS
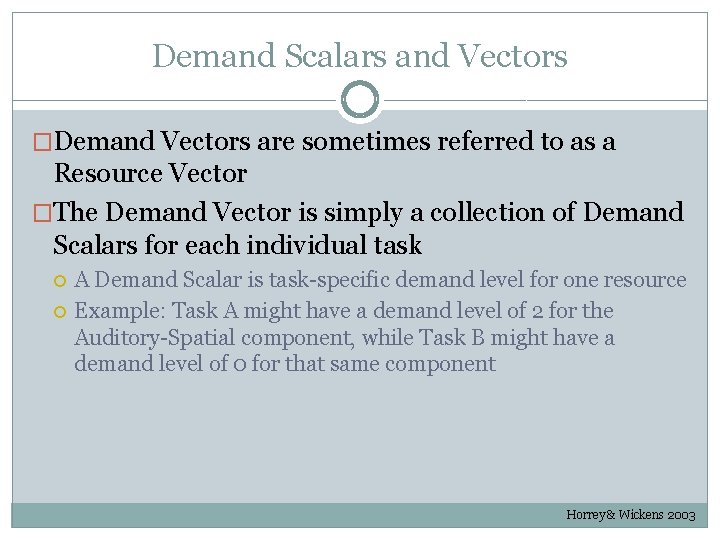
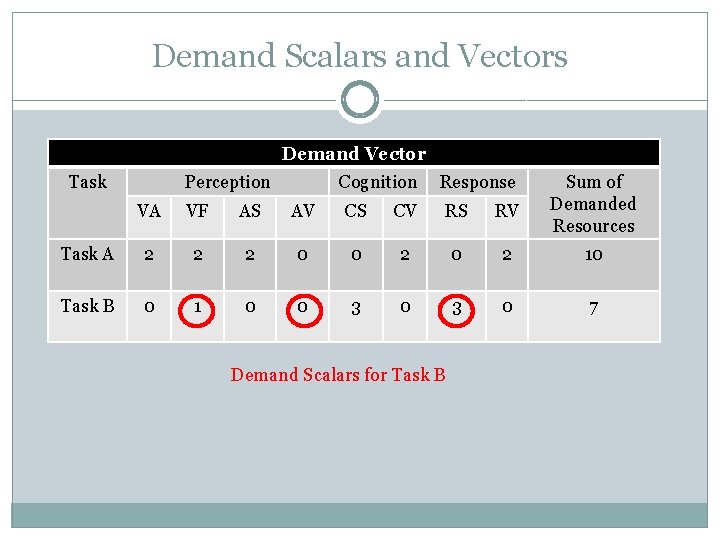
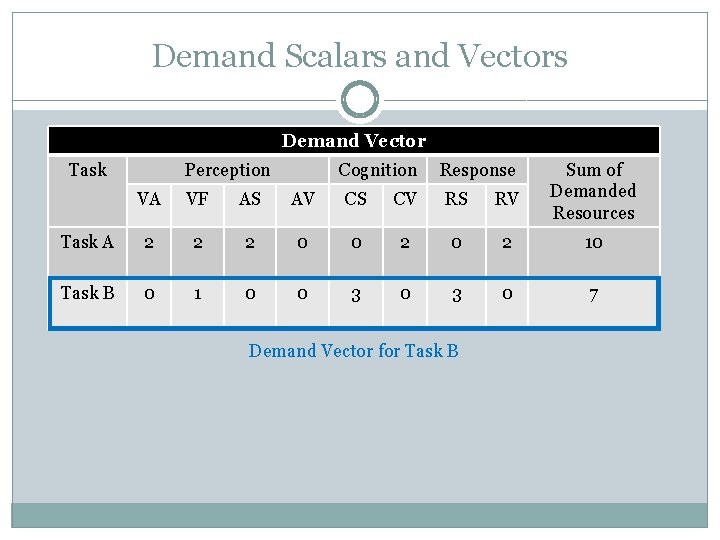
Demand Scalars and Vectors �Demand Vectors are sometimes referred to as a Resource Vector �The Demand Vector is simply a collection of Demand Scalars for each individual task A Demand Scalar is task-specific demand level for one resource Example: Task A might have a demand level of 2 for the Auditory-Spatial component, while Task B might have a demand level of 0 for that same component Horrey & Wickens 2003
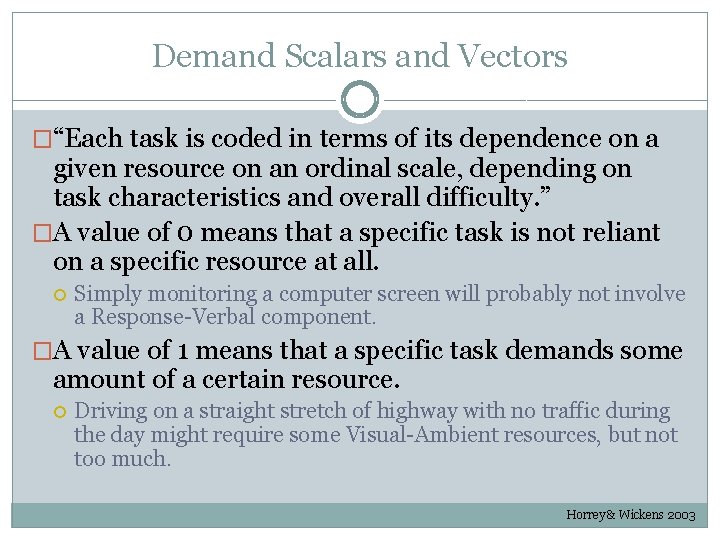
Demand Scalars and Vectors �“Each task is coded in terms of its dependence on a given resource on an ordinal scale, depending on task characteristics and overall difficulty. ” �A value of 0 means that a specific task is not reliant on a specific resource at all. Simply monitoring a computer screen will probably not involve a Response-Verbal component. �A value of 1 means that a specific task demands some amount of a certain resource. Driving on a straight stretch of highway with no traffic during the day might require some Visual-Ambient resources, but not too much. Horrey & Wickens 2003
Demand Scalars and Vectors �As tasks become more complex, this value may increase to 2 or 3. For most applications, a coding system of three levels (0, 1, 2) is adequate. Horrey & Wickens 2003
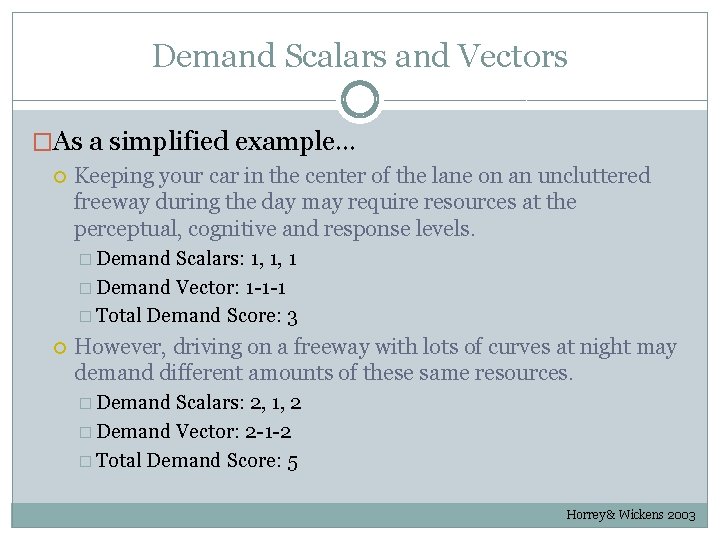
Demand Scalars and Vectors �As a simplified example… Keeping your car in the center of the lane on an uncluttered freeway during the day may require resources at the perceptual, cognitive and response levels. � Demand Scalars: 1, 1, 1 � Demand Vector: 1 -1 -1 � Total Demand Score: 3 However, driving on a freeway with lots of curves at night may demand different amounts of these same resources. � Demand Scalars: 2, 1, 2 � Demand Vector: 2 -1 -2 � Total Demand Score: 5 Horrey & Wickens 2003
Demand Scalars and Vectors Demand Vector Task Perception Cognition Response VA VF AS AV CS CV RS RV Sum of Demanded Resources Task A 2 2 2 0 0 2 10 Task B 0 1 0 0 3 0 7 Demand Scalars for Task B
Demand Scalars and Vectors Demand Vector Task Perception Cognition Response VA VF AS AV CS CV RS RV Sum of Demanded Resources Task A 2 2 2 0 0 2 10 Task B 0 1 0 0 3 0 7 Demand Vector for Task B
Conflict Matrix
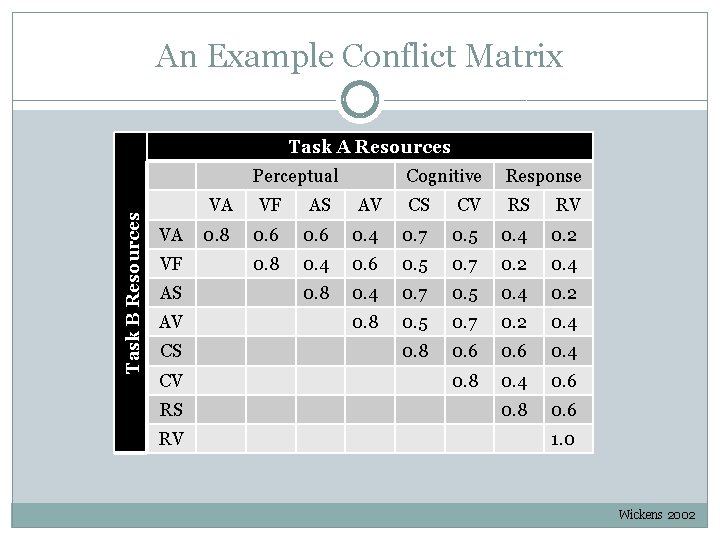
An Example Conflict Matrix Task A Resources Task B Resources Perceptual VA VF AS AV CS CV RS RV Cognitive Response VA VF AS AV CS CV RS RV 0. 8 0. 6 0. 4 0. 7 0. 5 0. 4 0. 2 0. 8 0. 4 0. 6 0. 5 0. 7 0. 2 0. 4 0. 8 0. 4 0. 7 0. 5 0. 4 0. 2 0. 8 0. 5 0. 7 0. 2 0. 4 0. 8 0. 6 0. 4 0. 8 0. 4 0. 6 0. 8 0. 6 1. 0 Wickens 2002
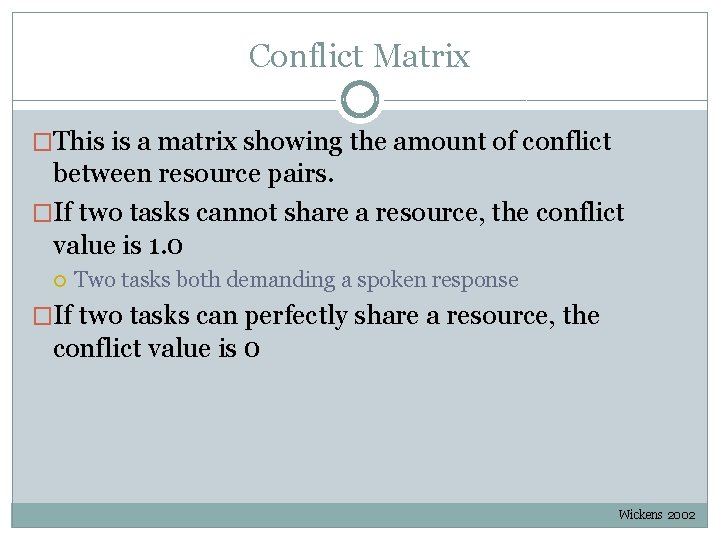
Conflict Matrix �This is a matrix showing the amount of conflict between resource pairs. �If two tasks cannot share a resource, the conflict value is 1. 0 Two tasks both demanding a spoken response �If two tasks can perfectly share a resource, the conflict value is 0 Wickens 2002
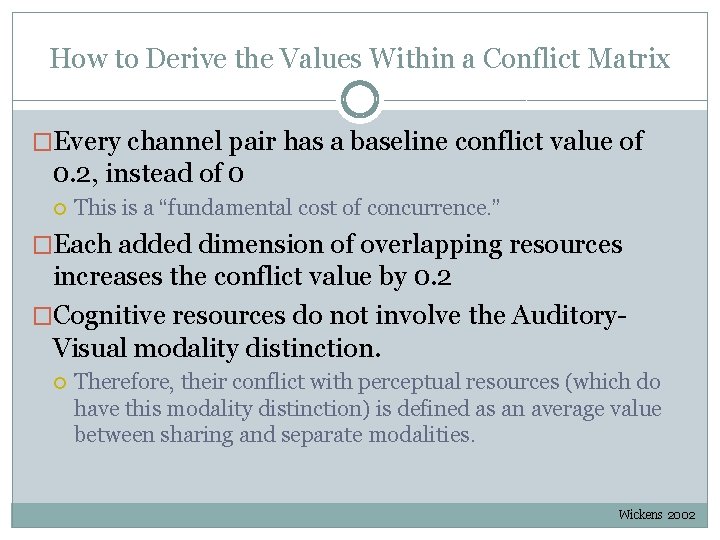
How to Derive the Values Within a Conflict Matrix �Every channel pair has a baseline conflict value of 0. 2, instead of 0 This is a “fundamental cost of concurrence. ” �Each added dimension of overlapping resources increases the conflict value by 0. 2 �Cognitive resources do not involve the Auditory. Visual modality distinction. Therefore, their conflict with perceptual resources (which do have this modality distinction) is defined as an average value between sharing and separate modalities. Wickens 2002
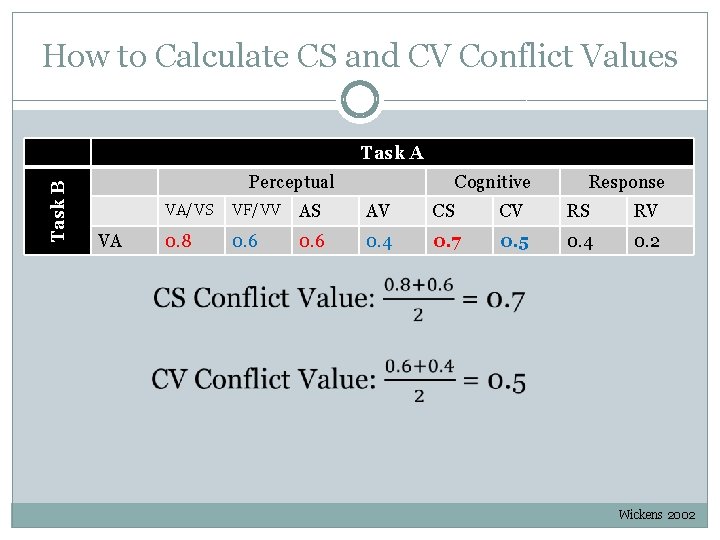
How to Calculate CS and CV Conflict Values Task B Task A Perceptual VA Cognitive Response VA/VS VF/VV AS AV CS CV RS RV 0. 8 0. 6 0. 4 0. 7 0. 5 0. 4 0. 2 Wickens 2002
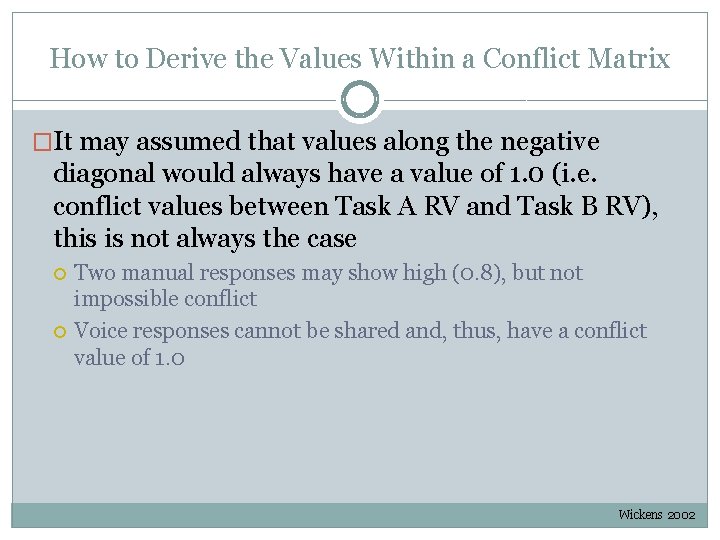
How to Derive the Values Within a Conflict Matrix �It may assumed that values along the negative diagonal would always have a value of 1. 0 (i. e. conflict values between Task A RV and Task B RV), this is not always the case Two manual responses may show high (0. 8), but not impossible conflict Voice responses cannot be shared and, thus, have a conflict value of 1. 0 Wickens 2002
How to Derive the Values Within a Conflict Matrix �Lastly, conflict values may be adjusted in certain circumstances to account for the physical separation of the two channels in question. The conflict value on the Visual-Focal channel may be lowered if the two visual sources are physically close together, rather than far apart. Wickens 2002
Computational Formula DEMAND COMPONENT CONFLICT COMPONENT
Computational Formula Components �The computational formula consists of two components: �Demand Component This component penalizes the pair of tasks for its total resource demand value �Conflict Component This component penalizes the pair of tasks according to the degree of conflict between resource pairs with non-zero conflict values. Wickens 2002
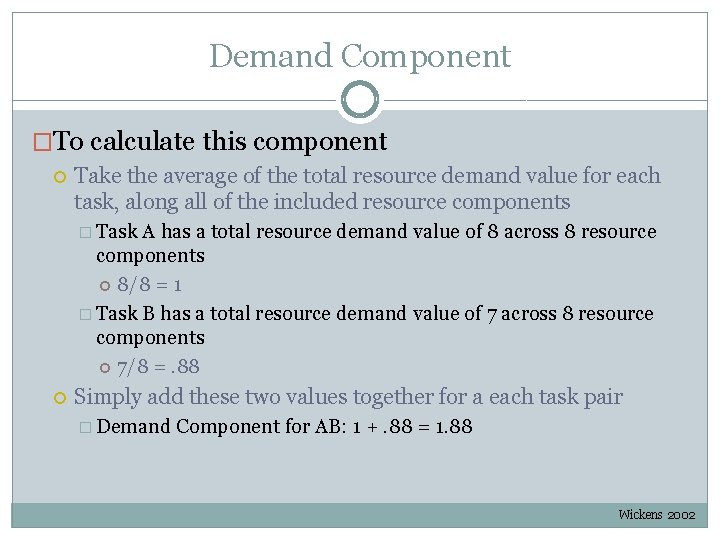
Demand Component �To calculate this component Take the average of the total resource demand value for each task, along all of the included resource components � Task A has a total resource demand value of 8 across 8 resource components 8/8 = 1 � Task B has a total resource demand value of 7 across 8 resource components 7/8 =. 88 Simply add these two values together for a each task pair � Demand Component for AB: 1 +. 88 = 1. 88 Wickens 2002
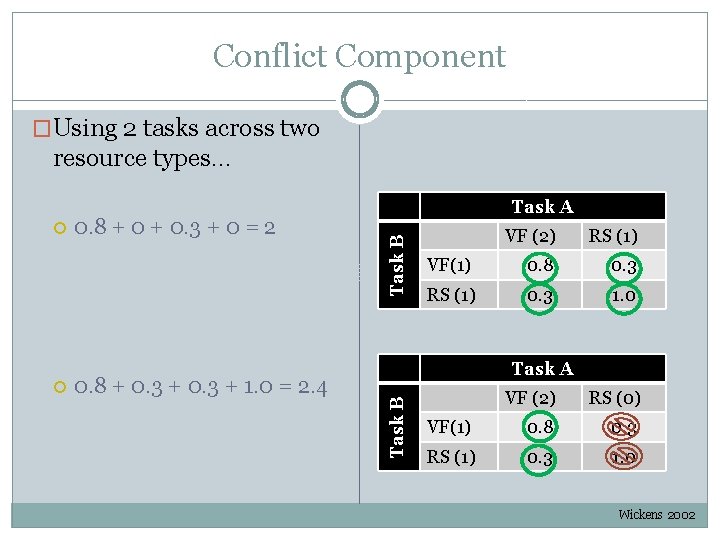
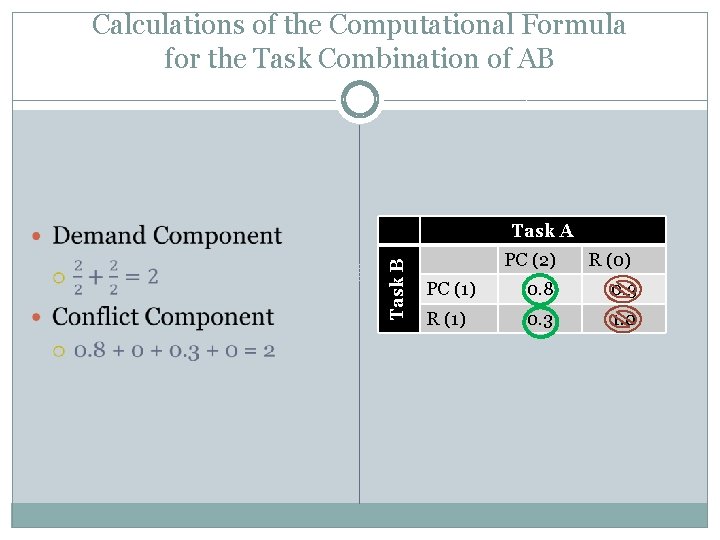
Conflict Component �Using 2 tasks across two resource types… 0. 8 + 0. 3 + 1. 0 = 2. 4 Task B 0. 8 + 0. 3 + 0 = 2 VF (2) RS (1) VF(1) 0. 8 0. 3 RS (1) 0. 3 1. 0 Task A Task B Task A VF (2) RS (0) VF(1) 0. 8 0. 3 RS (1) 0. 3 1. 0 Wickens 2002
Total Interference Value
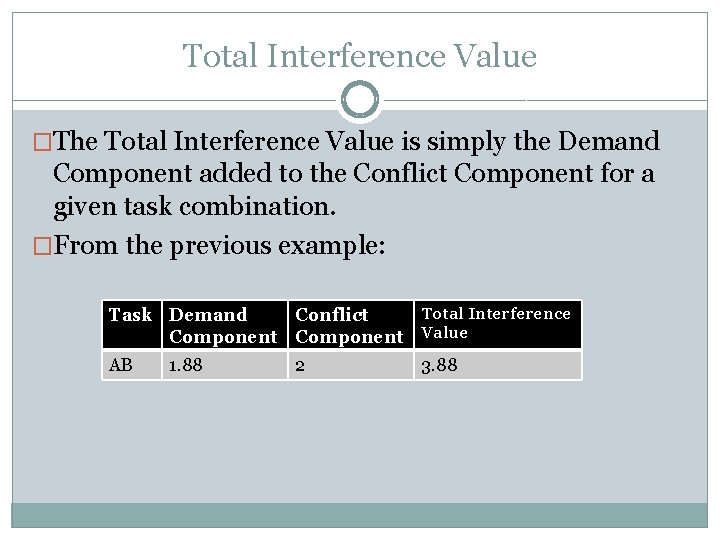
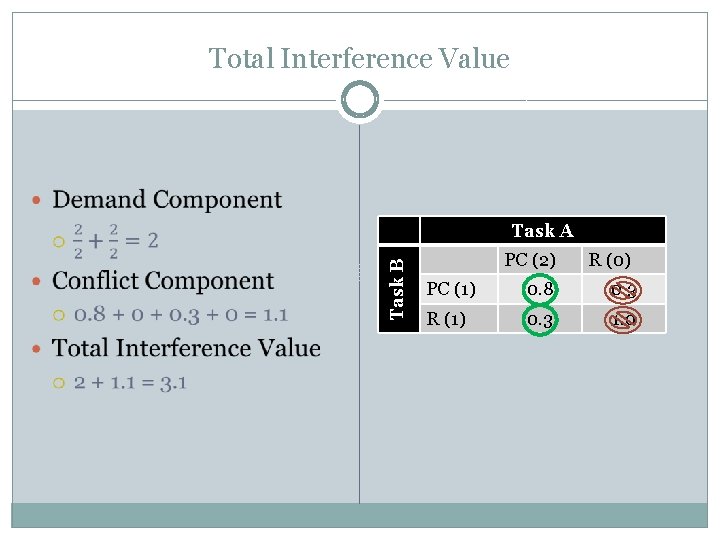
Total Interference Value �The Total Interference Value is simply the Demand Component added to the Conflict Component for a given task combination. �From the previous example: Total Interference Task Demand Conflict Component Value AB 1. 88 2 3. 88
Total Interference Value �The Total Interference Value for a task pair is a relative value, not an absolute value.
A Simplified Example FROM WICKENS 2002
Components of the Computational Model �Different Tasks �Different Resources �Demand Scalars �Demand Vectors �Conflict Matrix �Computational Formula �Total Interference Value
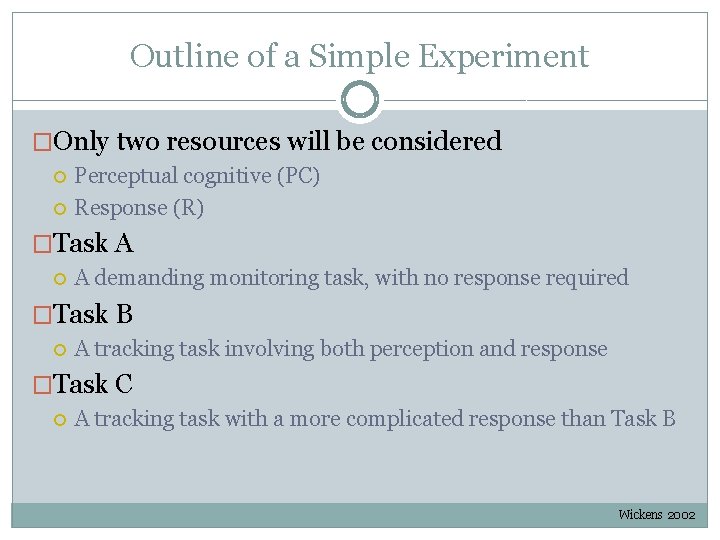
Outline of a Simple Experiment �Only two resources will be considered Perceptual cognitive (PC) Response (R) �Task A A demanding monitoring task, with no response required �Task B A tracking task involving both perception and response �Task C A tracking task with a more complicated response than Task B Wickens 2002
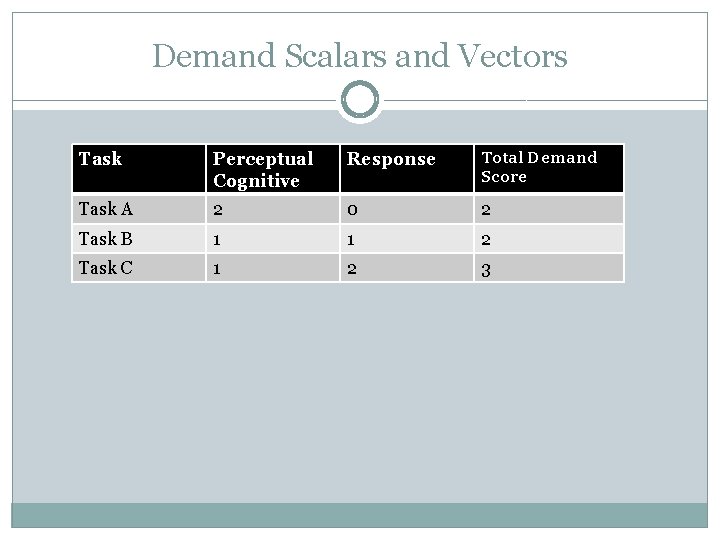
Demand Scalars and Vectors Task Perceptual Cognitive Response Total Demand Score Task A 2 0 2 Task B 1 1 2 Task C 1 2 3
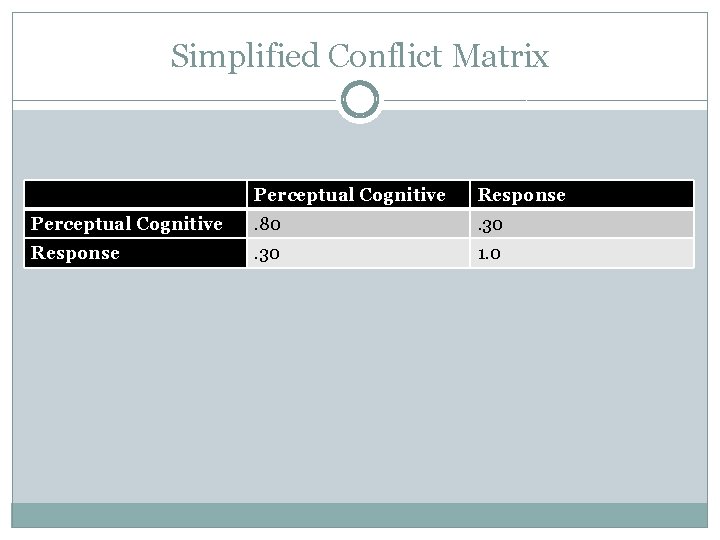
Simplified Conflict Matrix Perceptual Cognitive Response Perceptual Cognitive . 80 . 30 Response . 30 1. 0
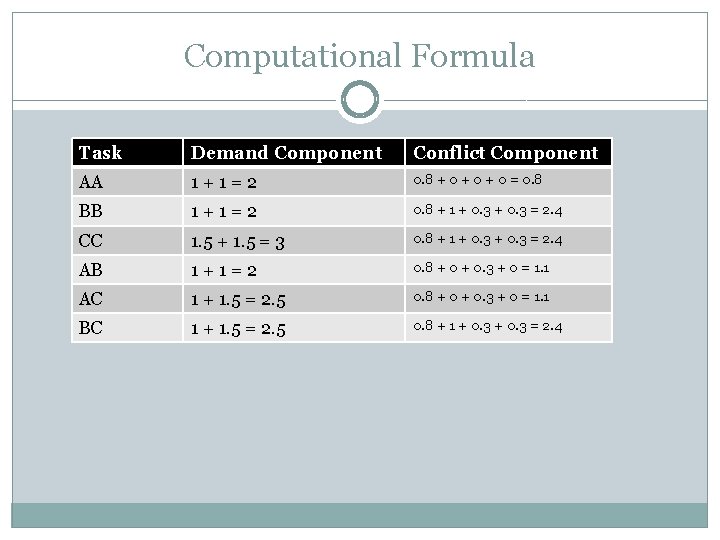
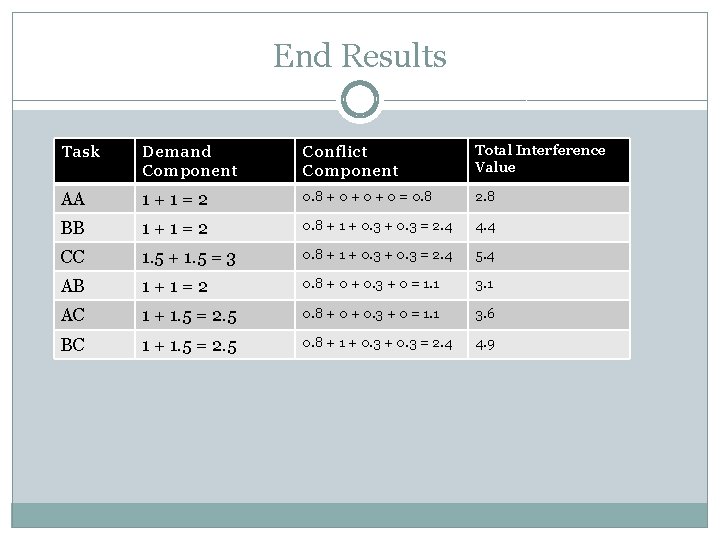
Computational Formula Task Demand Component Conflict Component AA 1 + 1 = 2 0. 8 + 0 + 0 = 0. 8 BB 1 + 1 = 2 0. 8 + 1 + 0. 3 = 2. 4 CC 1. 5 + 1. 5 = 3 0. 8 + 1 + 0. 3 = 2. 4 AB 1 + 1 = 2 0. 8 + 0. 3 + 0 = 1. 1 AC 1 + 1. 5 = 2. 5 0. 8 + 0. 3 + 0 = 1. 1 BC 1 + 1. 5 = 2. 5 0. 8 + 1 + 0. 3 = 2. 4
Calculations of the Computational Formula for the Task Combination of AB Task B Task A PC (2) R (0) PC (1) 0. 8 0. 3 R (1) 0. 3 1. 0
Total Interference Value Task B Task A PC (2) R (0) PC (1) 0. 8 0. 3 R (1) 0. 3 1. 0
End Results Task Demand Component Conflict Component Total Interference Value AA 1 + 1 = 2 0. 8 + 0 + 0 = 0. 8 2. 8 BB 1 + 1 = 2 0. 8 + 1 + 0. 3 = 2. 4 4. 4 CC 1. 5 + 1. 5 = 3 0. 8 + 1 + 0. 3 = 2. 4 5. 4 AB 1 + 1 = 2 0. 8 + 0. 3 + 0 = 1. 1 3. 1 AC 1 + 1. 5 = 2. 5 0. 8 + 0. 3 + 0 = 1. 1 3. 6 BC 1 + 1. 5 = 2. 5 0. 8 + 1 + 0. 3 = 2. 4 4. 9
References � Horrey, W. J. & Wickens, C. D. (2003). Multiple resource modeling of task interference in vehicle control, hazard awareness and in-vehicle task performance. Proceedings of the 2 nd International Symposium on Human Factors in Driving Assessment, Training and Vehicle Design. Park City, UT. � Wickens, C. D. (2002). Multiple resources and performance prediction. Theoretical Issues in Ergonomic Science, 3(2), 159 -177.