Multiple Myeloma Joan Blad Asuncin 8 de julio

Multiple Myeloma Joan Bladé Asunción, 8 de julio de 2011

MONOCLONAL GAMMOPATHIES I. MALIGNANT 1. Multiple myeloma 2. Variants of myeloma n n 3. Localized plasmacytomas n n Solitary plasmacytoma (bone) Extramedullary plasmacytoma Waldenström’s macroglobulinemia 5. Primary amyloidosis NON-MALIGNANT 1. Monoclonal gammopathy of undetermined significance 2. Transient MG: HIV infection, bone marrow trasplant, organ trasplant (liver, kidney) 4. II. Smoldering myeloma Non-secretor Plasma cell leukemia POEMS
 Diagnostic Criteria* n Serum M protein size <3")
Monoclonal Gammopathy of Undetermined Significance (MGUS) Diagnostic Criteria* n Serum M protein size <3 g/d. L n Bone marrow plasma cells <10% n No clinical manifestations or other laboratory abnormalities attributable to the monoclonal gammopathy The International Myeloma Working Group. Br J Haematol 2003; 121: 749 -757.


Malignant Transformation of MGUS n Actuarial probability: n 1% per year (30% at 25 yrs) n Actual probability (considering competing causes of death): n 11% at 25 yrs

Factors Predicting Malignant Transformation in MGUS § M-protein size § Ig. A type § Abnormal free-light chain ratio § Aberrant phenotype (>95%) § “Evolving” vs “Non-evolving”

MGUS. Predictors of Malignant Transformation RR 95% Confidence Interval p-value Evolving vs non-evolving 12. 14 5. 80 -25. 40 <0. 0001 Ig. A vs others 2. 92 1. 36 -6. 28 0. 006 M-protein (≥ 15 g/L) 2. 18 1. 02 -4. 66 0. 044 Feature

Evolving vs. Non-evolving MGUS Evolving Non-evolving
 Ratio: an Independent Risk Factor for Progression Risk")
MGUS Serum Free Light Chain (FLC) Ratio: an Independent Risk Factor for Progression Risk at 20 years HIGH-RISK Abnormal FLC ratio, non-Ig. G and M-protein 15 g/L 58% LOW-RISK Normal FLC ratio, Ig. G-type and M-protein <15 g/L 5% Rajkumar et al. Haematologica / The Hematology Journal 2005; S 1: 194. Rajkumar et al. Blood 2005; 106: 812 -817.
")
Smoldering Multiple Myeloma (Asymptomatic Myeloma)
 Diagnostic Criteria* § Serum M protein size ≥ 3")
Smoldering Multiple Myeloma (Asymptomatic Myeloma) Diagnostic Criteria* § Serum M protein size ≥ 3 g/d. L and/or urine light chain ≥ 1 g/24 hours and/or bone marrow clonal plasma cells ≥ 10% § No related organ tissue impairment (no end organ damage including bone lesions) or symptoms * The International Myeloma Working Group. Br J Haematol 2003; 121: 749 -757.

SMM. Evolution of the M-protein g/L 80 75 70 65 60 55 50 45 40 35 25 30 20 0 6 12 18 24 30 36 42 48 MONTHS Evolving 54 60 66 72 78 84 90 0 6 12 18 24 30 36 42 48 54 60 66 MONTHS Non-evolving 72 78 84 90

“Evolving” Smoldering Multiple Myeloma n Rising M-protein n Previously recognized MGUS n Chromosomal losses, 1 q gains n Response to therapy ( 50%) n Short time to symptomatic MM Rosiñol et al, Br J Haematol; 2003 Rosiñol et al, Br J Haematol; 2005

Monoclonal Gammopathies MM SMM MGUS “EVOLVING” “NON EVOLVING” Rosiñol et al. Br J Haematol 2003; 123: 631 -36. Rosiñol et al. Mayo Clin Proc 2007; 82: 428 -34.

SMM: Factors Predicting Progression § M-protein size ≥ 30 g/L and ≥ 10% BMPC § Abnormal free-light chain ratio § Aberrant phenotype (>95%) § Pattern of MRI § “Evolving” vs “Non-evolving”

Symptomatic Multiple Myeloma

Symptomatic Multiple Myeloma* n M-protein in serum and / or urine n Bone marrow (clonal) plasma cells or plasmacytoma** n Related organ or tissue impairment (end organ damage, including bone lesions) *Some patients may have no symptoms but have related organ or tissue impairment **If flow cytometry is performed, most plasma cells (>90%) will show a “neoplastic” phenotype
 (ROTI) due to the plasma cell")
Myeloma-related organ or tissue impairment (end organ damage) (ROTI) due to the plasma cell proliferative process n Increased serum Calcium n Renal insufficciency n Anaemia: haemoglobin 2 g/d. L below the lower normal limit n Bone lesions: lytic lesions or osteoporosis with compression fractures (MRI or CT may clarify) n Other: symptomatic hyperviscosity (rare), amyloidosis, recurrent bacterial infecitons (≥ episodes in 12 months), extramedullary plasmacytomas. CRAB (calcium, renal insufficiency, anaemia or bone lesions)

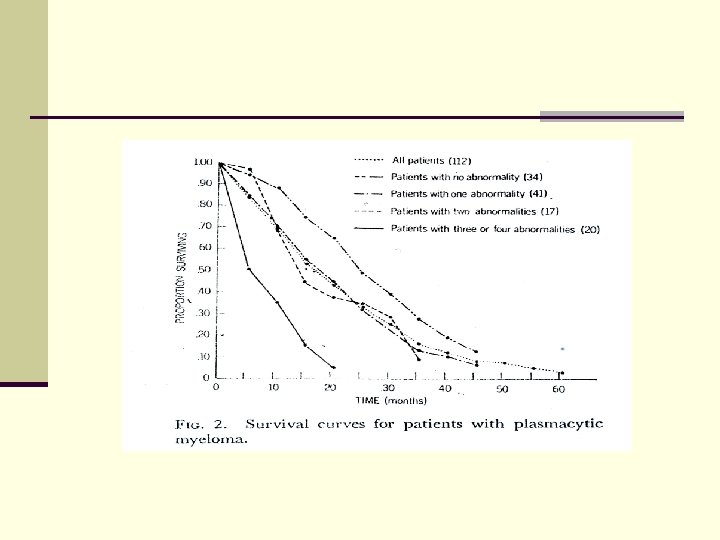
Am J Med, 42: 937 -948, June 1967


Prognostic Factors in MM n Prognostic value… n A new prognostic factor… n A simple reliable marker… n An easily available parameter… n An independent prognostic factor… n A new staging system… n Proposal for a novel prognostic index…

Prognostic Factors in MM n Clinical and laboratory features n Staging systems n Malignant clone: molecular genetic status n Response to therapy n Mechanisms of disease control/progression

Prognostic Factors in MM Clinical and Laboratory Features n Host characteristics n Age n PS n Tumor burden n β 2 -microglobulin n Organ damage n Renal function n Hb

Main Staging Systems in MM Author, year Durie and Salmon, 1975 Parameters Other Hb, Ca, M-protein, bone lesions Renal function %PC, Cr, and Ca (Ig. G) Hb, Ca, M-protein (Ig. A) Hb, urea, PS Cavo et al, 1989 D & S, platelet count Greipp et al, 1988 2 -microglobulin, LI Bladé et al, 1989 Albumin, urea San Miguel et al, 1989 Hb, Cr, PS, PI Merlini et al, 1980 MRC, 1980 San Miguel et al, 1995 IMWG, 2005 S-phase, 2 -microglobulin, age, PS 2 -microglobulin, albumin MRC: Medical Research Council; IMWG: International Myeloma Working Group; Hb: haemoglobin; Ca: calcium; PC: plasma cells; Cr: creatinine; Ig: Immunoglobulin; PS: performance status; LI: labelling index; PI: paraprotein index.
 Stage Overall Survival (months) I -2 M < 3. 5")
International Prognostic System (IPS) Stage Overall Survival (months) I -2 M < 3. 5 mg/L and albumin ≥ 3. 5 g/d. L 62 II -2 M < 3. 5 mg/L and albumin < 3. 5 g/d. L or -2 -m 3. 5 – 5. 4 mg/L 44 III -2 M ≥ 5. 5 mg/L 29 Greipp P et al. J Clin Oncol 2005; 23: 3412 -20.
(q")
Cytogenetic Prognostic Subgroups in Multiple Myeloma n Good/average prognosis n Hyperdiploidy n t(11; 14)(q 32; q 32): cyclin D 1 upregulation n Bad prognosis n Hypodiploidy n t(4; 14)(p 16. 3; q 32): FGFR 3&MMSET upregulation n t(14; 16)(q 32; q 23): c-MAF upregulation n Chromosome 1 abnormalities: 1 q gains (overexpression CKS 1 B) n 17 p deletions, 13 q deletions

13 q Deletion as Single Abnormality n No independent prognostic impact* * Gutiérrez N et al. Leukemia 2007; 21: 541 -9. * Avet-Loiseau H et al. Blood 2007; 109: 3489 -95.

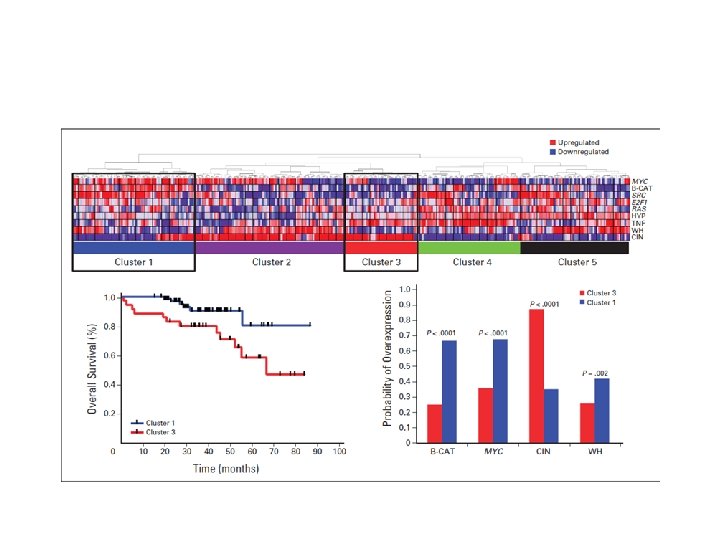
Molecular Myeloma Subgroups Gene Expression Profiling n “Translocation/Cyclin D” classification*: n 8 groups n Recurrent translocations/hyperdiploidy**: n 7 entities * Bergsagel PL et al. Blood 2005; 106: 296 -303. ** Zhan F et al. Blood 2006; 108: 2020 -8.
 n 4 different MM subtypes (recurrent")
High-resolution Genomic Profiles* (a. CGH/m. RNA microarray/FISH/novel bioinformatics) n 4 different MM subtypes (recurrent DNA copy number changes), i. e. : n Hyperdiploid, 11 q gains: good outcome n Hyperdiploid, 1 q gains and/or 13 losses: poor outcome * Carrasco R et al. Cancer Cell 2006; 4: 313 -25.

n GEP of tumor biology / chemotherapy sensitivity can refine the ISS classification

Response to Therapy as Prognostic Factor n Stabilization of disease n Impact of CR n With primary therapy n After HDT/SCT
 n FDG-PET/CT:")
Imaging Techniques with Prognostic Interest n MRI: number of focal lesions (FL) n FDG-PET/CT: n FDG suppression (SUV-FL) prior ASCT n Metastatic spread (EMD) Walker R, et al. J Clin Oncol 2007; 25: 1121 -1128 Bartel TB, et al. Blood 2009; 114: 2068 -2076

Novel Drugs and New Molecular Targets n Novel drugs can overcome drug resistance in poor cytogenetic subgroups n New therapies should target specific molecular pathways


First-line treatment for MM in 2010 • Patients eligible for HDT/SCT • Patients non-eligible for HDT/SCT

Patients eligible for HDT/SCT

• The crucial step for long-lasting response and prolonged survival is the achievement of CR postrasplant.
 CR Median: 6. 1 yrs PR")
TTP according response to transplant (CR vs. PR) CR Median: 6. 1 yrs PR Median: 1. 3 yrs P=0. 000001 Rovira et al. , EBMT 2009 (abstract P 592)
 CR Median: 9. 6 yrs")
Overall survival according response to transplant (CR vs. PR) CR Median: 9. 6 yrs PR Median: 4 yrs p=0. 0001 Rovira et al. , EBMT 2009 (abstract P 592)

Impact of Induction • CR postransplant depends on the effectiveness of the induction therapy
 Pvalue -")
CR after HDT According to Tumor Burden Pretransplant M-protein size CR (%) Pvalue - < 10 g/L 52 0. 01 - 10 g/L 15 Serum* Serum and urine** - < 10 g/L and < 0. 5 g/24 h 67 - 10 – 20 g/L and / or 0. 5 to 1 g/24 h 21 - > 20 g/L and / or > 1 g/24 h 7 0. 03 *Alexanian et al, BMT 2001; 27: 1037 -1043 ** Nadal et al, BMT 2004; 33: 61 -64

Treatment options for patients eligible for transplantation Induction ‘Traditional’ VAD Cy. Dex Bortezomib-based: Vel. Dex VTD PAD Stem cell harvest High-dose melphalan Stem cell infusion IMi. D-based: Thal/Dex TAD CTD Rd VRD

• Which is the best induction regimen?

Pre and Post-ASCT CR Rate with “old” Regimens* Regimen Pre-ASCT Post-ASCT Dexa/VAD 5% 35% Cyclophospha mide/Dexa 7% 32% VBMCP/VBAD 10% 35% *Bladé et al. Blood 2010; 115: 3655 -63; Bladé et al. Haematologica 2010; 95: 7024; Harousseau et al. JCO 2010; Mellqvist et al. Cancer 2008; 112: 129 -35; Rosiñol et al, IMW 2011

Pre and Post-ASCT CR Rate with “Novel” Induction Regimens* Regimen Pre-ASCT Post-ASCT Thal/Dex 6% 23 -34% Vel/Dex 12% 33% PAD-1 24% 43% 21 -30% 43 -52% - 56% at 2 yrs VTD Total Therapy III** *Cavo et al, Lancet 2010; Rosiñol et al, IMW 2011; Harousseau et al, Haematologica 2006; 91: 1498 -05; Rosiñol et al, JCO 2007; 25: 1498 -05; Popat et al, BJH 2008; 141: 512 -6; Barlogie et al, BJH 2007; 138: 176 -85. **VTD-PACE + Tandem ASCT + VTD/TD
 and or del 17 p). PETHEMA-GEM 05")
Bortezomib and high-risk cytogenetics (t (4; 14) and or del 17 p). PETHEMA-GEM 05 TD vs. VTD (GIMEMA) VBMCP/VBAD+bortezomib vs. TD vs. VTD (PETHEMA) VAD vs. VD (IFM 2005 -01) RC (%) P-value <10 vs. ~35* 0. 001 23 vs. 0 vs. 42 0. 003 3 vs. 18* 0. 07 *CR + n. CR Cavo et al, Lancet 2010; Rosiñol et al, IMW 2011; Harousseau et al, JCO 2010.

Progressive Disease in Pre-transplant Induction According to the Presence or Absence of EMP (PETHEMA-GEM 05) 27% vs. 12%, p=0. 01 VBCMP/VBAD + bortezomib (n=14) TD (n=20) VTD (n=21) EMP 29% 40% 14% No EMP 13% 18% 6% Rosiñol et al. IMW 2011

TO TRANSPLANT OR NO TO TRANSPLANT. . . THIS IS THE QUESTION!!!

Pre- and post-ASCT CR rate according to the induction regimen. PETHEMA-GEM 05. Pre-ASCT Post-ASCT VBMCP/VBAD + Bortezomib (%) 21 38 TD (%) 14 24 VTD (%) 35 46 Rosiñol et al. IMW 2011

Consolidation / maintenance therapy

Consolidation/maintenance therapy Thalidomide Pamidronate+thal vs pamidronate vs observation Thal+PDN vs PDN EFS/PFS OS 52% vs. 37% vs. 36% Longer survival if suboptimal response postransplant 42% vs. 23% Longer survival 86% vs 75% Shorter OS after relapse Thal vs observation 6 vs. 4. 1 yrs Thal vs. IFN 33 vs. 22 m Longer OS in patients with cytogenetic abnormalities Shorter OS after relapse Attal et al. Blood 2006; 108: 3289– 94; Spencer et al. J Clin Oncol 2009; 27: 1788– 93; Barlogie et al. N Engl J Med 2006; 354: 1021– 30; Blood 2008; 112: 3115– 21; Lokhorst et al. Blood 2010; 115: 1113 -20
 – Increase the postrasplant CR/n. CR •")
Consolidation/maintenance therapy • Bortezomib (x 6 cycles) – Increase the postrasplant CR/n. CR • Lenalidomide (x 2 cycles) – Improved postrasplant response Mellqvist et al, ASH 2009 (abstract 530) Attal et al, ASH 2009 (abstract 529)

Consolidation with VTD • • 39 patients in CR or VGPR post-ASCT Consolidation with 4 cycles of VTD Follow-up with RT-PCR Median follow-up: 32 months Complete molecular remission (n=6) Continued remissions Very low molecular tumor burden (N=19) High molecular tumor burden (n=13) 3 relapses 11 Relapses MRD (-) correlates with a very low probability of relapse Ladetto et al, JCO 2010; 28: 2077 -81

IFM 2005 -02: PFS from randomization p<10 -7 P < 10 -7 Attal et al, ASCO 2010 (abstract 8018)

Best treatment for younger patients Refined “Total Therapy”

Refined Total Therapy

Refined “Total Therapy” Triple induction regimen VTD? ASCT Consolidation Maintenance MEL-200 VRD? Len+glucocorticoids ±bortezomib

Patients non-eligible for HDT/SCT

Multiple myeloma in the elderly Results with “old” regimens • MP – CR: <5% – Median overall survival: 2 -3 yrs • Dex-based – CR <5% – Median overall survival: 2 -3 yrs

Expanding Treatment Options for Frontline Therapy of Elderly Patients with MM Alkylating agent-based • MPT (GIMEMA, IFM, NMSG, HOVON) • MPV (PETHEMA, VISTA) • MPR (GIMEMA) • CTD (MRC IX) Dexa-based • Thal/Dex (ECOG, Celgene 003, CEMSG) • Len/Dex (SWOG, ECOG, Others)

Unprecedented CR Rate with Novel plus Old Drugs in Non-transplant Candidates Regimen CR rate (%) MPT 1, 2 15 MPR 3 13 -18 MPV 4 30 Rev/Dex 5 or BIRD 6 1 Palumbo et al. Blood 2008; 112: 3107– 14 2 Facon et al. Lancet 2007; 370: 1209– 18 3 Palumbo et al. JCO; 25: 4459 -65 22 -37 4 San Miguel et al. N Engl J Med 2008; 359: 906 -17 5 Lacy et al. Mayo Clin Proc 2007; 82: 1179 -84 6 Niesvizky et al. Blood 2008; 111: 1101 -9
 Palumbo et al, 2008 Facon et al, 2007 Hulin")
MPT vs. MP CR (%) Palumbo et al, 2008 Facon et al, 2007 Hulin et al, 2009 Wijermans et al, 2010 Waage et al, 2010 PFS (%) OS (mos. ) 21. 8 vs 14. 5 45 vs. 47. 6 (p=NS) 27. 5 vs. 17. 8 51. 6 vs. 33. 2 (p=0. 0006) 7 vs. 1 24. 1 vs. 18. 5 44 vs. 29. 1 (p=0. 03) 2 vs. 2 15 vs. 11 (PFS) 13 vs. 9 (EFS) 40 vs. 31 (p=0. 05) 15 vs. 14 29 vs. 32 (p=NS) 16 vs. 4 13 vs. 2 13 vs. 4 Palumbo et al. Blood 2008; 112: 3107– 3114 Facon et al. Lancet 2007; 370: 1209– 1218 Hulin et al. J Clin Oncol 2009; 27: 3664– 3670 Wijermans et al. IMW 2009 (abstract 116) Wijermans et al. JCO 2010 Waage et al. Blood 2010

Proportion of surviving patients IFM 99 -06: overall survival 1. 0 Treatment 0. 8 MP MPT MEL 100 O/N 128/196 62/125 78/126 Overall survial time (months) median (SE) 33. 2(3. 2) 51. 6(4. 5) 38. 3(2. 7) 0. 6 0. 4 0. 2 Median follow-up time = 51. 5 months 0 0 12 24 36 48 60 72 84 Time from randomisation (months) Facon et al, Lancet 2007; 370: 1209 -18
 ORR 71 35 CR 30 4 Median")
VISTA trial: VMP vs. MP VMP (%) ORR 71 35 CR 30 4 Median time to first response (mos) 1. 4 4. 4 19. 9 13. 1 24 12. 8 Median duration of response • all responders (mos) • patients achieving CR (mos) San Miguel et al. N Engl J Med. 2008; 359: 906 -17
 ~52% reduced risk of progression with VMP")
Time to progression: Patients without event (%) ~52% reduced risk of progression with VMP 100 90 80 70 60 50 40 30 20 10 0 VMP MP VMP: 24. 0 months (83 events) MP: 16. 6 months (146 events) HR=0. 483, p<0. 000001 0 3 6 Number of patients at risk: VMP: 344 295 272 MP: 338 296 241 9 245 206 12 15 18 Time (months) 185 152 111 86 65 53 21 24 31 22 17 5 27 San Miguel et al. N Engl J Med. 2008; 359: 906 -17

OS: Confirmed survival benefit with VMP ~35% reduced risk of death with VMP Median follow-up 36. 7 months VMP Median OS: VMP: not reached MP: 43. 1 months P=0. 0008 3 -year OS: VMP: 68. 5%, MP: 54% MP Mateos et al. J Clin Oncol 2010; 28: 2259 -66

Thal/Dex vs. MP and Len/Dex vs. Len/dex • High dose dexamethasone – responses – toxicity – survival Ludwig et al, Blood 2009; 113: 3435 -42 Rajkumar et al, Lancet Oncol 2010; 11: 29 -37
 Multicenter, two-stage randomized trial in newly diagnosed MM patients older than 65")
(GEM 05>65) Multicenter, two-stage randomized trial in newly diagnosed MM patients older than 65 years (PETHEMA- GEM 05) Induction Maintenance Bort/Mel/Pred (VMP) vs Bort/Thal/Pred (VTP) Bort/Thal Bort/Pred (VT) (VP) Mateos et al, Lancet Oncol 2010

PETHEMA-GEM 05. Response rate to induction and maintenance therapy Induction Maintenance VMP VT VP CR (IF-) 20 27 44 39 CR(IF+) 12 10 15 16 PR 48 46 39 44 MR 10 6 2 1 Mateos et al, Lancet Oncol 2010
 • Peripheral neuropathy • Maintain efficacy Bringhen")
GIMEMA. VMP vs. VMPT (weekly bortezomib dosing) • Peripheral neuropathy • Maintain efficacy Bringhen S et al. Blood 2010

Choice of Treatment “Aggressive” disease “Non-aggressive” disease Poor cytogenetics Renal failure MPV MPT MPV Vel/Dex History of peripheral neuropathy Len-based Very elderly Logistics MPT (Thal 100 mg/d) MPT/ Len-based

Treatment of MM: ultimate goal Young patients Elderly patients Refined “Total Therapy” Increase the cure fraction Individualized sequential approach long-term disease control

Treatment of Relapsed Myeloma • Backbone of Treatment – Thalidomide – Bortezomib – Lenalidomide – HDT/Stem Cell Transplant (sensitive relapse)
 • Components of initial therapy • Degree/duration")
Treatment of Relapsed/Refractory Myeloma. General Considerations (I) • Components of initial therapy • Degree/duration of response to primary therapy – >2 years retreatment • Consider HDT/SCT (chemosensitive relapse)
 • Type of relapse – “aggressive” bortezomib-based")
Treatment of Relapsed/Refractory Myeloma. General Considerations (II) • Type of relapse – “aggressive” bortezomib-based – “non-aggressive” IMi. Ds-based • Previous toxicity – Peripheral neuropathy avoid bortezomib and thalidomide • Age and PS – Elderly and/or poor PS gentle approach
 CR(%) TTP OS Bort.")
Main randomized trials on treatment of relapsed/refractory myeloma Regimen ORR(%) CR(%) TTP OS Bort. vs. Dex 1 38 vs. 18 6 vs. 1 6. 2 vs. 3. 5 80 vs. 66% at 1 yr Bort. + Doxil vs. Bort 2 44 vs. 41 4 vs. 2 9. 3 vs. 6. 5 76 vs. 65% at 15 months Len/Dex vs. Dex 3 61 vs. 19. 9 14. 1 vs. 0. 6 11. 1 vs. 4. 7 29. 6 vs. 20. 2 months Len/Dex vs. Dex 4 60. 2 vs. 24 15. 9 vs. 3. 4 11. 3 vs. 4. 7 Not reached vs. 20. 6 months 1 Richardson et al. , 2005 APEX trial; 2 Orlowski et al. , 2007; 3 Weber et al. , 2007; 4 Dimopoulos et al. , 2007

Disease Evolution Sequential Therapy M/P Dex Len/Dex Vel IF- IF+ EP+

- Slides: 80