MultiDimensional Functions cs 5984 Information Visualization Chris North

 •")

 y x")
 • Height field: y")

 • Color")


 •")


: • < 6 d by 10 samples, ALL slices,")


- Slides: 18
Multi-Dimensional Functions cs 5984: Information Visualization Chris North
Multi-Dimensional Functions • y = f(x 1, x 2, x 3, …, xn) • Continuous: y = x 13 + 2 x 22 - 9 x 3 • Discrete: xi are sampled in a bounded region • Xi = [0, 1, 2, …, 100] • How is this different from Multi-Dimensional Data? • Huge scale: 6 D with 10 samples/D = 1, 000 data points • Data values at every point in the space
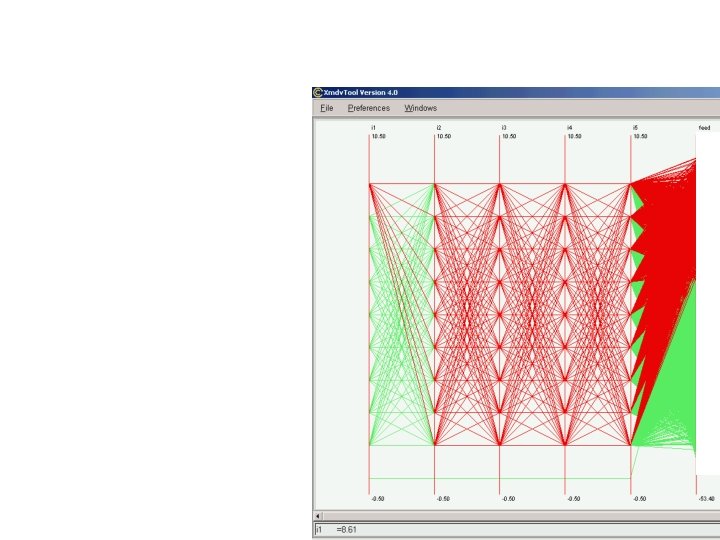
Multi-D Data Visualizations… • Don’t work well for multi-D functions • Example: 5 d func sampled on 1 -9 for all inputs Parallel coords
1 -D: Easy • y = f(x) y x
2 -D: Easy • y = f(x 1, x 2) • Height field: y x 2 x 1
2 -D: Easy • Color map: y color
3 -D: Hard • y = f(x 1, x 2, x 3) • Color cube: y color x 3 x 2 x 1 • What’s inside?
4 D: Really Hard • y = f(x 1, x 2, x 3, x 4, …, xn) • What does a 5 D space look like? !? • Approaches: • • Hierarchical axes (Mihalisin) Nested coordinate frames (Worlds within Worlds) Slicing (Hyper. Slice) Our spiffy new approach: Radial Focus+Context (Sanjini)
Hierarchical Axes • 1 D view of 3 D function: f(x 1, x 2, x 3) x 3 x 2 x 1 (Mihalisin et al. )
Hierarchical Axes • 2 D view of 4 D function (using color maps) • y = f(x 1, x 2, x 3, x 4, …, xn) • Discrete: xi = [0, 1, 2, 3, 4] x 3 x 1 x 2 y = f(x 1, x 2, 0, 0) as color x 4
Hierarchical Axes • Scale? • 6 d = 3 levels in the 2 d approach • 10 samples/d = 1, 000 data points = 1 screen • For more dimensions, zoom in on “blocks” • For alternate 2 d color maps, reorder dimensions
Nested Coordinate Frames • Feiner, “Worlds within Worlds” • Sandip, Ben
Slicing • Van Wijk, “Hyper. Slice” • Kumar, Kunal
Radial Focus+Context • Sanjini • infovis. cs. vt. edu
Comparison • Hierarchical axes (Mihalisin): • < 6 d by 10 samples, ALL slices, view only 2 d at a time • Nested coordinate frames (Worlds within Worlds) • < 5 -8 d, continuous, no overview, 3 d hardware • Slicing (Hyper. Slice): • < 10 d by 100 samples, 2 d slices • *Radial Focus+Context (Sanjini) • < 10 d by 1000 samples, overview, all d uniform, rays • Way to go, sanjini!
Next Week • Book chapter 7 • Tues: 1 -D • Plaisant, “Lifelines” » mahesh, jon • Eick, “See. Soft” » jeevak, alex • Thurs: 1 -D • Mackinlay, “Perspective Wall” » ahmed, ganesh • Hibino, “MMVIS” » atul, dananjan
Project • Proposal due today • Literature review: due Sept 27 • • • Goal: become world’s expert on your topic area A few pages What have other people done on the topic? How will yours be new & different? Will be the “Related Work” section of your final paper Resources: ACM & IEEE DL, follow refs, people