Multidimensional classification of Kleine Welle triggers using LIGO


- Slides: 15
Multidimensional classification of Kleine Welle triggers using LIGO data. Soma Mukherjee for LIGO Science Collaboration Center for Gravitational Wave Astronomy University of Texas at Brownsville. GWDAW 10, Dec. 14 -17 2005 Brownsville, TX, USA.
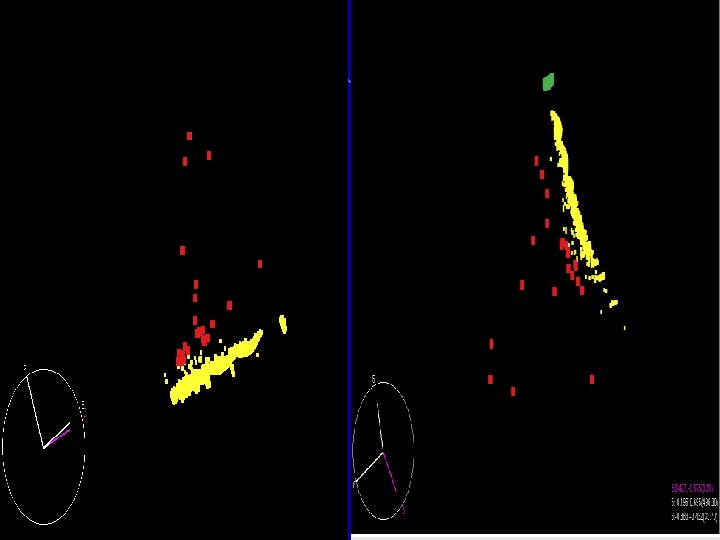
Multidimensional visualization and classification Multidimensional visualization is a technique of visualizing proximity data i. e. data where objects are characterized by dissimilarity values for all pairs of objects. Maps of these objects are constructed in Rk by interpreting these dissimilarities as distances. Hierarchical classification is a way of grouping data simultaneously over a variety of scales by creating a cluster tree. Distances are computed between every pair of objects and merged together depending on the proximity of these objects to each other. Objects are first grouped into binary clusters which in turn are grouped into larger clusters until a hierarchical tree is formed.
Why MDi. C in trigger analysis ? • MDi. C enables viewing structures present in the data in a multiparameter space. Thus, a set of k n-dimensional data vector is represented as k points in an n-dimensional space. • Often complex data do not reveal embedded structures in simple 1 D or 2 D plots. • MDi. C allows identification of substructures in the data sharing common properties that can lead to potential tracking of sources and hence finding vetoes. • Mdi. C is also the first step towards construction of a training set in the automated classification pipeline which is the ultimate goal of this work.
Motivation • To look for existence of structures or ‘classes’ in the burst triggers from all channels embedded in multiparameter space. • To compare the classes thus obtained from several channels to look for possible correlations. • Automation of the ‘class recognition’ process by using learning algorithms leading to … • Vetoes.
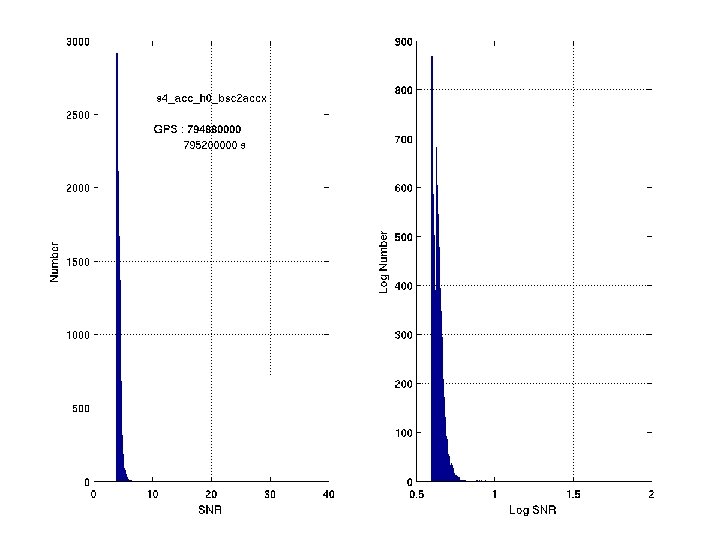
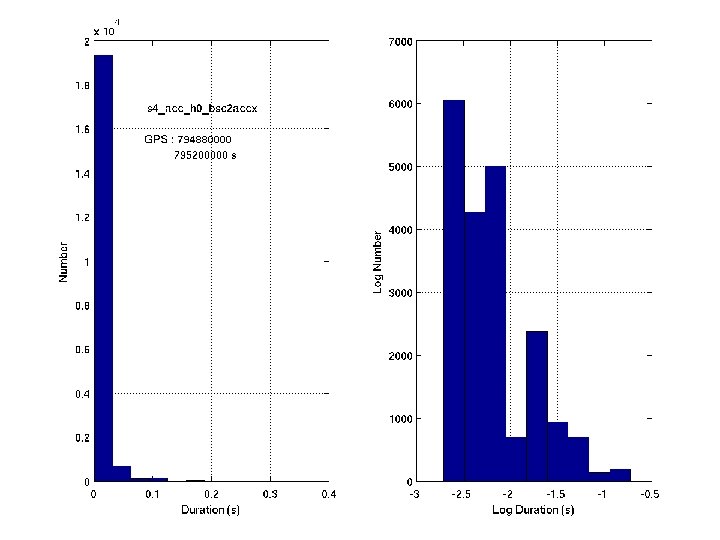
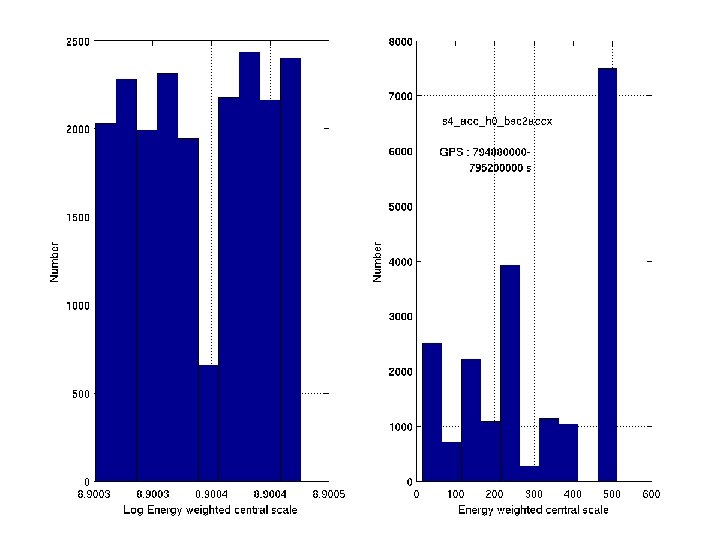
What is being done in the present study ? Kleine Welle parameters : • Trigger duration • Central scale Examples generated using LIGO S 4 data from Hanford 4 k interferometer. Derived parameters : • SNR [ (Etotal – npix) – 1/2 ] Channel used : H 0: PEM-BSC 2_ACCX GPS : 794880000 -795200000 s Shape information : • 10 highest wavelet coefficients. Optional : • KW central time • Trigger significance
Analysis pipeline : Generation of KW trigger database Raw time series Gravitational wave channels KW triggers with duration, Central scale, SNR (a cut may Be applied) Identification Several environmental channels Extract time series (1 sec Each way around the trigger ) from raw frames Hierarchical classification scheme Inter-channel comparison Band pass Compute 10 highest wavelet coefficients Multidimensional visualization Automated pattern recognition
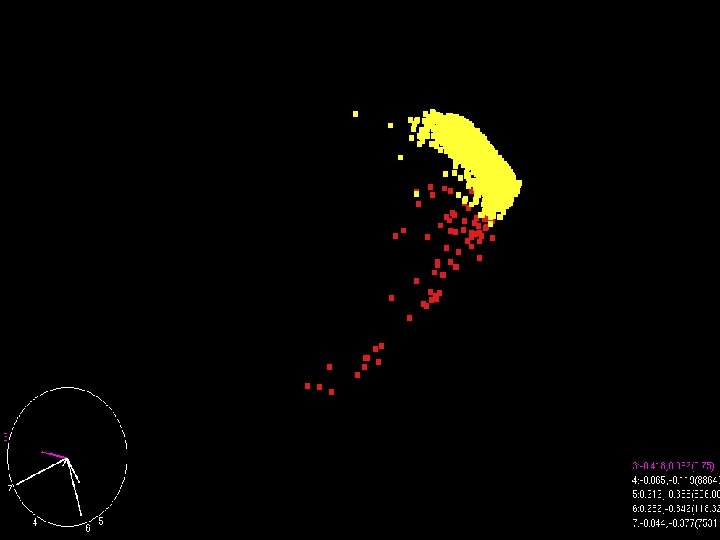
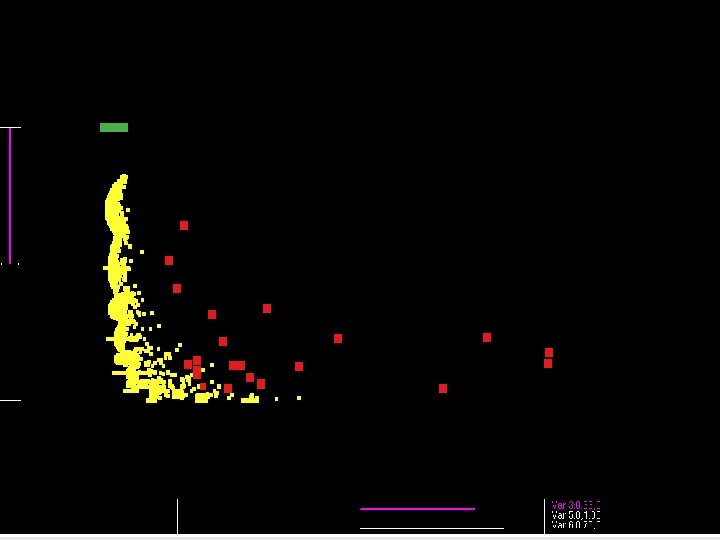
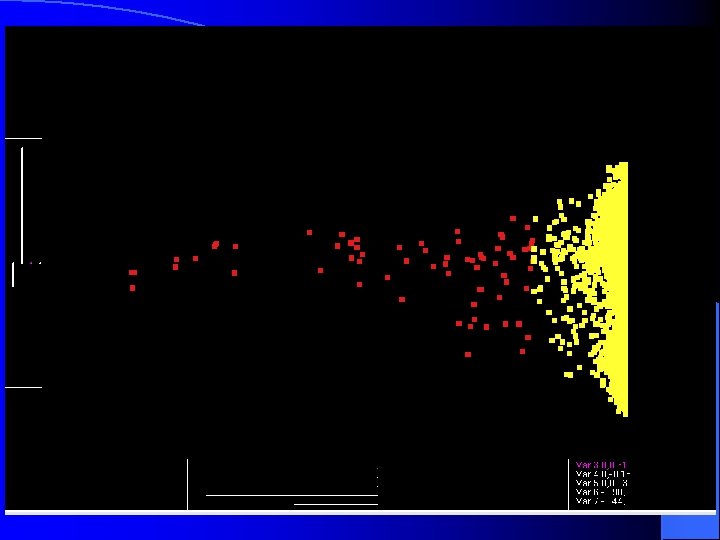
A 1 D projection plot of the SNR that shows how the triggers are placed in the SNR distribution.
On-going … • Started analyzing S 5 data. • All channels for which KW triggers are available. • Looking into more information on the trigger shape. • Web page under construction where daily/weekly analysis reports are stored. • Working towards automated trigger recognition pipeline.