MultiCriteria Analysis preference weighting Defining weights for criteria


 If")


 we can now use the random")
 If CR < 0. 100")
 or the")
 + easy for")


- Slides: 44
Multi-Criteria Analysis - preference weighting
Defining weights for criteria • Purpose: to express the importance of each criterion relative to other criteria
Overview • Preference weighting techniques – Point allocation – Ranking methods – Pairwise comparison • Multi-criteria analysis • Compromise programming • Arc. GIS ranking model extension
Ranking or prioritization studies 1. Define the problem or goal 2. Decide on evaluation criteria 3. Normalize and create utility scales 4. Define weights for criteria 5. Calculate a ranking model result 6. Evaluate result and perform sensitivity analysis
Weighting methods • Differ in: – – Accuracy Ease of use Understanding of decision makers Theoretical foundation
Weighting • A value assigned to an evaluation criterion that indicates its importance relative (not absolute) to other criteria under consideration (Malczewski, 1999) • Weights are normalized to be within a range of 0 to 1
Methods to create weights for criteria A. Rating methods – Point allocation B. Ranking methods – Rank sum – Rank reciprocal – Rank exponent C. Pairwise comparison – AHP
A. Rating methods • Require the decision maker to estimate weights on the basis of a predetermined scale ie. 0 to 100 • 0 = the criterion should not be considered • 100 = the criterion is the only one that should be considered
Point allocation • Weights are estimated by the decision maker on a predetermined scale, for example 0 to 100. • In this approach, the more points a criterion receives, the greater its relative importance. • The total of all criterion weights must sum to 100. This method is easy to normalize. Criteria that are important for ranking watersheds for runoff potential Elev change Wetlands Roads Row crops Mining Total Weight 10 25 5 40 20 ----100
Point allocation method + unlimited number of judgments + very easy to use + applicable to GIS applications - No underlying theoretical foundation - Not very precise - Difficult with more than 6 to 8 criteria
B. Ranking methods • The easiest method for decision makers because they only need to come up with a straight rank • Most important criterion= 1, next = 2, next = 3, and so on…. . • Once straight rank is done, the analyst has methods to derive weights
Rank sum, reciprocal, exponent Straight rank is first step 1 = most important criterion 5 = least important of the five criterion
Rank sum, reciprocal, exponent Straight rank is first step n = total number of criteria rj = the straight rank
Ranking methods + a good first step in working with decision makers toward consensus + spreadsheet calculation + applicable to GIS applications - Becomes difficult to straight rank many criteria - No underlying theoretical foundation - Not very precise, just approximations
C. Pairwise comparison • Used by NRCS, USFS, Park Service in land management • Developed by psychoanalysts
Background on pairwise comparison • A well-developed method of ordering attributes or characteristics of a given set of items (Saaty, 1972) – AHP analytical hierarchy process • Every response the individual makes is reduced to a simple choice between two items. • The result of these paired choices is a set of items, rank-ordered in terms of which items are chosen more often.
Other notes • Using the method of paired comparisons can be helpful for ranking items that are too numerous or too similar to mentally rank order. • This technique is objective, simple, and also ensures that every participant in a workgroup or public meeting has a voice in how things get prioritized.
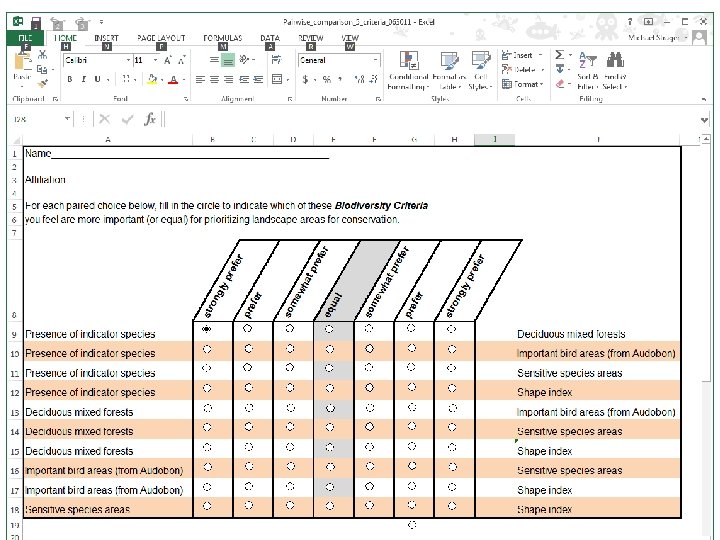
Pairwise comparison
Pairwise comparison Equal Somewhat prefer Prefer Strongly prefer
Example of pc sheet
Pairwise comparison limitation • Number of full pairwise comparisons add up quickly! N = number of judgments Comparisons = (N(N – 1)) / 2 For 10 criteria or judgments…. . comparisons = (10(10 -1))/2 = 45
To limit full comparisons… • Assume transitivity of preference (an abbreviated pairwise test) If A is preferred to B and B is preferred to C then we assume A is preferred to C
Ex of abbreviated pc sheet Abbreviated pairwise test does not allow for tests of consistency
Ex of full pc test
Step 1. create a comparison matrix For a trout suitability model, assume we use three criteria temperature (temp) water quality (wq) stream structure (Strc) Criterion Temp Wq Strc
Step 2. l Get comparisons using selected intensities 1 = equal preference 3 = prefer 6 = strongly prefer For finding suitable trout sites we decide that: Temp is preferred over Wq Temp is strongly preferred over Strc Wq is preferred over Strc
Step 3. a • After making the diagonal values = 1, Fill in upper right corner of the matrix 1 = equal preference 3 = prefer 6 = strongly prefer For finding suitable trout locations we decide that: Temp is preferred over Wq Tempo is strongly preferred over Strc Wq is preferred over Strc Criterion Temp Wq Strc Temp Wq 1 Strc 3 1 6 3 1
Step 3. b • Fill in matrix with reciprocal values Criterion Temp Wq Strc Temp 1 1/3 1/6 Wq Strc 3 1 1/3 6 3 1
Step 4. a • Sum columns Criterion Temp Wq Strc Temp 1 1/3 1/6 1. 50 Wq Strc 3 1 1/3 4. 33 6 3 1 10. 00
Step 4. b • Normalize the matrix Criterion Temp Wq Strc 1 3 6 Wq 1/3 1 3 Strc 1/6 1/3 1 1. 50 Criterion Temp 4. 33 10. 00 Wq Strc Temp . 666 . 692 . 600 Wq . 222 . 230 . 300 Strc . 111 . 076 . 100
Step 4. c • Find the average of the rows, this will be the weights for the criteria Criterion Temp Wq Strc Temp . 666 . 692 . 600 (. 666+. 692+. 600) / 3 = 0. 653 Temperature Wq . 222 . 230 . 300 (. 222+. 230+. 300) / 3 = 0. 251 Water quality Strc . 111 . 076 . 100 (. 111+. 076+. 100) / 3 = 0. 096 Stream structure Sum to 1
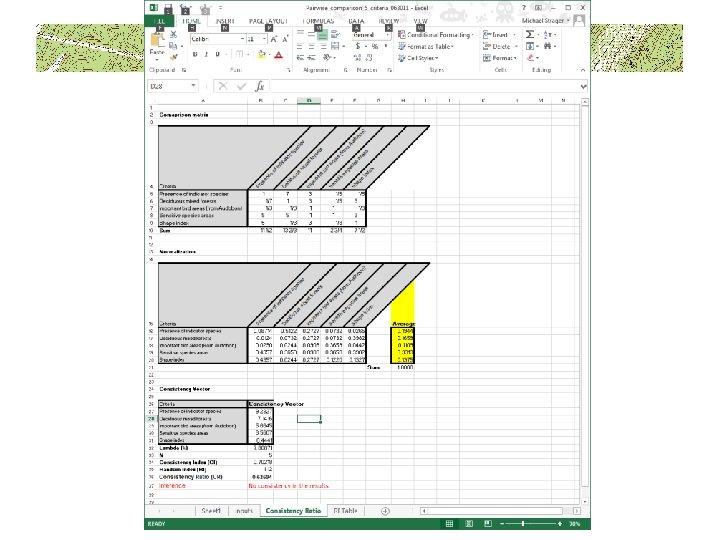
Step 5. • Check for consistency in comparisons by first computing a consistency vector Criterion Temp Wq Strc 1 3 6 0. 653 Temperature Temp (0. 653)(1) + (0. 251)(3) + (0. 096)(6) = 1. 982 Wq . 333 1 3 0. 251 Water quality Wq (0. 653)(. 333) + (0. 251)(1) + (0. 096)(3) = 0. 756 Strc . 166 . 333 1 0. 096 Stream struc Strc (0. 653)(. 166) + (0. 251)(. 333) + (0. 096)(1) = 0. 2878 Original matrix from 3. b Weights from 4. c Temp 1. 982 / 0. 653 = 3. 035 Wq 0. 756 / 0. 251 = 3. 011 Strc 0. 287 / 0. 096 = 2. 989 New consistency vector
Step 6. a • Now that we have the consistency vector, we need to compute two more terms, lambda (λ) and the consistency index (CI) λ = the average of the consistency vector from step 5. = (3. 305 + 3. 011 + 2. 989) / 3 = 3. 101
Step 6. b • Compute the consistency index which provides a measure from consistency – CI = (λ – N) / (N- 1) – N = number of criteria CI = 3. 101 – 3 / 3 -1 = 0. 050
Step 7. • With the consistency index (CI) we can now use the random index (RI) table to compute the consistency ratio (CR) CR = CI / RI = 0. 050 / 0. 58 = 0. 086 Number of criteria RI 1 0. 00 2 0. 00 3 0. 58 4 0. 90 5 1. 12 6 1. 24 7 1. 32 8 1. 41 9 1. 45 10 1. 49 11 1. 51 12 1. 48 13 1. 56 14 1. 57 15 1. 59 Saaty (1999) p. 186
Step 8. • Interpretation of the consistency ration (CR) If CR < 0. 100 then there is consistency in responses In our example, since the CR is 0. 086 which is < 0. 100 then we can use the weights from step 4 c. ! 0. 653 Temperature 0. 251 Water quality 0. 096 Stream structure
Step 9. • Integrate into GIS the field calculator (vector table field) or the raster calculator (grid data)
Pairwise comparison + good theoretical foundation for further statistical test (Mann-Whitney) + easy for decision makers to understand + applicable to GIS applications - Becomes difficult to straight rank many criteria - Must check for consistency or assume transitivity of preferences - Time consuming computations - Path dependency issue
Summary Which method to use depends on the tradeoffs one is willing to make between – Ease of use – Accuracy – Degree of understanding on the part of the decision maker – Theoretical foundation – Availability of computer software
FYI: Software for weighting • • • Criterion Decision Plus Expert Choice Logical Decisions Pairwise comparison program by NRCS AHP Arcscripts toolbar for Arc. GIS
Other options for weights • Use modeled output from logistic regression or principal component analysis • Past studies or published literature • Interview experts • Habitat suitabilty indices (HSIs) for wildlife studies
Questions / comments?