
Mull Community Council Results of RET Questionnaire Isle



- Slides: 22
Mull Community Council Results of RET Questionnaire Isle of Mull, February 2017
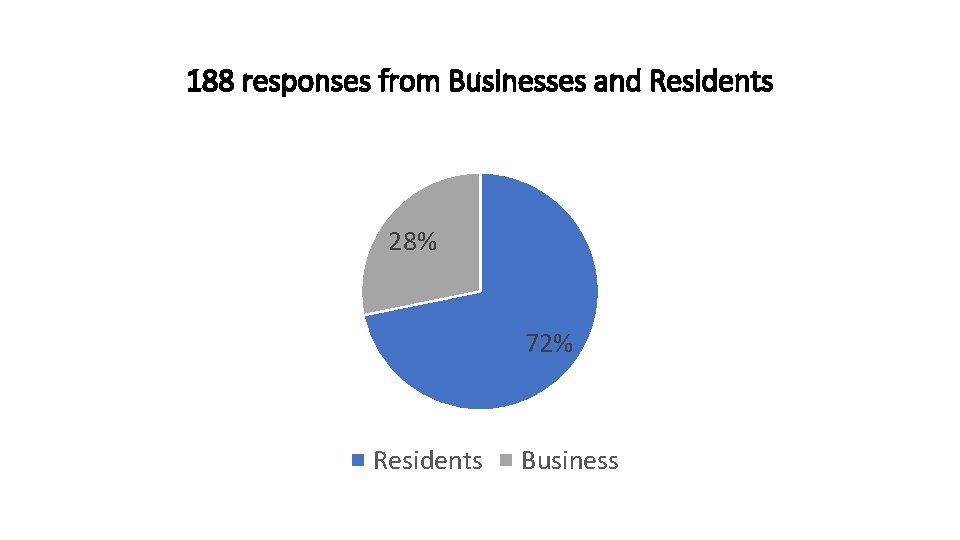
188 responses from Businesses and Residents 28% 72% Residents Business
Business Responses Did you see an increase or decrease in business? 38% 51% 11% Increase Decrease No change
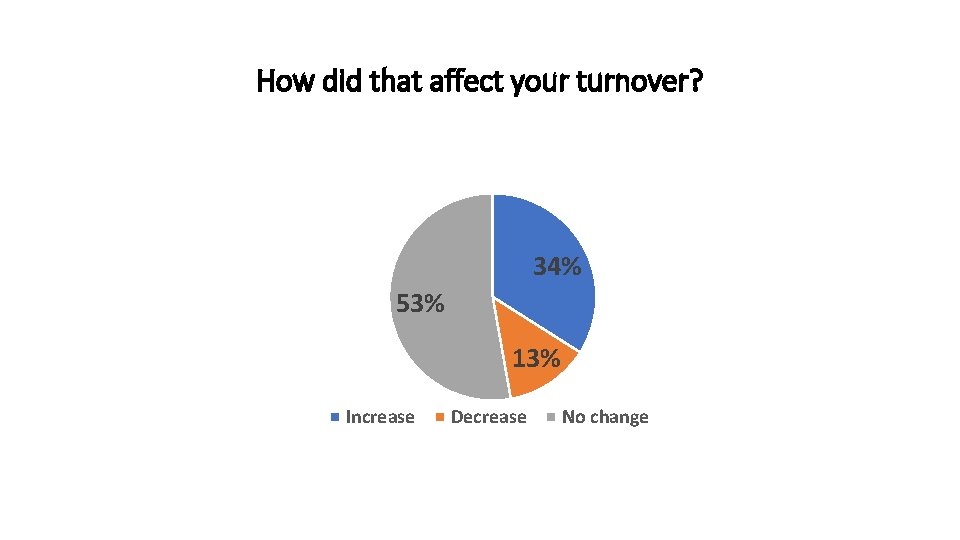
How did that affect your turnover? 34% 53% 13% Increase Decrease No change
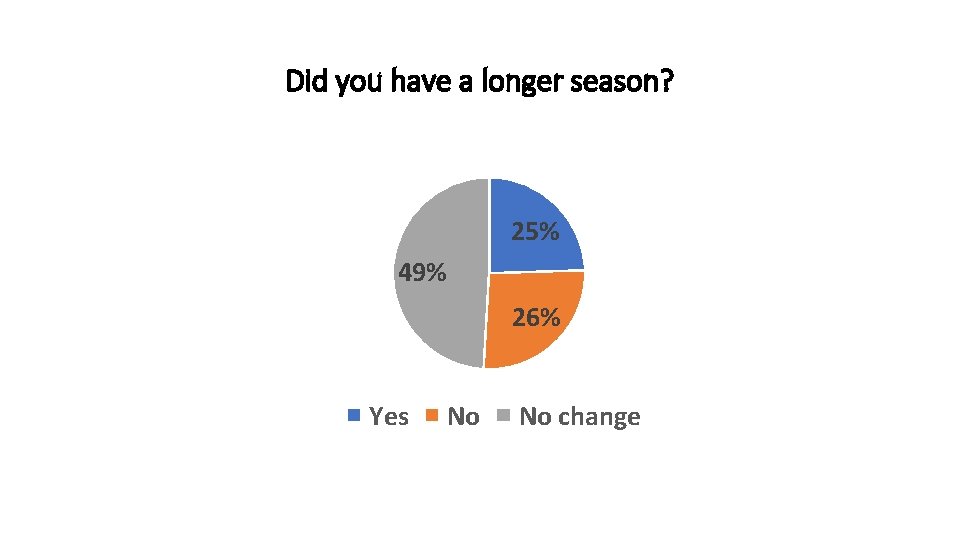
Did you have a longer season? 25% 49% 26% Yes No No change
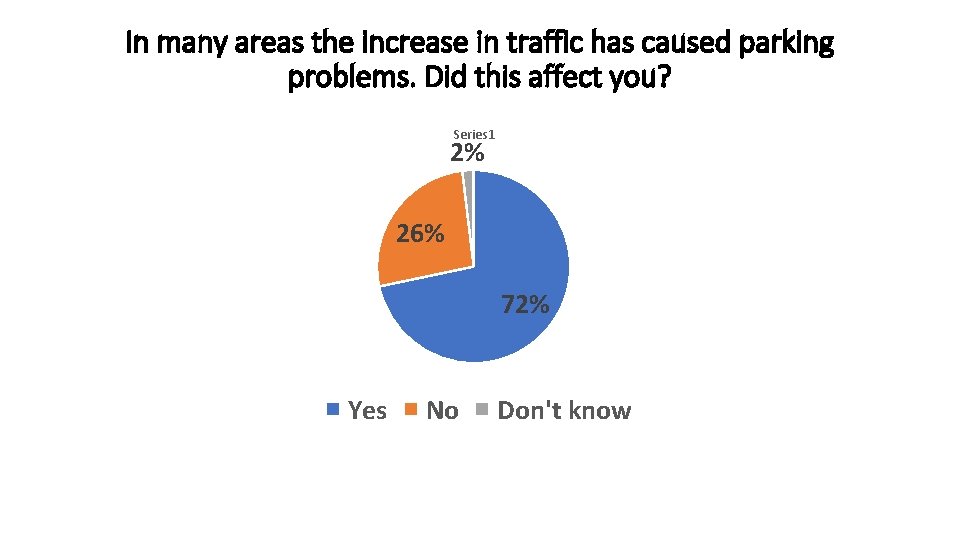
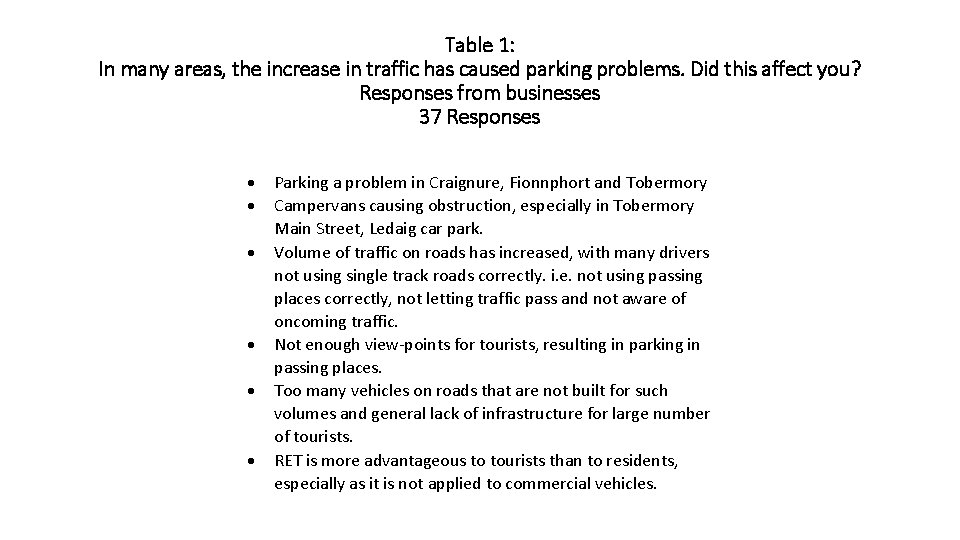
In many areas the increase in traffic has caused parking problems. Did this affect you? Series 1 2% 26% 72% Yes No Don't know
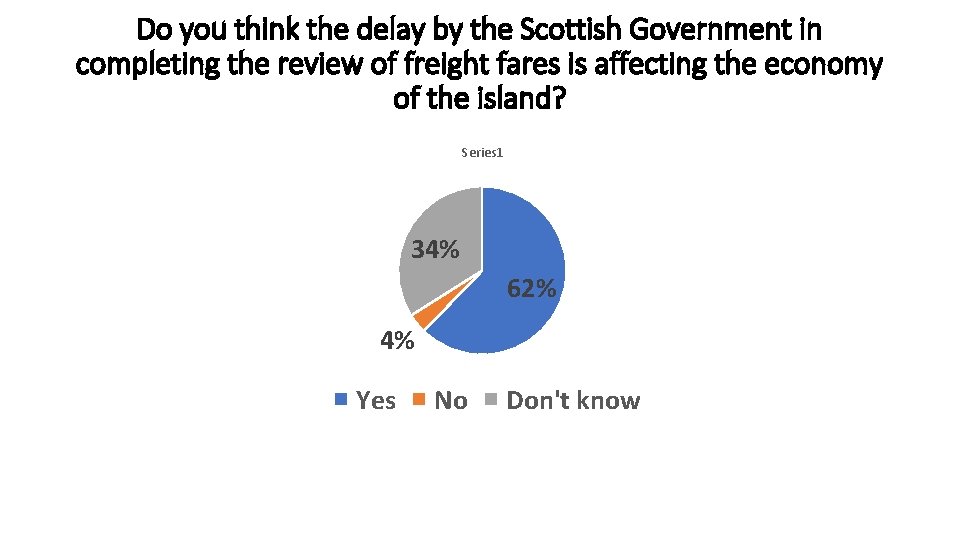
Do you think the delay by the Scottish Government in completing the review of freight fares is affecting the economy of the island? Series 1 34% 62% 4% Yes No Don't know
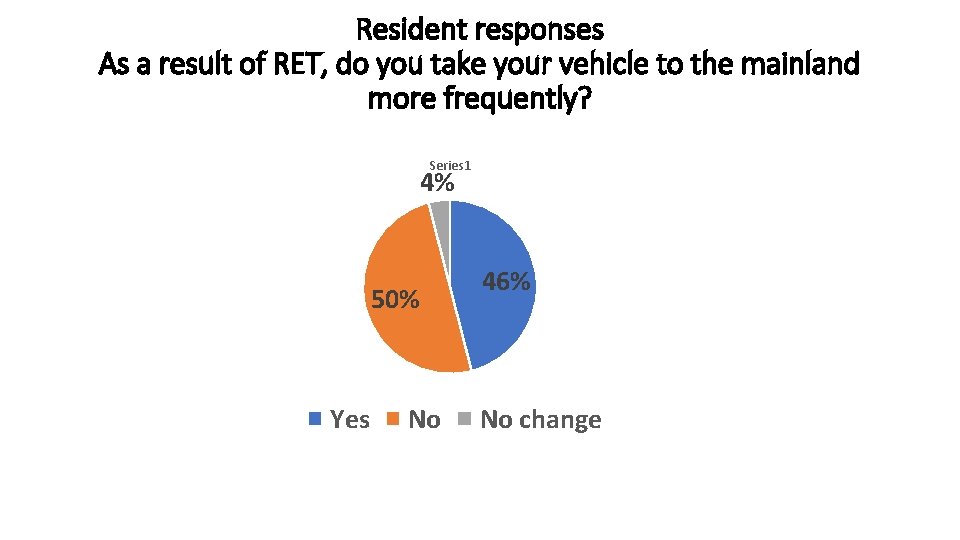
Resident responses As a result of RET, do you take your vehicle to the mainland more frequently? Series 1 4% 50% Yes No 46% No change
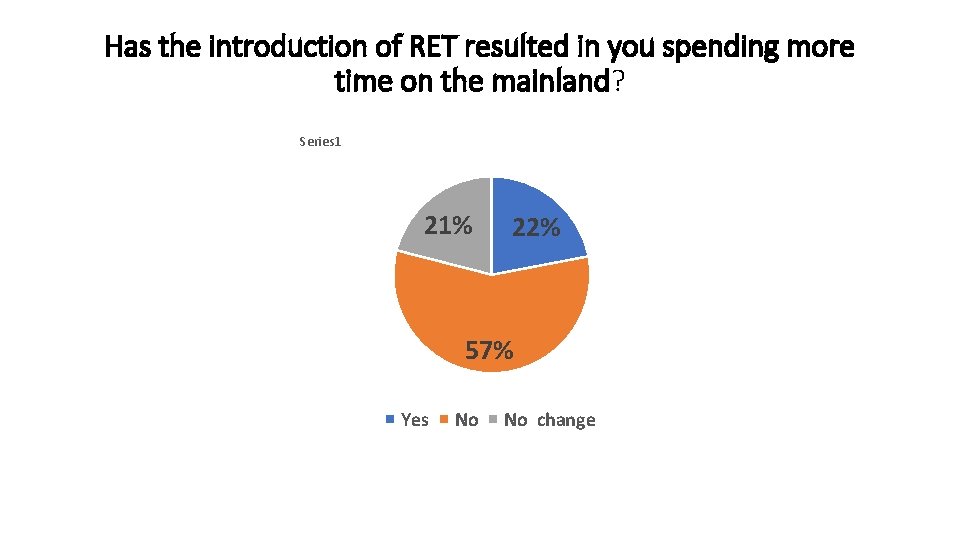
Has the introduction of RET resulted in you spending more time on the mainland? Series 1 21% 22% 57% Yes No No change
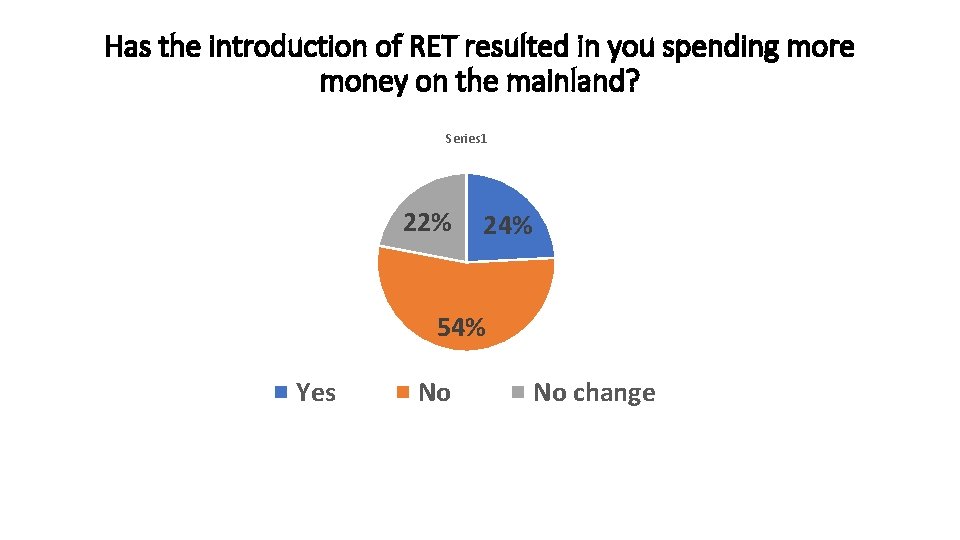
Has the introduction of RET resulted in you spending more money on the mainland? Series 1 22% 24% 54% Yes No No change
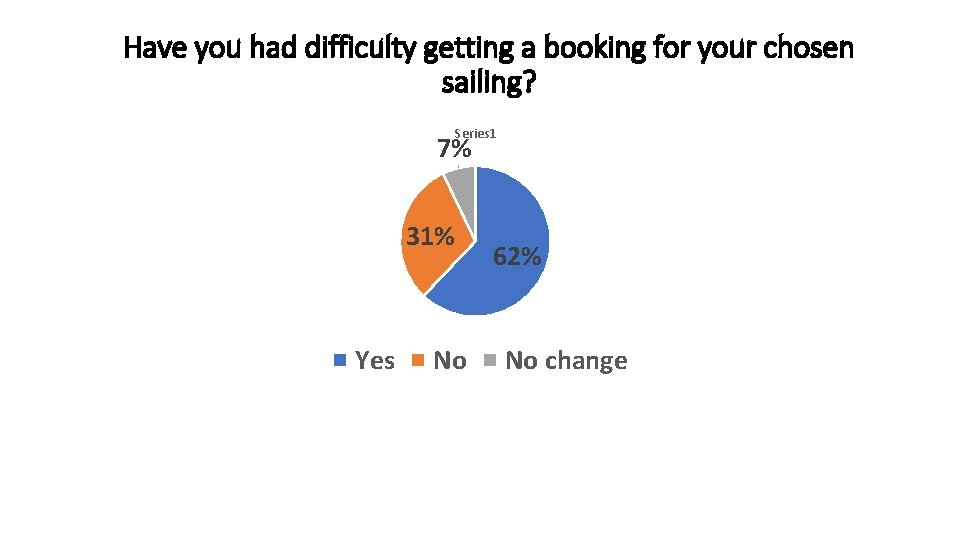
Have you had difficulty getting a booking for your chosen sailing? Series 1 7% 31% Yes No 62% No change
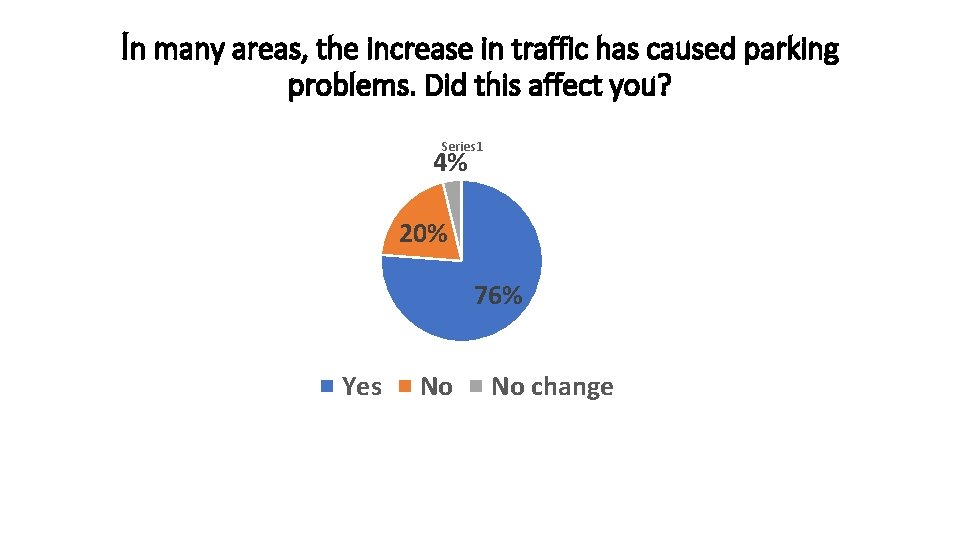
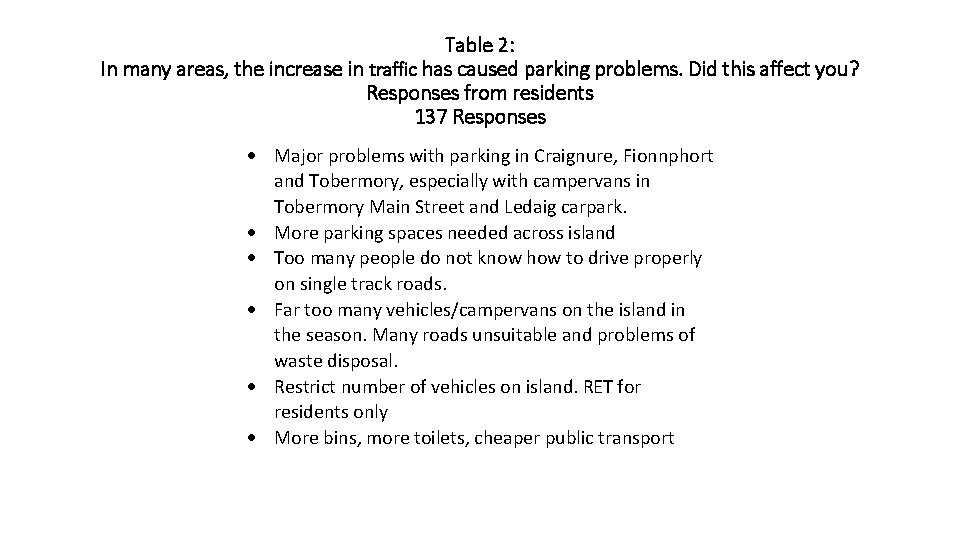
In many areas, the increase in traffic has caused parking problems. Did this affect you? Series 1 4% 20% 76% Yes No No change
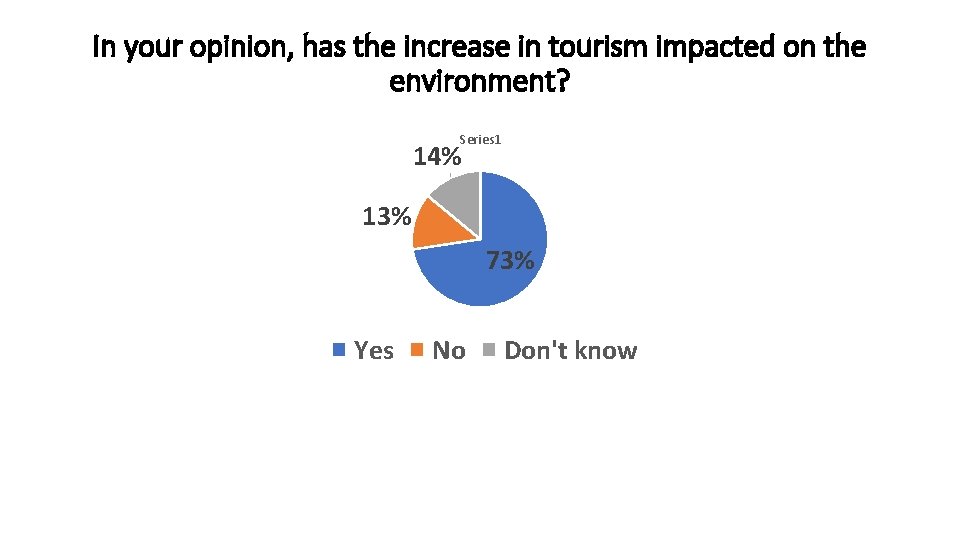
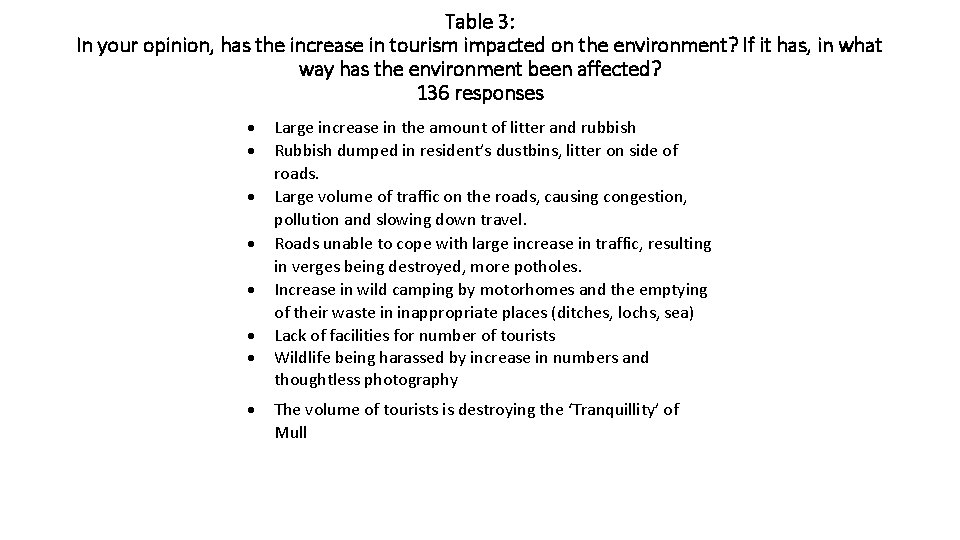
In your opinion, has the increase in tourism impacted on the environment? Series 1 14% 13% 73% Yes No Don't know
Summary of Responses
Table 1: In many areas, the increase in traffic has caused parking problems. Did this affect you? Responses from businesses 37 Responses Parking a problem in Craignure, Fionnphort and Tobermory Campervans causing obstruction, especially in Tobermory Main Street, Ledaig car park. Volume of traffic on roads has increased, with many drivers not usingle track roads correctly. i. e. not using passing places correctly, not letting traffic pass and not aware of oncoming traffic. Not enough view-points for tourists, resulting in parking in passing places. Too many vehicles on roads that are not built for such volumes and general lack of infrastructure for large number of tourists. RET is more advantageous to tourists than to residents, especially as it is not applied to commercial vehicles.
Table 2: In many areas, the increase in traffic has caused parking problems. Did this affect you? Responses from residents 137 Responses Major problems with parking in Craignure, Fionnphort and Tobermory, especially with campervans in Tobermory Main Street and Ledaig carpark. More parking spaces needed across island Too many people do not know how to drive properly on single track roads. Far too many vehicles/campervans on the island in the season. Many roads unsuitable and problems of waste disposal. Restrict number of vehicles on island. RET for residents only More bins, more toilets, cheaper public transport
Table 3: In your opinion, has the increase in tourism impacted on the environment? If it has, in what way has the environment been affected? 136 responses Large increase in the amount of litter and rubbish Rubbish dumped in resident’s dustbins, litter on side of roads. Large volume of traffic on the roads, causing congestion, pollution and slowing down travel. Roads unable to cope with large increase in traffic, resulting in verges being destroyed, more potholes. Increase in wild camping by motorhomes and the emptying of their waste in inappropriate places (ditches, lochs, sea) Lack of facilities for number of tourists Wildlife being harassed by increase in numbers and thoughtless photography The volume of tourists is destroying the ‘Tranquillity’ of Mull
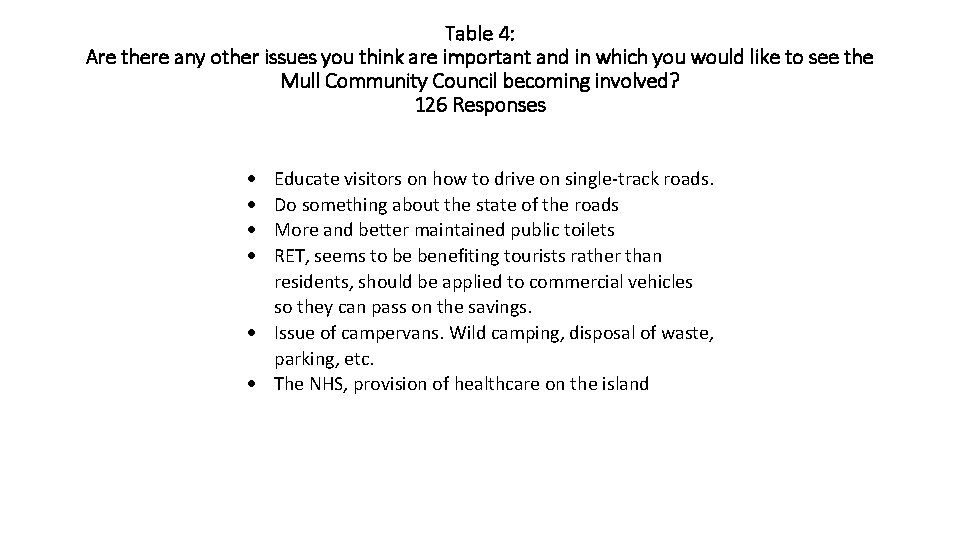
Table 4: Are there any other issues you think are important and in which you would like to see the Mull Community Council becoming involved? 126 Responses Educate visitors on how to drive on single-track roads. Do something about the state of the roads More and better maintained public toilets RET, seems to be benefiting tourists rather than residents, should be applied to commercial vehicles so they can pass on the savings. Issue of campervans. Wild camping, disposal of waste, parking, etc. The NHS, provision of healthcare on the island
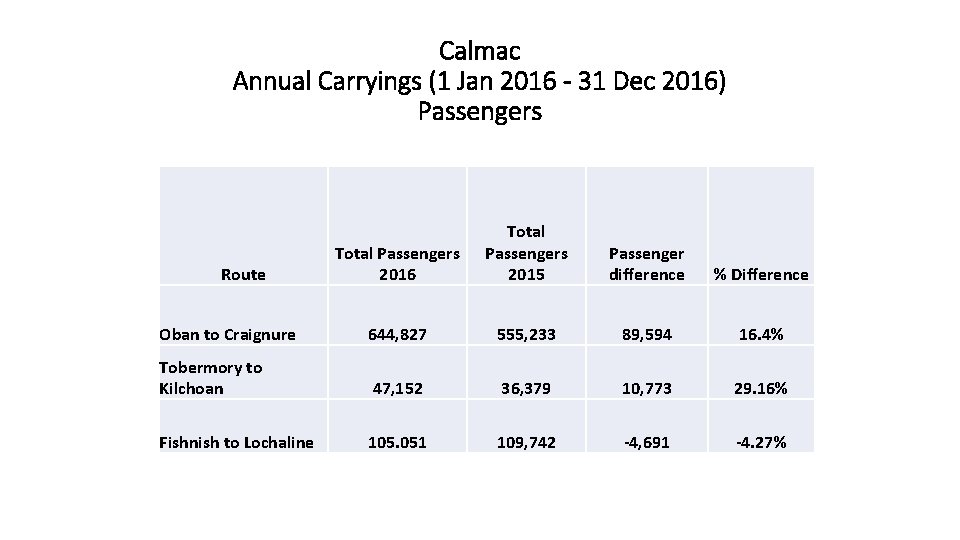
Calmac Annual Carryings (1 Jan 2016 - 31 Dec 2016) Passengers Total Passengers 2016 Total Passengers 2015 Passenger difference % Difference Oban to Craignure 644, 827 555, 233 89, 594 16. 4% Tobermory to Kilchoan 47, 152 36, 379 10, 773 29. 16% Fishnish to Lochaline 105. 051 109, 742 -4, 691 -4. 27% Route
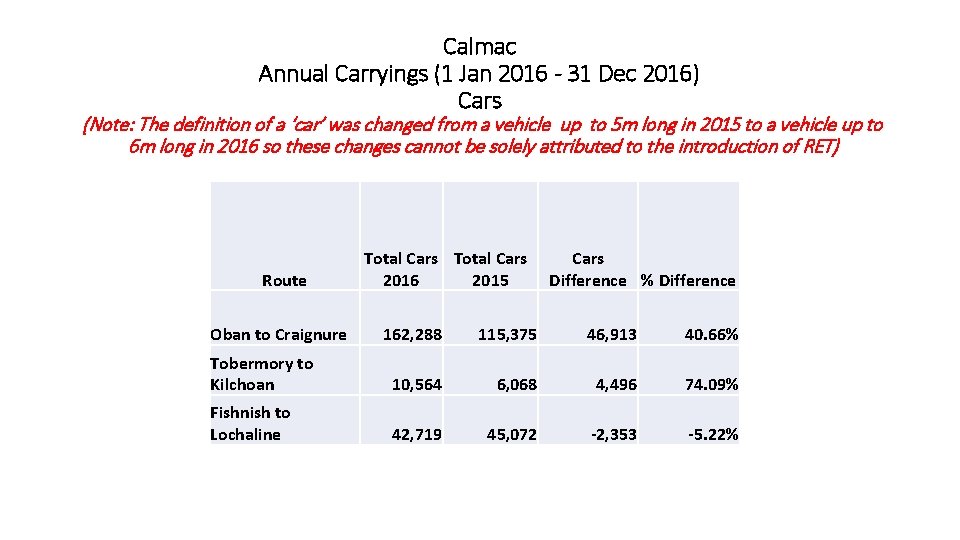
Calmac Annual Carryings (1 Jan 2016 - 31 Dec 2016) Cars (Note: The definition of a ‘car’ was changed from a vehicle up to 5 m long in 2015 to a vehicle up to 6 m long in 2016 so these changes cannot be solely attributed to the introduction of RET) Route Oban to Craignure Total Cars 2016 2015 Cars Difference % Difference 162, 288 115, 375 46, 913 40. 66% Tobermory to Kilchoan 10, 564 6, 068 4, 496 74. 09% Fishnish to Lochaline 42, 719 45, 072 -2, 353 -5. 22%
Calmac Annual Carryings (1 Jan 2016 - 31 Dec 2016) Coaches Route Oban to Craignure Tobermory to Kilchoan Fishnish to Lochaline Total Coaches % 2016 2015 Difference 1, 908 2 92 5. 07% 6 5 1 20% 307 309 -2 -0. 65%
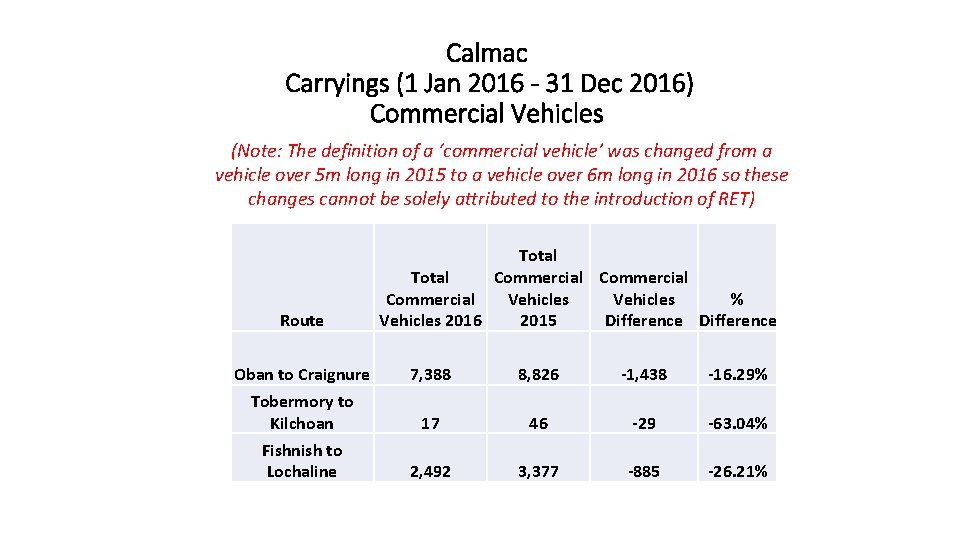
Calmac Carryings (1 Jan 2016 - 31 Dec 2016) Commercial Vehicles (Note: The definition of a ‘commercial vehicle’ was changed from a vehicle over 5 m long in 2015 to a vehicle over 6 m long in 2016 so these changes cannot be solely attributed to the introduction of RET) Route Total Commercial Vehicles % Vehicles 2016 2015 Difference Oban to Craignure 7, 388 8, 826 -1, 438 -16. 29% Tobermory to Kilchoan 17 46 -29 -63. 04% Fishnish to Lochaline 2, 492 3, 377 -885 -26. 21%