Mulberry River Watershed Advisory Committee and Public Meeting

Mulberry River Watershed Advisory Committee and Public Meeting July 31, 2017

Project Overview �Project Funding �Project Goals �Collect water quality data �Develop watershed management plan � Assess current state of watershed � Identify issues of concern � Recommend management practices to reduce pollutant load reductions � Determine schedule for implementation of management practices. �Plan Implementation

What is your role? �Identify issues of concern �Determine plan goals �Determine implementation policies/activities �Facilitate education and outreach �Assist with plan implementation
 � Upper Mulberry River (HUC-12) � Duncan Creek-Mulberry")
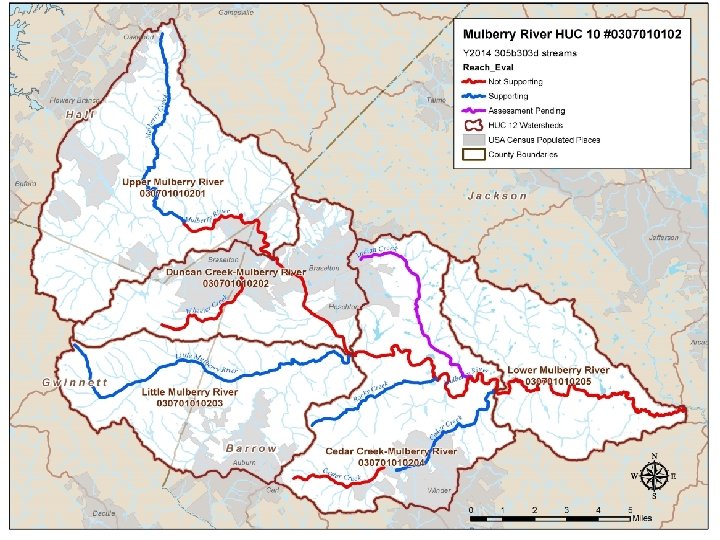
Watershed Overview � Mulberry River (HUC-10) � Upper Mulberry River (HUC-12) � Duncan Creek-Mulberry River (HUC-12) � Little Mulberry River (HUC-12) not included in study � Cedar Creek-Mulberry River (HUC-12) � Lower Mulberry River (HUC-12) �Impaired Segments: � Mulberry River, 27 miles, fecal coliform and sediment � Cedar Creek upstream of Winder Reservoir, 4 miles, fecal coliform �Supporting Segments: � Rocky Creek, 4 miles � Cedar Creek headwater to Winder Reservoir, 4 miles �Assessment Pending: � Indian Creek, 7 miles, sediment impairment

�Pollutant load reduction needed: �Sediment: 12% �Fecal Coliform: � Mulberry River – Mulberry Creek to Little Mulberry River – 75% � Mulberry River – Little Mulberry River to Middle Oconee – 73% � Cedar Creek – Headwaters to Winder Reservoir – 95%

Potential Impairment Source �Fecal Coliform �Failed or absent septic tanks �Leaking sewer lines �Agricultural runoff �Agricultural pollution from cattle with direct access to streams �Pet and kennel discharges �“Hobby Farms” keeping large animals with direct contact to streams �Stormwater runoff from urbanized areas

�Sediment �Urban ronoff from impervious surfaces �Erosion from land disturbing activities �Agricultural soil exposure from livestock and crop erosion US EPA – 30% sediment from natural erosion; 70% sediment from human activities with most concentrated release from construction activities

What is Fecal Coliform? �Fecal coliform are a group of bacteria found in the feces of warm-blooded animals such as people, livestock, pets, and wildlife.

Why is fecal coliform a problem? �relationship between the presence of fecal coliform bacteria and the presence of illness-causing viruses and bacteria, called pathogens. �Symptoms of illness associated with fecal coliform pathogens are minor, such as upset stomach, diarrhea, ear infections, and rashes. Others can be more severe.

Other problems: �Overgrowth of algae and other aquatic plants from nitrogen and phosphorus in sewage and manure. Plant overgrowth can: � Deplete oxygen in the water that supports fish and other aquatic animals. � Affect p. H balance of water � Interfere with recreational activities � Create odor problems or unpleasant views � Affect property values.

Why is sediment a problem? �Sediment entering stormwater degrades the quality of water for drinking, wildlife and the land surrounding streams in the following ways: �Increased flooding potential �Prevents animals from seeing food �Prevents natural vegetation from growing in water �Destroys habitat for stream organisms �Causes declines in fish populations. �Increases cost of drinking water treatment �Promote algae blooms �Alter stream flow and depth

Water Quality Monitoring

EPD Fishing and Drinking Standards for fecal coliform �May thru October � GM not to exceed 200 MPN/100 -ml � No individual sample exceeding 400 MPN/100 -ml �November thru April � GM not to exceed 1, 000 MPN/100 -ml � No individual sample exceeding 4, 000 MPN/100 -m
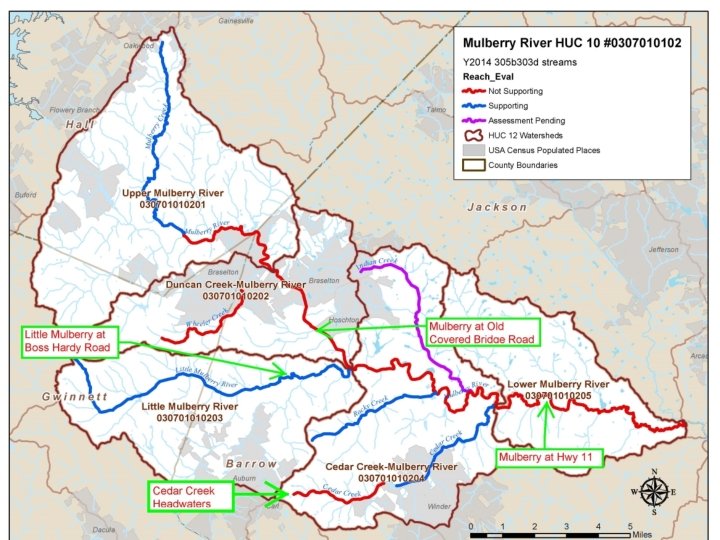

EPD Monitoring Data – fecal coliform �Cedar Creek Headwaters �April 2004: GM 761 with one individual sample of 16000 �July 2004: GM of 4312 with individual samples of 3000, 9000, and 16000. �October 2004: GM 913 with individual samples of 1700, 500, and 2400 �Little Mulberry at Boss Hardy Road �April 2004: GM 218 with individual counts of 300 and 700 �July 2004: GM 812 with individual counts of 630, 1700, and 500

�Mulberry River at Highway 11 �June 1999: GM of 735 with individual counts of 1300 and 4900. �Mulberry River at Old Covered Bridge Road �July 2004: 805 GM with individual counts of 2400, 310, and 700.

EPA Sediment Data �No state numerical standard. �State narrative standard is to maintain biological integrity of waters of the state. �Allowable load in Oconee River watershed is 0. 62 tons/acre/year. �In 2002, Mulberry River had an estimate loading of 0. 70 tons/acre/year. � 12% reduction needed.

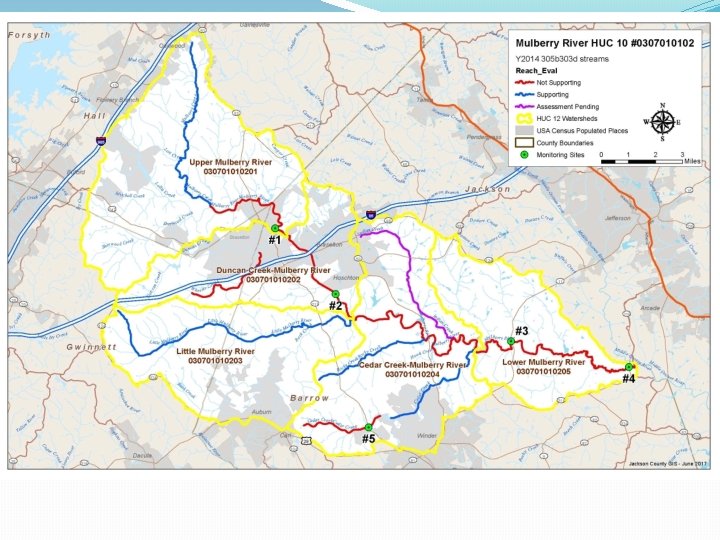
Project Water Quality Monitoring �Monitoring September – December 2017 �Fecal coliform and sediment
- Slides: 20