
MTM Portfolio Model October 22 2019 AGENDA Portfolio
MTM Portfolio Model October 22, 2019
AGENDA • Portfolio Model Benefits & Best Practices • Survey Standardization Process Overview • Proposed Next Steps & Overall Timeline
Portfolio Model Benefits & Best Practices
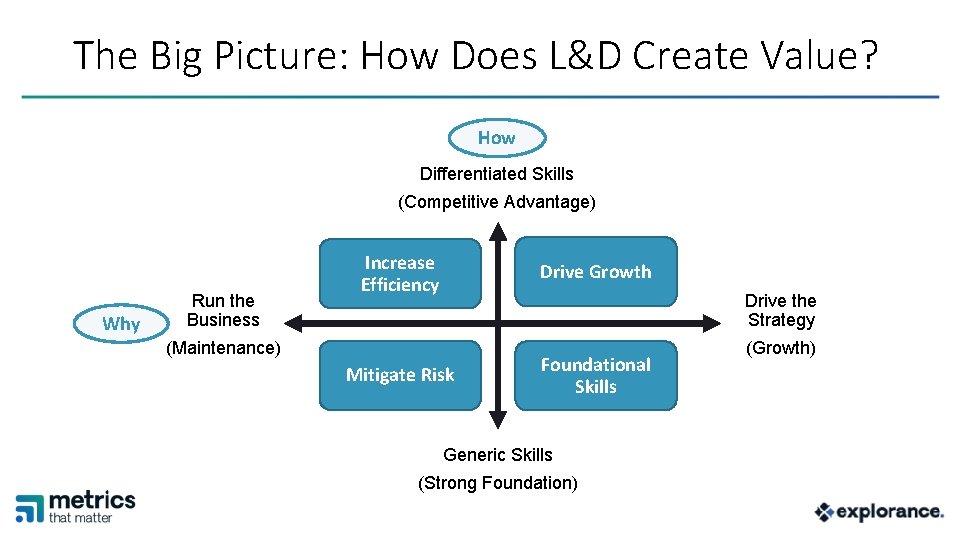
The Big Picture: How Does L&D Create Value? How Differentiated Skills (Competitive Advantage) Why Run the Business Increase Efficiency Drive Growth Drive the Strategy (Maintenance) Mitigate Risk Foundational Skills Generic Skills (Strong Foundation) 4 © 2018 Gartner, Inc. and/or its affiliates. All rights reserved. (Growth)
Portfolio Evaluation Model Simplify your data collection strategy Group the most meaningful performance indicators at a summary level, translated into the language of the business Look at “ROI” through a new lens, and communicate L&D’s contribution from a broader perspective Ensure alignment between L&D’s results and the desired business impact
Benefits for Standardization • Ability to leverage benchmarking • Enabled organizational reporting across various functions • Increased efficiency with the measurement process • Minimizing work with custom surveys and management of course survey assignments
Standardization Process Overview
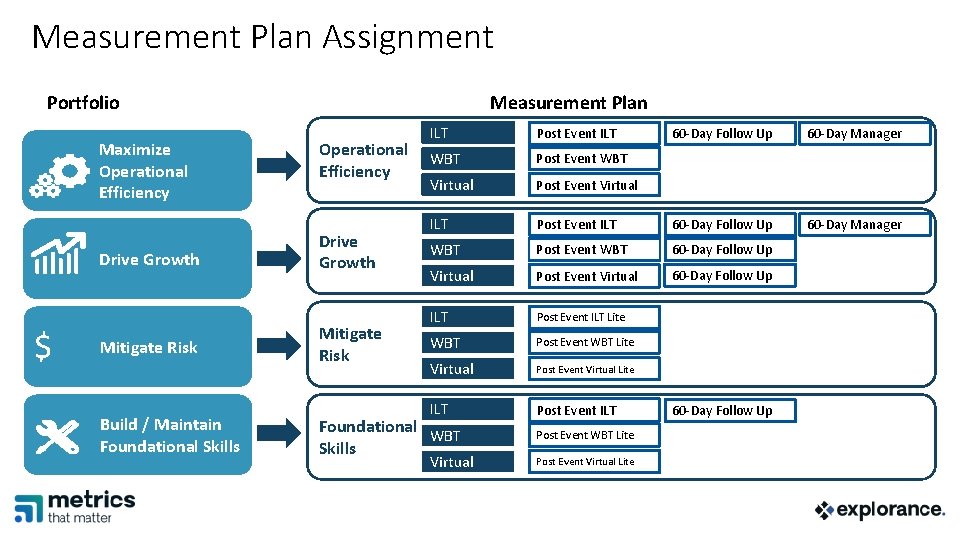
Measurement Plan Assignment Portfolio Maximize Operational Efficiency Drive Growth $ Mitigate Risk Build / Maintain Foundational Skills Measurement Plan Operational Efficiency Drive Growth Mitigate Risk ILT Post Event ILT WBT Post Event WBT Virtual Post Event Virtual ILT 60 -Day Follow Up 60 -Day Manager Post Event ILT 60 -Day Follow Up 60 -Day Manager WBT Post Event WBT 60 -Day Follow Up Virtual Post Event Virtual 60 -Day Follow Up ILT Post Event ILT Lite WBT Post Event WBT Lite Virtual Post Event Virtual Lite ILT Post Event ILT Foundational WBT Skills Virtual Post Event WBT Lite Post Event Virtual Lite 60 -Day Follow Up
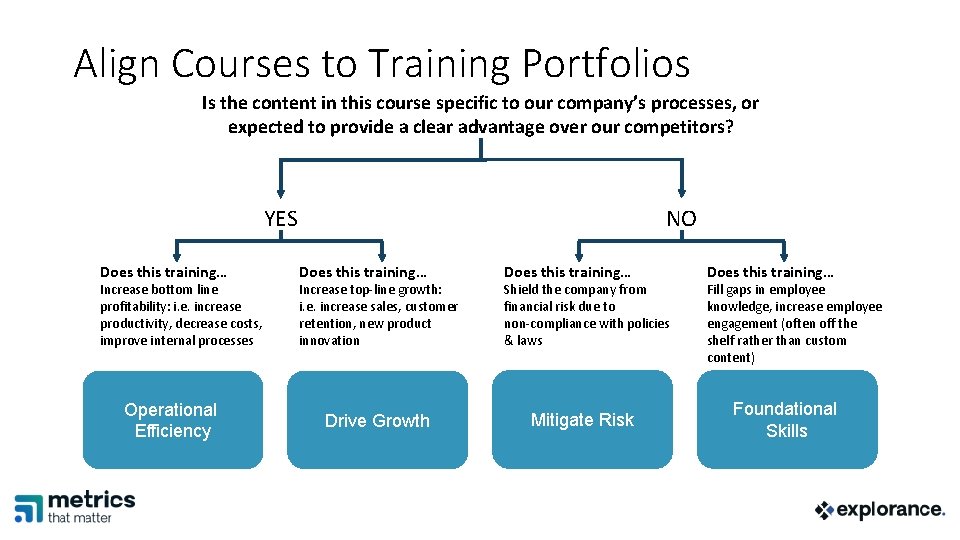
Align Courses to Training Portfolios Is the content in this course specific to our company’s processes, or expected to provide a clear advantage over our competitors? YES Does this training… Increase bottom line profitability: i. e. increase productivity, decrease costs, improve internal processes Operational Efficiency NO Does this training… Drive Growth Mitigate Risk Foundational Skills Increase top-line growth: i. e. increase sales, customer retention, new product innovation Shield the company from financial risk due to non-compliance with policies & laws Fill gaps in employee knowledge, increase employee engagement (often off the shelf rather than custom content)
Proposed Next Steps & Overall Timeline
Next Steps & End Goal 1. Explorance provide template of active courses in MTM 1. Contains courses active in the past 2 years 2. Client to provide the respective portfolio assignment for each course for this client 3. Explorance Team will make the portfolio assignments in MTM • Once assignments are made in MTM, all classes scheduled after that time will apply the measurement plan from the respective portfolio 4. End Goal: Standard measurement plans for each portfolio allowing efficient analysis of programs’ impact on the business
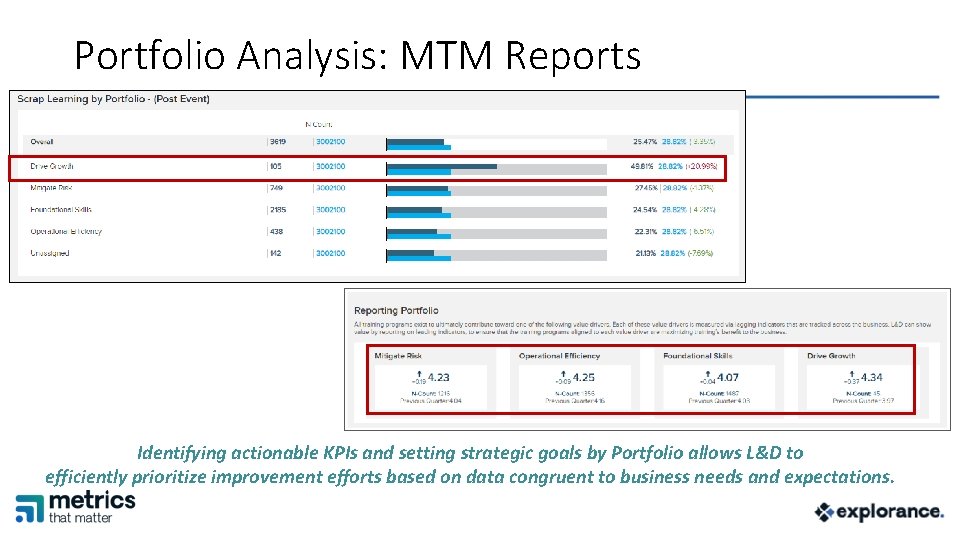
Portfolio Analysis: MTM Reports Identifying actionable KPIs and setting strategic goals by Portfolio allows L&D to efficiently prioritize improvement efforts based on data congruent to business needs and expectations.
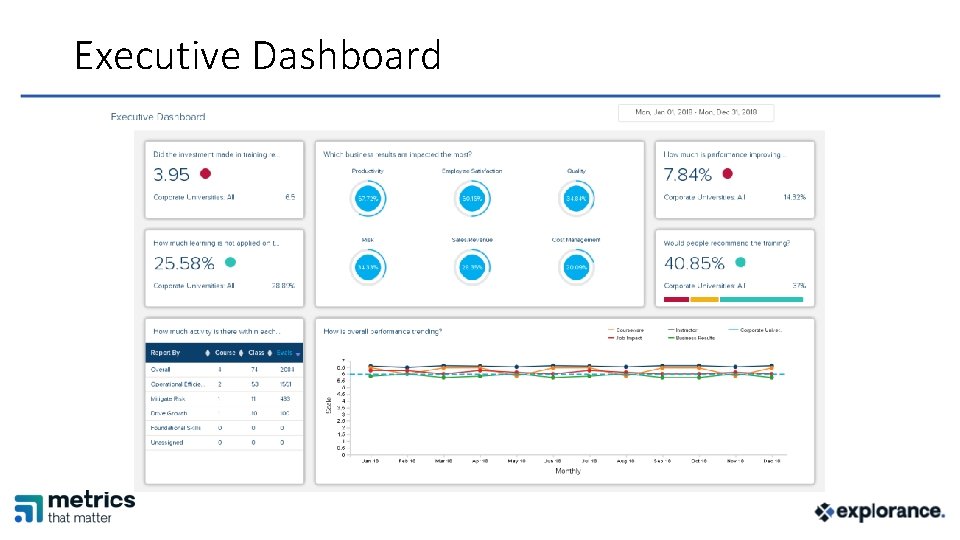
Executive Dashboard 14 © 2018 Gartner, Inc. and/or its affiliates. All rights reserved.
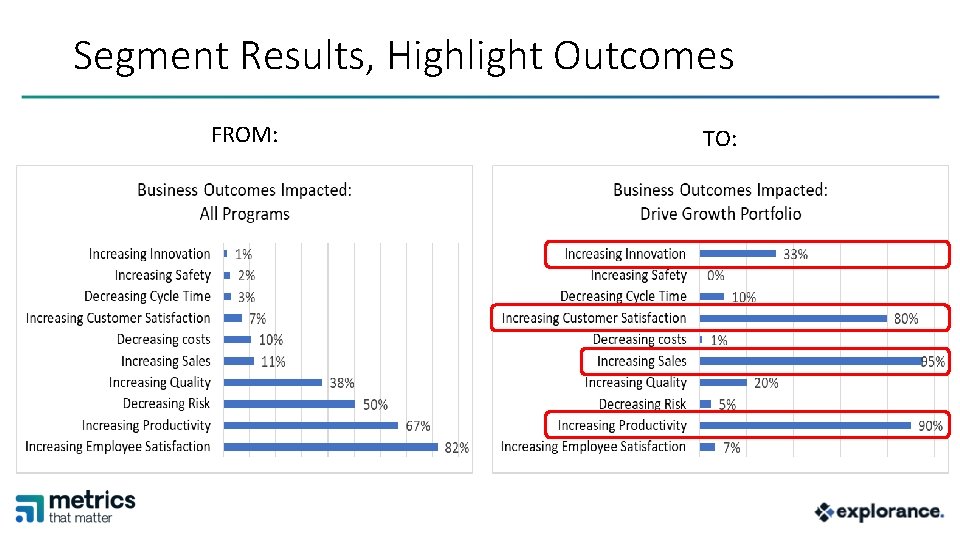
Segment Results, Highlight Outcomes FROM: 15 © 2018 Gartner, Inc. and/or its affiliates. All rights reserved. TO:
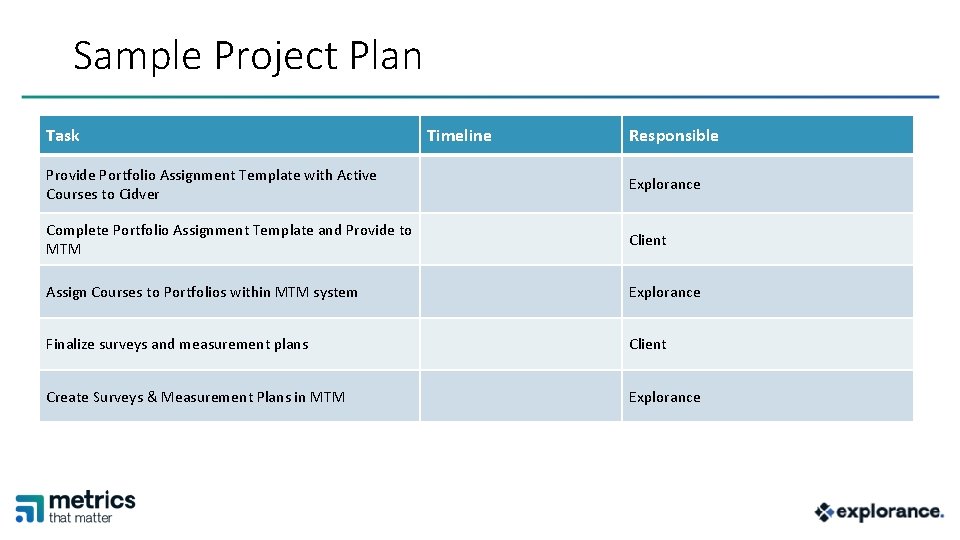
Sample Project Plan Task Timeline Responsible Provide Portfolio Assignment Template with Active Courses to Cidver Explorance Complete Portfolio Assignment Template and Provide to MTM Client Assign Courses to Portfolios within MTM system Explorance Finalize surveys and measurement plans Client Create Surveys & Measurement Plans in MTM Explorance
Questions?
Thank You! Emilee Le. Donne, Strategic Account Manager Katie Burgess, Customer Success Manager Evan Brock, Customer Success Specialist
Appendix
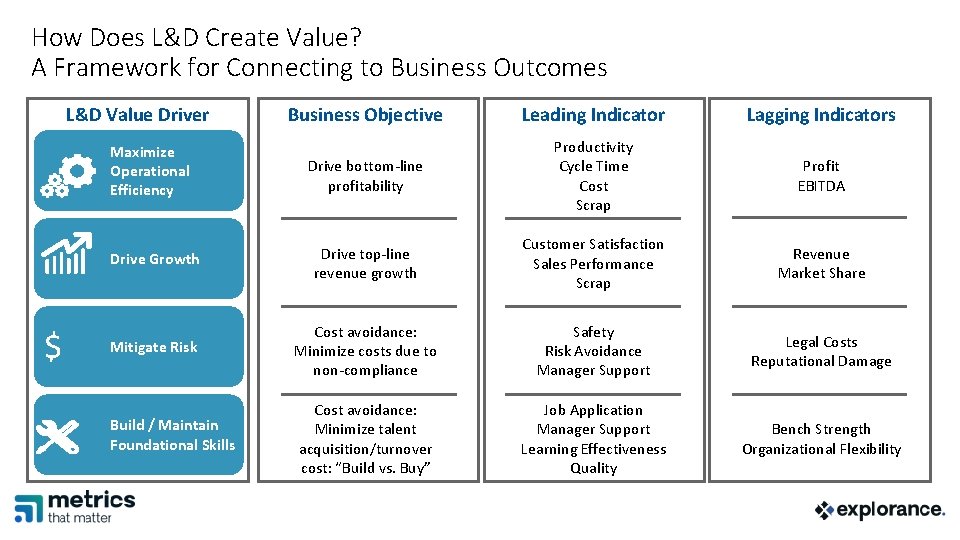
How Does L&D Create Value? A Framework for Connecting to Business Outcomes L&D Value Driver Business Objective Leading Indicator Lagging Indicators Drive bottom-line profitability Productivity Cycle Time Cost Scrap Profit EBITDA Drive Growth Drive top-line revenue growth Customer Satisfaction Sales Performance Scrap Revenue Market Share Mitigate Risk Cost avoidance: Minimize costs due to non-compliance Safety Risk Avoidance Manager Support Legal Costs Reputational Damage Build / Maintain Foundational Skills Cost avoidance: Minimize talent acquisition/turnover cost: “Build vs. Buy” Job Application Manager Support Learning Effectiveness Quality Bench Strength Organizational Flexibility Maximize Operational Efficiency $
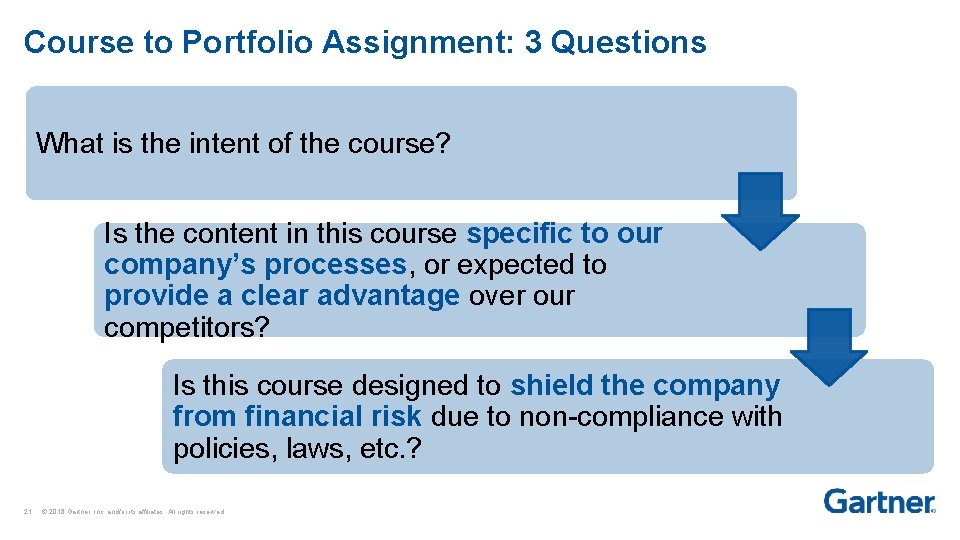
Course to Portfolio Assignment: 3 Questions What is the intent of the course? Is the content in this course specific to our company’s processes, or expected to provide a clear advantage over our competitors? Is this course designed to shield the company from financial risk due to non-compliance with policies, laws, etc. ? Remember: Align to VALUE, not according to TOPIC 21 © 2018 Gartner, Inc. and/or its affiliates. All rights reserved.
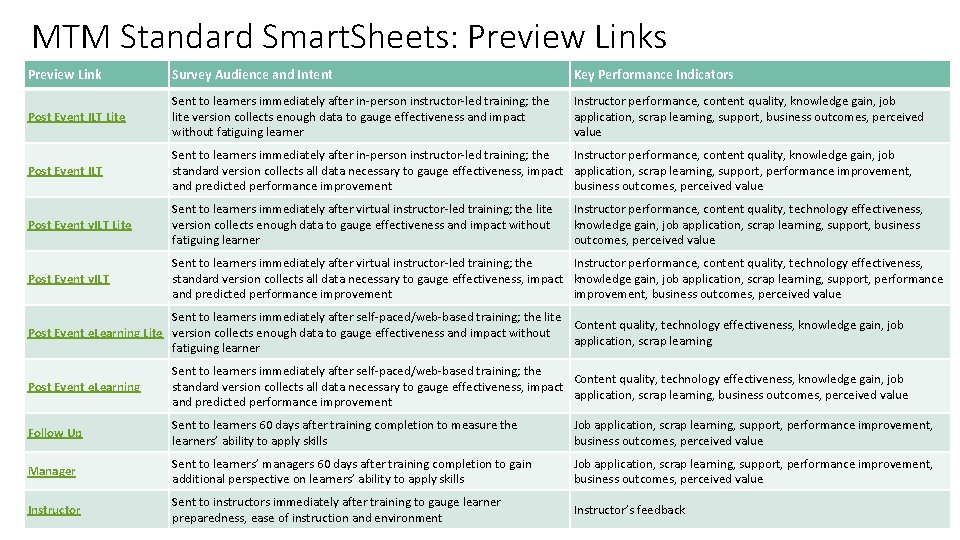
MTM Standard Smart. Sheets: Preview Links Preview Link Survey Audience and Intent Key Performance Indicators Post Event ILT Lite Sent to learners immediately after in-person instructor-led training; the lite version collects enough data to gauge effectiveness and impact without fatiguing learner Instructor performance, content quality, knowledge gain, job application, scrap learning, support, business outcomes, perceived value Post Event ILT Sent to learners immediately after in-person instructor-led training; the Instructor performance, content quality, knowledge gain, job standard version collects all data necessary to gauge effectiveness, impact application, scrap learning, support, performance improvement, and predicted performance improvement business outcomes, perceived value Post Event v. ILT Lite Sent to learners immediately after virtual instructor-led training; the lite version collects enough data to gauge effectiveness and impact without fatiguing learner Post Event v. ILT Sent to learners immediately after virtual instructor-led training; the Instructor performance, content quality, technology effectiveness, standard version collects all data necessary to gauge effectiveness, impact knowledge gain, job application, scrap learning, support, performance and predicted performance improvement, business outcomes, perceived value Instructor performance, content quality, technology effectiveness, knowledge gain, job application, scrap learning, support, business outcomes, perceived value Sent to learners immediately after self-paced/web-based training; the lite Content quality, technology effectiveness, knowledge gain, job Post Event e. Learning Lite version collects enough data to gauge effectiveness and impact without application, scrap learning fatiguing learner Post Event e. Learning Sent to learners immediately after self-paced/web-based training; the Content quality, technology effectiveness, knowledge gain, job standard version collects all data necessary to gauge effectiveness, impact application, scrap learning, business outcomes, perceived value and predicted performance improvement Follow Up Sent to learners 60 days after training completion to measure the learners’ ability to apply skills Job application, scrap learning, support, performance improvement, business outcomes, perceived value Manager Sent to learners’ managers 60 days after training completion to gain additional perspective on learners’ ability to apply skills Job application, scrap learning, support, performance improvement, business outcomes, perceived value Instructor Sent to instructors immediately after training to gauge learner preparedness, ease of instruction and environment Instructor’s feedback
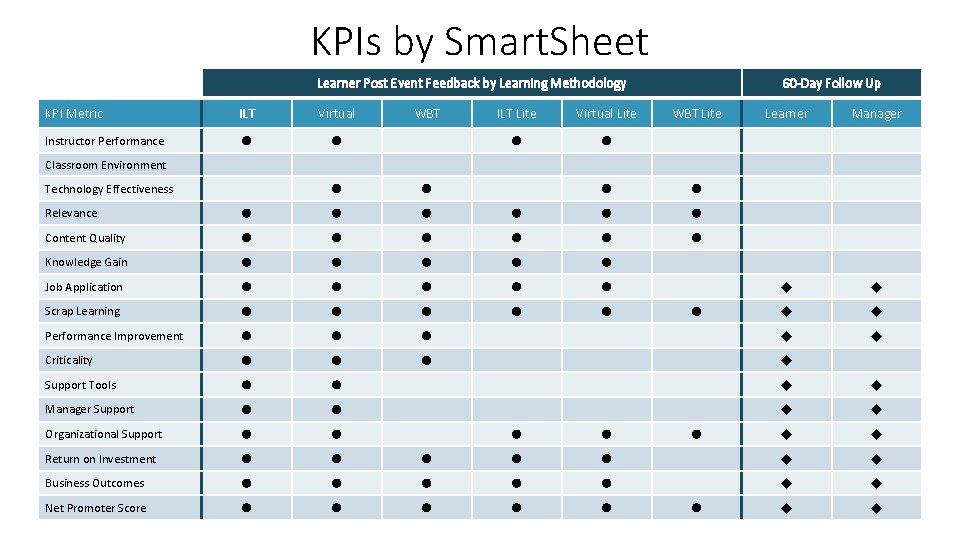
KPIs by Smart. Sheet Learner Post Event Feedback by Learning Methodology KPI Metric ILT Virtual Instructor Performance l l WBT ILT Lite Virtual Lite l l 60 -Day Follow Up WBT Lite Learner Manager u u u Classroom Environment Technology Effectiveness l l Relevance l l l Content Quality l l l Knowledge Gain l l l Job Application l l l Scrap Learning l l l Performance Improvement l l l u Criticality l l l u Support Tools l l u u Manager Support l l u u Organizational Support l l u u Return on Investment l l Business Outcomes l Net Promoter Score l l l l u u l
- Slides: 23