
MTM Dashboards Standard Templates Configuration Guide 2018 Explorance

MTM Dashboards: Standard Templates & Configuration Guide © 2018 Explorance, Inc. and/or its affiliates. All rights reserved. Explorance is a registered trademark of Explorance, Inc. or its affiliates. This presentation, including all supporting materials, is proprietary to Explorance, Inc. and/or its affiliates and is for the sole internal use of the intended recipients. Because this presentation may contain information that is confidential, proprietary or otherwise legally protected, it may not be further copied, distributed or publicly displayed without the express written permission of Explorance, Inc. or its affiliates.
Template Overviews Includes configuration details and implementation guidance © 2018 Explorance, Inc. and/or its affiliates. All rights reserved. Explorance is a registered trademark of Explorance, Inc. or its affiliates. This presentation, including all supporting materials, is proprietary to Explorance, Inc. and/or its affiliates and is for the sole internal use of the intended recipients. Because this presentation may contain information that is confidential, proprietary or otherwise legally protected, it may not be further copied, distributed or publicly displayed without the express written permission of Explorance, Inc. or its affiliates.
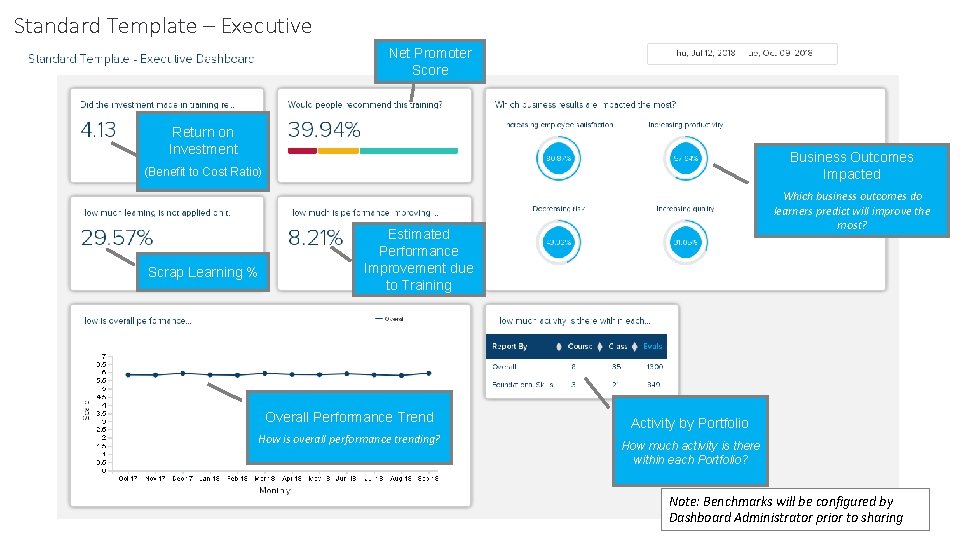
Standard Template – Executive Net Promoter Score Return on Investment Business Outcomes Impacted (Benefit to Cost Ratio) Scrap Learning % Which business outcomes do learners predict will improve the most? Estimated Performance Improvement due to Training Overall Performance Trend How is overall performance trending? Activity by Portfolio How much activity is there within each Portfolio? Note: Benchmarks will be configured by Dashboard Administrator prior to sharing
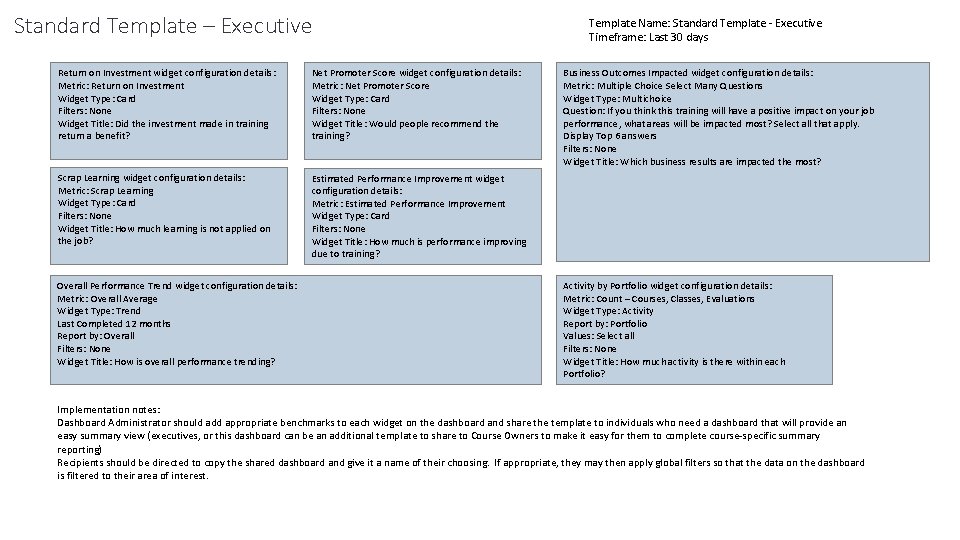
Standard Template – Executive Return on Investment widget configuration details: Metric: Return on Investment Widget Type: Card Filters: None Widget Title: Did the investment made in training return a benefit? Net Promoter Score widget configuration details: Metric: Net Promoter Score Widget Type: Card Filters: None Widget Title: Would people recommend the training? Scrap Learning widget configuration details: Metric: Scrap Learning Widget Type: Card Filters: None Widget Title: How much learning is not applied on the job? Estimated Performance Improvement widget configuration details: Metric: Estimated Performance Improvement Widget Type: Card Filters: None Widget Title: How much is performance improving due to training? Overall Performance Trend widget configuration details: Metric: Overall Average Widget Type: Trend Last Completed 12 months Report by: Overall Filters: None Widget Title: How is overall performance trending? Template Name: Standard Template - Executive Timeframe: Last 30 days Business Outcomes Impacted widget configuration details: Metric: Multiple Choice Select Many Questions Widget Type: Multichoice Question: If you think this training will have a positive impact on your job performance, what areas will be impacted most? Select all that apply. Display Top 6 answers Filters: None Widget Title: Which business results are impacted the most? Activity by Portfolio widget configuration details: Metric: Count – Courses, Classes, Evaluations Widget Type: Activity Report by: Portfolio Values: Select all Filters: None Widget Title: How much activity is there within each Portfolio? Implementation notes: Dashboard Administrator should add appropriate benchmarks to each widget on the dashboard and share the template to individuals who need a dashboard that will provide an easy summary view (executives, or this dashboard can be an additional template to share to Course Owners to make it easy for them to complete course-specific summary reporting) Recipients should be directed to copy the shared dashboard and give it a name of their choosing. If appropriate, they may then apply global filters so that the data on the dashboard is filtered to their area of interest.
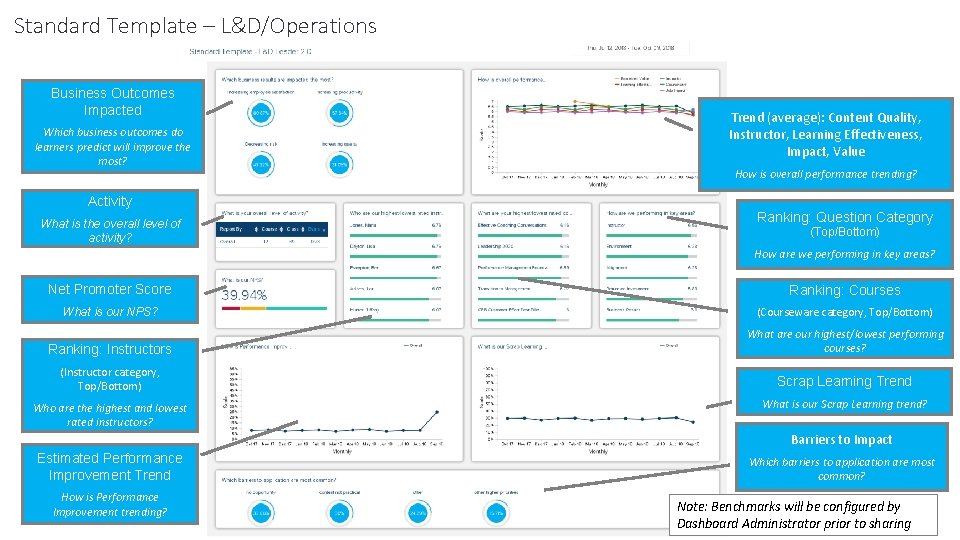
Standard Template – L&D/Operations Business Outcomes Impacted Which business outcomes do learners predict will improve the most? Trend (average): Content Quality, Instructor, Learning Effectiveness, Impact, Value How is overall performance trending? Activity What is the overall level of activity? Ranking: Question Category (Top/Bottom) How are we performing in key areas? Net Promoter Score Ranking: Courses What is our NPS? (Courseware category, Top/Bottom) Ranking: Instructors What are our highest/lowest performing courses? (Instructor category, Top/Bottom) Scrap Learning Trend Who are the highest and lowest rated instructors? What is our Scrap Learning trend? Barriers to Impact Estimated Performance Improvement Trend How is Performance Improvement trending? Which barriers to application are most common? Note: Benchmarks will be configured by Dashboard Administrator prior to sharing
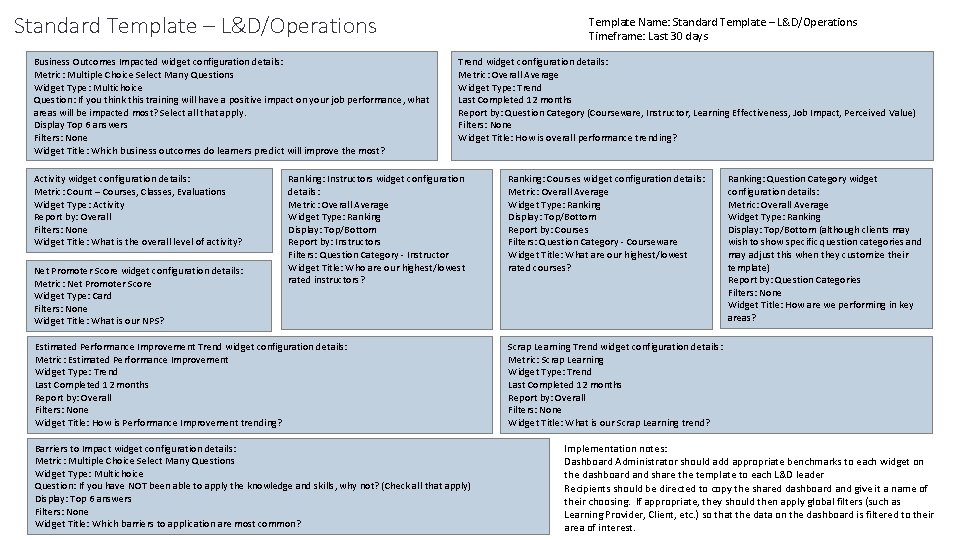
Standard Template – L&D/Operations Business Outcomes Impacted widget configuration details: Metric: Multiple Choice Select Many Questions Widget Type: Multichoice Question: If you think this training will have a positive impact on your job performance, what areas will be impacted most? Select all that apply. Display Top 6 answers Filters: None Widget Title: Which business outcomes do learners predict will improve the most? Activity widget configuration details: Metric: Count – Courses, Classes, Evaluations Widget Type: Activity Report by: Overall Filters: None Widget Title: What is the overall level of activity? Net Promoter Score widget configuration details: Metric: Net Promoter Score Widget Type: Card Filters: None Widget Title: What is our NPS? Template Name: Standard Template – L&D/Operations Timeframe: Last 30 days Trend widget configuration details: Metric: Overall Average Widget Type: Trend Last Completed 12 months Report by: Question Category (Courseware, Instructor, Learning Effectiveness, Job Impact, Perceived Value) Filters: None Widget Title: How is overall performance trending? Ranking: Instructors widget configuration details: Metric: Overall Average Widget Type: Ranking Display: Top/Bottom Report by: Instructors Filters: Question Category - Instructor Widget Title: Who are our highest/lowest rated instructors? Estimated Performance Improvement Trend widget configuration details: Metric: Estimated Performance Improvement Widget Type: Trend Last Completed 12 months Report by: Overall Filters: None Widget Title: How is Performance Improvement trending? Barriers to Impact widget configuration details: Metric: Multiple Choice Select Many Questions Widget Type: Multichoice Question: If you have NOT been able to apply the knowledge and skills, why not? (Check all that apply) Display: Top 6 answers Filters: None Widget Title: Which barriers to application are most common? Ranking: Courses widget configuration details: Metric: Overall Average Widget Type: Ranking Display: Top/Bottom Report by: Courses Filters: Question Category - Courseware Widget Title: What are our highest/lowest rated courses? Ranking: Question Category widget configuration details: Metric: Overall Average Widget Type: Ranking Display: Top/Bottom (although clients may wish to show specific question categories and may adjust this when they customize their template) Report by: Question Categories Filters: None Widget Title: How are we performing in key areas? Scrap Learning Trend widget configuration details: Metric: Scrap Learning Widget Type: Trend Last Completed 12 months Report by: Overall Filters: None Widget Title: What is our Scrap Learning trend? Implementation notes: Dashboard Administrator should add appropriate benchmarks to each widget on the dashboard and share the template to each L&D leader Recipients should be directed to copy the shared dashboard and give it a name of their choosing. If appropriate, they should then apply global filters (such as Learning Provider, Client, etc. ) so that the data on the dashboard is filtered to their area of interest.

Standard Template – Course Owner Business Outcomes Impacted Which business outcomes do learners predict will improve the most? Trend: Content Quality, Instructor, Learning Effectiveness, Impact, Value How are my performing against KPIs over time? Ranking: Courses (Courseware category, Top/Bottom) What are our highest/lowest performing courses? Scrap Learning Trend Is Scrap decreasing across my courses? Ranking: Courses (NPS, Top/Bottom) Which courses have the highest Scrap? Activity by Portfolio Are my courses being delivered? Ranking: Courses Barriers to Impact (Scrap Learning, Top/Bottom) What are the biggest barriers to application? Which courses have the highest Scrap? Note: Benchmarks will be configured by Dashboard Administrator prior to sharing

Standard Template – Course Owner Template Name: Standard Template – Course Owner Timeframe: Last 30 days Business Outcomes Impacted widget configuration details: Metric: Multiple Choice Select Many Questions Widget Type: Multichoice Question: If you think this training will have a positive impact on your job performance, what areas will be impacted most? Select all that apply. Display Top 6 answers Filters: None Widget Title: Which business results are impacted the most? Scrap Learning Trend widget configuration details: Metric: Scrap Learning Widget Type: Trend Last Completed 12 months Report by: Overall Filters: None Widget Title: Is Scrap decreasing across my courses? Trend widget configuration details: Metric: Overall Average Widget Type: Trend Last Completed 12 months Report by: Question Category (Courseware, Instructor, Learning Effectiveness, Job Impact, Perceived Value) Filters: None Widget Title: How is overall performance trending? Ranking: Courses widget configuration details: Metric: Overall Average Widget Type: Ranking Display: Top/Bottom Report by: Courses Filters: Question Category - Courseware Widget Title: What are our highest/lowest rated courses? Ranking: Courses (Scrap Learning) widget configuration details: Metric: Scrap Learning Widget Type: Ranking Display: Top/Bottom Report by: Courses Widget Title: Which courses have the highest Scrap? Barriers to Impact widget configuration details: Metric: Multiple Choice Select Many Questions Widget Type: Multichoice Question: If you have NOT been able to apply the knowledge and skills, why not? (Check all that apply) Display: Top 6 answers Filters: None Widget Title: What are the biggest barriers to application? Ranking: Courses (NPS) widget configuration details: Metric: Net Promoter Score Widget Type: Ranking Display: Top/Bottom Report by: Courses Widget Title: Which of my courses are learners recommending the most? Activity widget configuration details: Metric: Count – Courses, Classes, Evaluations Widget Type: Activity Report by: Portfolio Display all Filters: None Widget Title: Are my courses being delivered? Implementation notes: Dashboard Administrator should add appropriate benchmarks to each widget on the dashboard and share the template to each Course Owner (should be the same as a Course Report Recipient) Course Owners should be directed to copy the shared dashboard and give it a name of their choosing. They should then apply a global filter of Course Report Recipient and select themselves so that the data on the dashboard is filtered to their own courses.
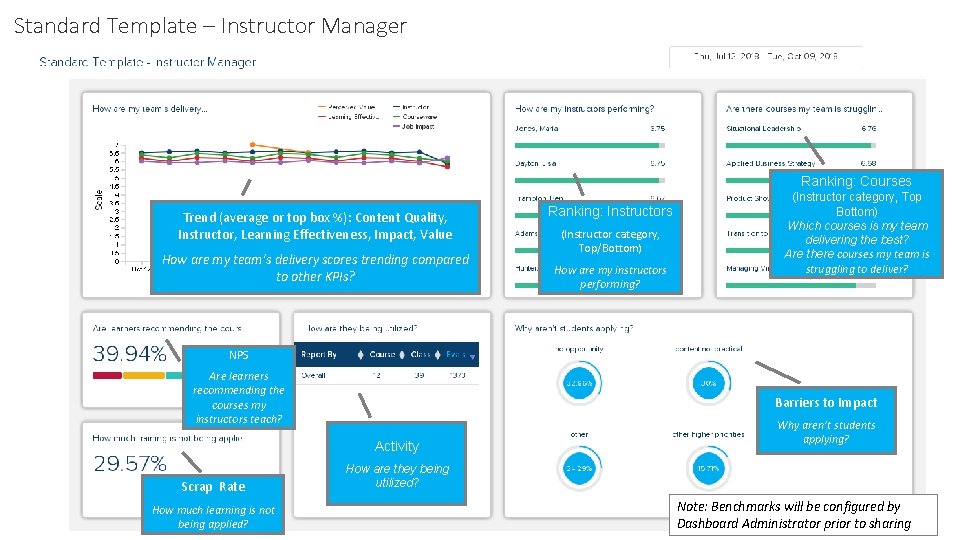
Standard Template – Instructor Manager Ranking: Courses Trend (average or top box %): Content Quality, Instructor, Learning Effectiveness, Impact, Value How are my team’s delivery scores trending compared to other KPIs? Ranking: Instructors (Instructor category, Top/Bottom) How are my instructors performing? (Instructor category, Top Bottom) Which courses is my team delivering the best? Are there courses my team is struggling to deliver? NPS Are learners recommending the courses my instructors teach? Barriers to Impact Activity Scrap Rate How much learning is not being applied? Why aren’t students applying? How are they being utilized? Note: Benchmarks will be configured by Dashboard Administrator prior to sharing

Standard Template – Instructor Manager Template Name: Standard Template – Instructor Manager Timeframe: Last 30 days Trend widget configuration details: Metric: Overall Average Widget Type: Trend Last Completed 12 months Report by: Question Category (Courseware, Instructor, Learning Effectiveness, Job Impact, Perceived Value) Filters: None Widget Title: How are my team’s delivery scores trending compared to other KPIs? Ranking: Instructors widget configuration details: Metric: Overall Average Widget Type: Ranking Display: Top/Bottom Report by: Instructors Filters: Question Category - Instructor Widget Title: How are my instructors performing? Net Promoter Score widget configuration details: Metric: Net Promoter Score Widget Type: Card Filters: None Widget Title: What is our NPS? Barriers to Impact widget configuration details: Metric: Multiple Choice Select Many Questions Widget Type: Multichoice Question: If you have NOT been able to apply the knowledge and skills, why not? (Check all that apply) Display: Top 6 answers Filters: None Widget Title: Why aren’t students applying? Scrap Rate widget configuration details: Metric: Scrap Learning Widget Type: Card Filters: None Widget Title: How much learning is not being applied? Activity widget configuration details: Metric: Count – Courses, Classes, Evaluations Widget Type: Activity Report by: Overall Filters: None Widget Title: How are they being utilized? Ranking: Courses widget configuration details: Metric: Overall Average Widget Type: Ranking Display: Top/Bottom Report by: Courses Filters: Question Category - Instructor Widget Title: Are there courses my team is struggling to deliver? Implementation notes: Dashboard Administrator should add appropriate benchmarks to each widget on the dashboard and share the template to each instructor Manager Instructor Managers should be directed to copy the shared dashboard and give it a name of their choosing. They should then apply a global filter of Instructor Manager and select themselves so that the data on the dashboard is filtered to their own team.
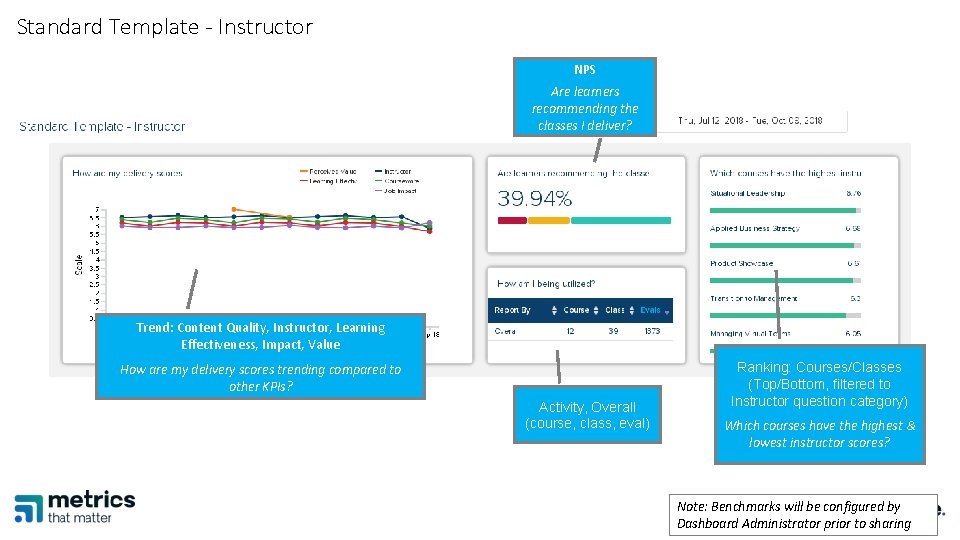
Standard Template - Instructor NPS Are learners recommending the classes I deliver? Trend: Content Quality, Instructor, Learning Effectiveness, Impact, Value How are my delivery scores trending compared to other KPIs? Activity, Overall (course, class, eval) Ranking: Courses/Classes (Top/Bottom, filtered to Instructor question category) Which courses have the highest & lowest instructor scores? Note: Benchmarks will be configured by Dashboard Administrator prior to sharing
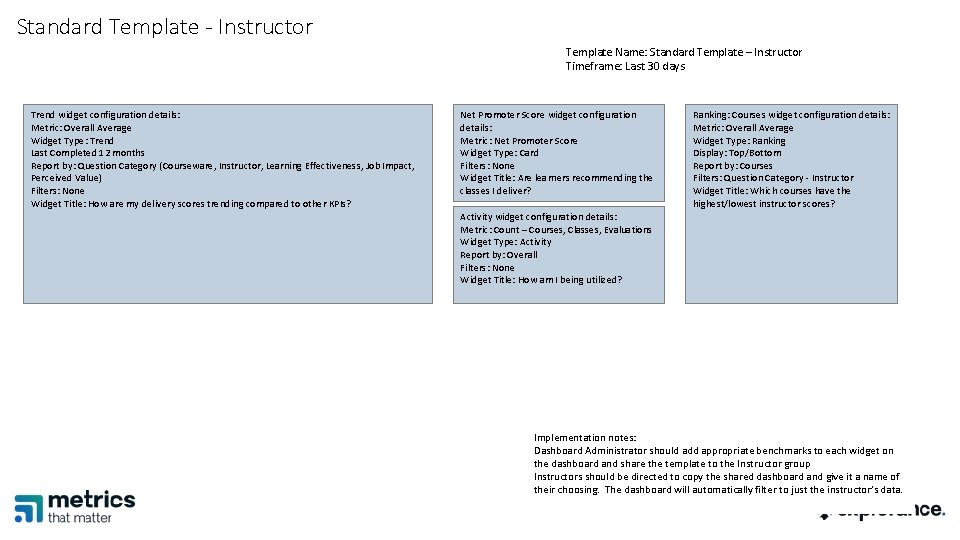
Standard Template - Instructor Template Name: Standard Template – Instructor Timeframe: Last 30 days Trend widget configuration details: Metric: Overall Average Widget Type: Trend Last Completed 12 months Report by: Question Category (Courseware, Instructor, Learning Effectiveness, Job Impact, Perceived Value) Filters: None Widget Title: How are my delivery scores trending compared to other KPIs? Net Promoter Score widget configuration details: Metric: Net Promoter Score Widget Type: Card Filters: None Widget Title: Are learners recommending the classes I deliver? Ranking: Courses widget configuration details: Metric: Overall Average Widget Type: Ranking Display: Top/Bottom Report by: Courses Filters: Question Category - Instructor Widget Title: Which courses have the highest/lowest instructor scores? Activity widget configuration details: Metric: Count – Courses, Classes, Evaluations Widget Type: Activity Report by: Overall Filters: None Widget Title: How am I being utilized? Implementation notes: Dashboard Administrator should add appropriate benchmarks to each widget on the dashboard and share the template to the Instructor group Instructors should be directed to copy the shared dashboard and give it a name of their choosing. The dashboard will automatically filter to just the instructor’s data.
Template examples with benchmarks © 2018 Explorance, Inc. and/or its affiliates. All rights reserved. Explorance is a registered trademark of Explorance, Inc. or its affiliates. This presentation, including all supporting materials, is proprietary to Explorance, Inc. and/or its affiliates and is for the sole internal use of the intended recipients. Because this presentation may contain information that is confidential, proprietary or otherwise legally protected, it may not be further copied, distributed or publicly displayed without the express written permission of Explorance, Inc. or its affiliates.
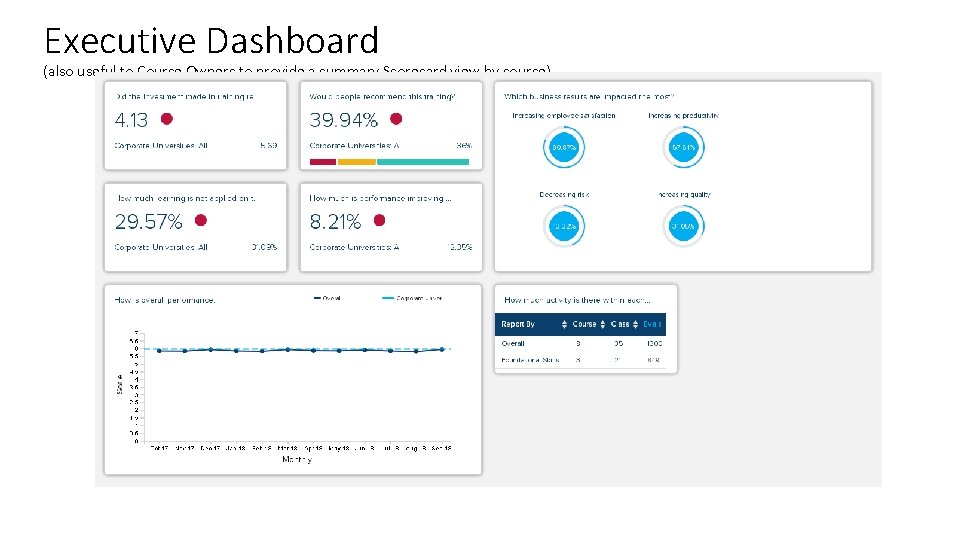
Executive Dashboard (also useful to Course Owners to provide a summary Scorecard view by course)
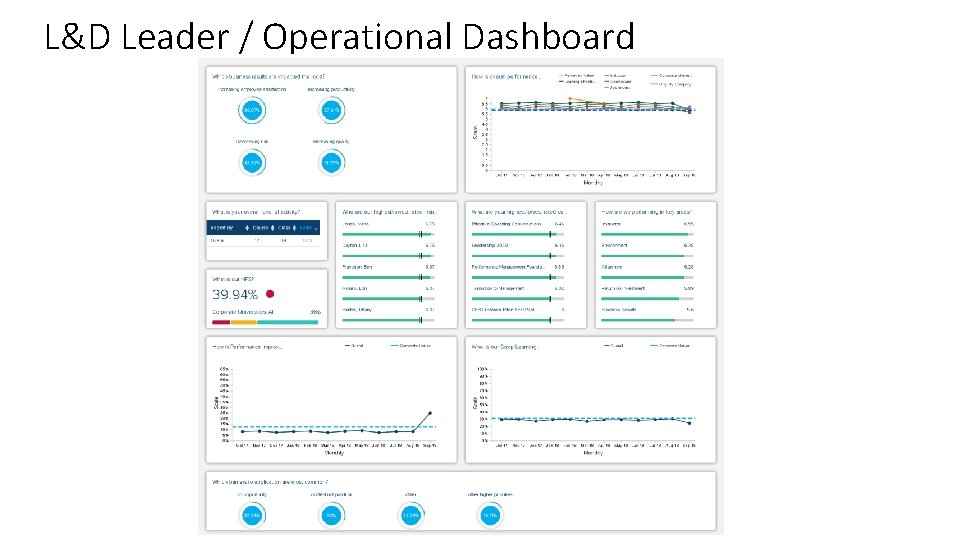
L&D Leader / Operational Dashboard
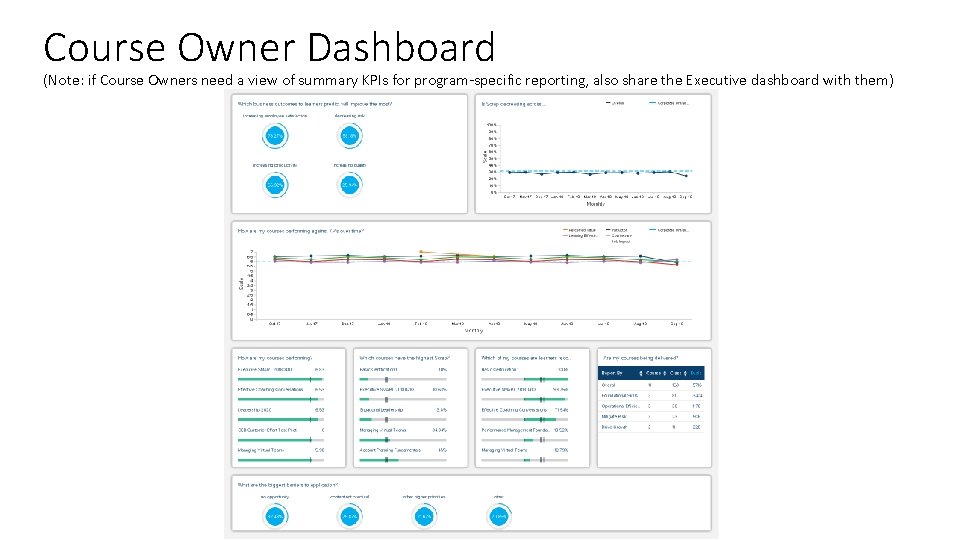
Course Owner Dashboard (Note: if Course Owners need a view of summary KPIs for program-specific reporting, also share the Executive dashboard with them)

Standard Template – Instructor Manager

Standard Template - Instructor
- Slides: 18