
MTA Bus Scheduling Zen Bakshi Thomas Mecattaf Dessi

MTA Bus Scheduling Zen Bakshi, Thomas Mecattaf, Dessi Javier Gando Narvaez, Natalie Schmidt
Problem ● “The Other Transit Crisis”: 2017 report by NYC Comptroller Scott M. Stringer ● Jobs shifting outside of Manhattan ○ ○ Hub-and-spoke subway system designed to bring workers into Manhattan Employment growth 2006 -2016: Brooklyn, 49%; Bronx, 35%; Queens, 34%, Staten Island, 27%; versus Manhattan, 5% ● NYC lags behind nearly every other major metropolitan area ○ Average bus speed is 7. 4 mph, slowest of the 17 largest bus systems in the country ● Disproportionately affects lower-income New Yorkers, immigrants, and people of color ○ ○ Avg bus commuter salary = $28, 455 (Avg subway = $40, 000; avg NYC = $38, 840) 55% bus commuters foreign-born, 75% people of color
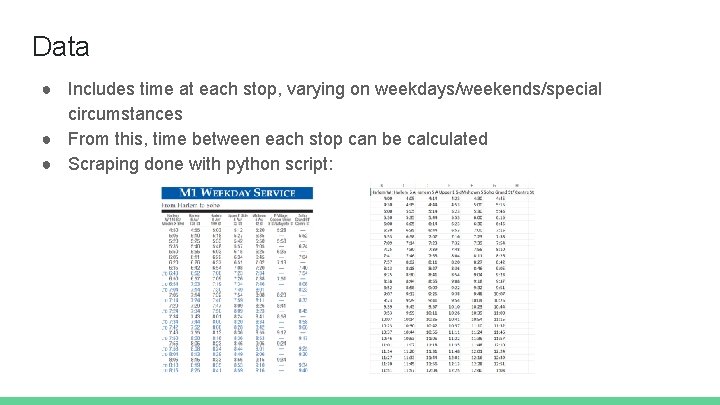
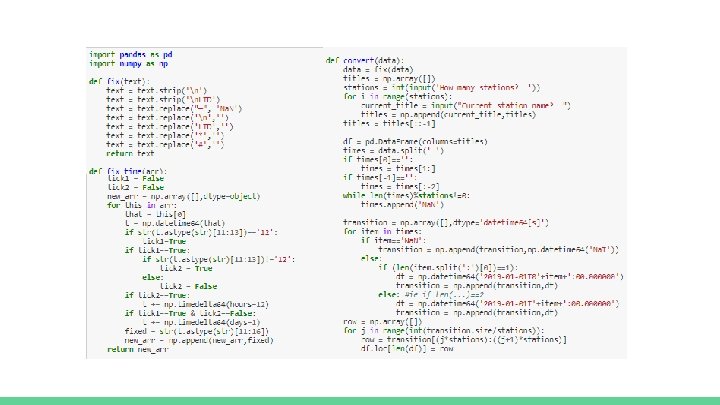
Data ● Includes time at each stop, varying on weekdays/weekends/special circumstances ● From this, time between each stop can be calculated ● Scraping done with python script:
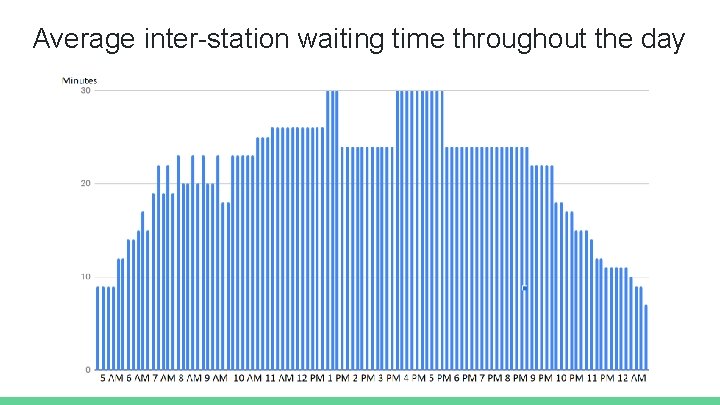
Average inter-station waiting time throughout the day
Papers Model 1: Re-making the entire transit system Model 2 a: Linear program to minimize waiting time Model 2 b: Genetic algorithm to optimize bus timetables
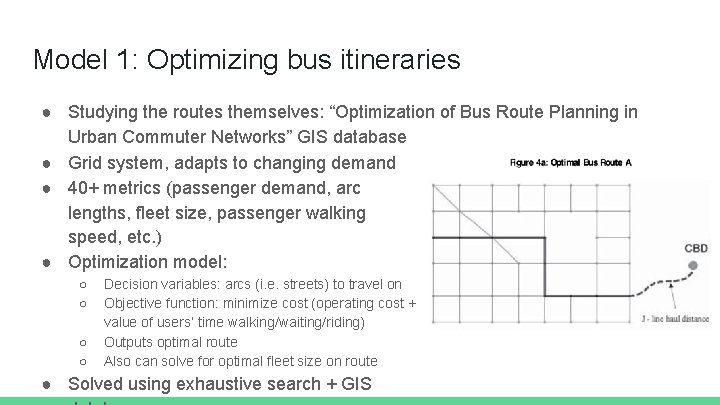
Model 1: Optimizing bus itineraries ● Studying the routes themselves: “Optimization of Bus Route Planning in Urban Commuter Networks” GIS database ● Grid system, adapts to changing demand ● 40+ metrics (passenger demand, arc lengths, fleet size, passenger walking speed, etc. ) ● Optimization model: ○ ○ Decision variables: arcs (i. e. streets) to travel on Objective function: minimize cost (operating cost + value of users’ time walking/waiting/riding) Outputs optimal route Also can solve for optimal fleet size on route ● Solved using exhaustive search + GIS
Model 1: Optimizing bus itineraries ● Actually applicable? ○ ○ Needs extensive GIS mapping data Still have 40+ metrics MTA data nowhere near complete enough Exhaustive search is exhausting! ● Still key takeaways: 1. Many-to-one vs. many-to-few: can similarly limit number of routes to consider by limiting destinations to a few key central locations in outer boroughs (downtown Brooklyn, Long Island City, etc. ) 2. Optimal buses per route: can’t find good, let alone optimal, way to schedule jobs unless the right number of jobs are being scheduled
Model 2 a: Linear program to minimize waiting time ● Optimize schedule → min total wait time ● We combine the waiting time of each passenger to get total waiting time ● Assumptions: ○ ○ ○ Bus capacity non-limiting (everyone waiting can board the bus when it arrives) Wait times of all passengers are equally important Total waiting time for buses are equal ● Decision Variables: ○ ○ Ni : the number of buses running during time interval i Bi : the inter-bus arrival time during time interval i ● First model: passenger arrival is deterministic ○ ○ Easily determine wait time as difference between arrival time and scheduled bus arrival time Multiply the wait time of one bus by the number of buses that arrive during interval i
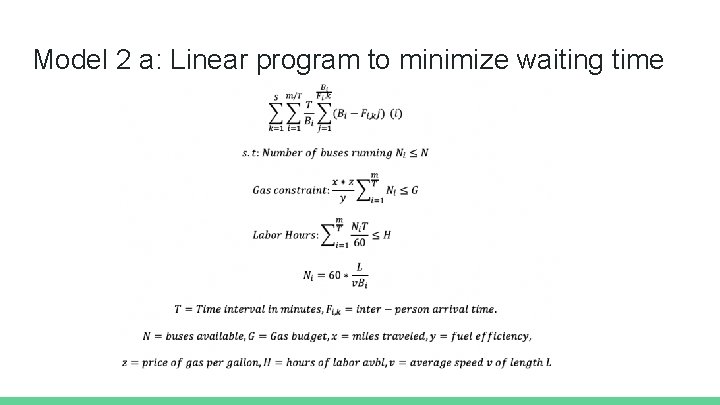
Model 2 a: Linear program to minimize waiting time
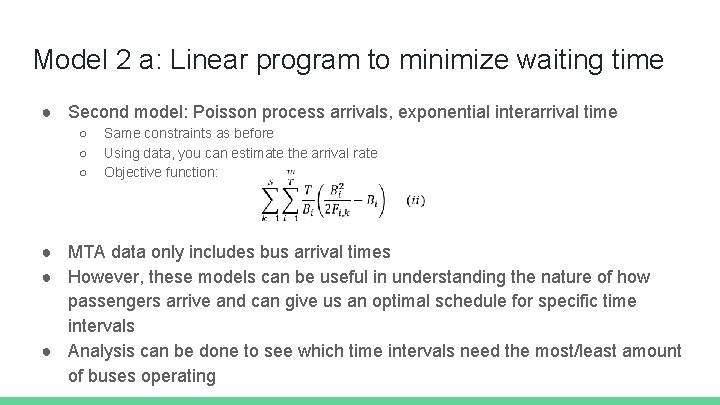
Model 2 a: Linear program to minimize waiting time ● Second model: Poisson process arrivals, exponential interarrival time ○ ○ ○ Same constraints as before Using data, you can estimate the arrival rate Objective function: ● MTA data only includes bus arrival times ● However, these models can be useful in understanding the nature of how passengers arrive and can give us an optimal schedule for specific time intervals ● Analysis can be done to see which time intervals need the most/least amount of buses operating
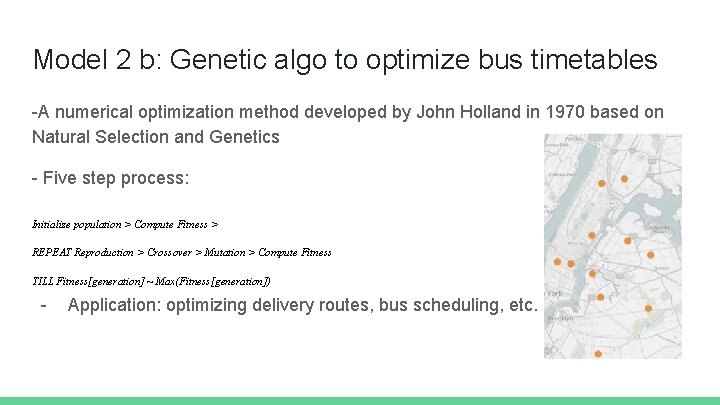
Model 2 b: Genetic algo to optimize bus timetables -A numerical optimization method developed by John Holland in 1970 based on Natural Selection and Genetics - Five step process: Initialize population > Compute Fitness > REPEAT Reproduction > Crossover > Mutation > Compute Fitness TILL Fitness[generation] ~ Max(Fitness[generation]) - Application: optimizing delivery routes, bus scheduling, etc.

Genetic Algorithm LP and Procedure Size of string = k * 3 - eg. 110010101 for 3 routes If Nk, min is 6, 9, 8 what is Nk? Assign low fitness value if: - Fleet size less than base fleet size OR - Number of passengers exceed capacity Maximize fitness value
Results
- Slides: 14