MST 101 Descriptive Statistics Descriptive Statistics l Purpose


 ¡ Possible to calculate relative standings like")


- Slides: 24
MST 101 Descriptive Statistics
Descriptive Statistics l Purpose – to describe or summarize data in a parsimonious manner l Four types ¡ Central tendency ¡ Variability ¡ Relative position ¡ Relationships
Descriptive Statistics l Graphing data – a frequency polygon ¡ ¡ Vertical axis represents the frequency with which a score occurs Horizontal axis represents the scores themselves
Central Tendency l Purpose – to represent the typical score attained by subjects l Three common measures ¡ Mode ¡ Median ¡ Mean
Central Tendency l Mode ¡ ¡ l The most frequently occurring score Appropriate for nominal data Median ¡ ¡ The score above and below which 50% of all scores lie (i. e. , the mid-point) Characteristics l l Appropriate for ordinal scales Doesn’t take into account the value of each and every score in the data
Central Tendency l Mean ¡ The arithmetic average of all scores ¡ Characteristics Advantageous statistical properties l Affected by outlying scores l Most frequently used measure of central tendency l ¡ Formula
Variability l Purpose – to measure the extent to which scores are spread apart l Four measures ¡ Range ¡ Quartile deviation ¡ Variance ¡ Standard deviation
Variability l Range ¡ The difference between the highest and lowest score in a data set ¡ Characteristics Unstable measure of variability l Rough, quick estimate l
Variability l Quartile deviation ¡ One-half the difference between the upper and lower quartiles in a distribution ¡ Characteristic - appropriate when the median is being used
Variability l Standard deviation ¡ The square root of the variance ¡ Characteristics Many important statistical properties l Relationship to properties of the normal curve l Easily interpreted l ¡ Formula
The Normal Curve l. A bell shaped curve reflecting the distribution of many variables of interest to educators
The Normal Curve l Characteristics ¡ ¡ Fifty-percent of the scores fall above the mean and fiftypercent fall below the mean The mean, median, and mode are the same values Most participants score near the mean; the further a score is from the mean the fewer the number of participants who attained that score Specific numbers or percentages of scores fall between +/-1 SD, +/-2 SD, etc.
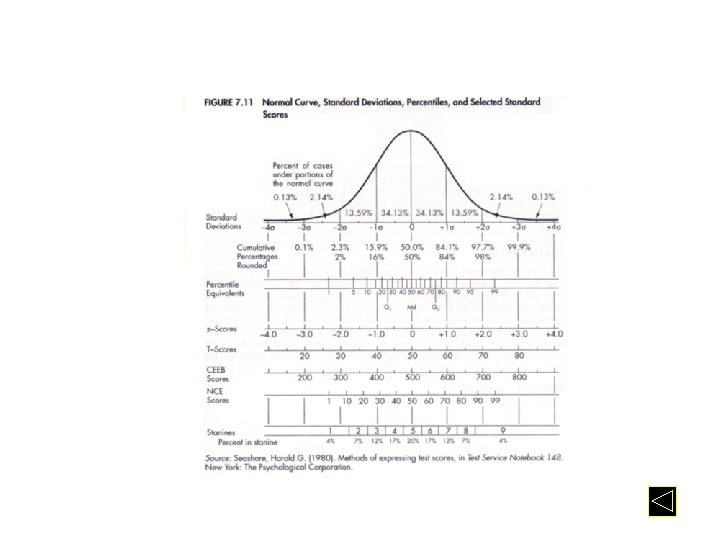
The Normal Curve l Properties ¡ Proportions under the curve +/-1 SD 68% l +/-2 SD 95% l +/-3 SD 99% l ¡ Cumulative proportions and percentiles SD = Standard Deviation
Skewed Distributions Positive – many low scores and few high scores l Negative – few low scores and many high scores l Relationships between the mean, median, and mode l ¡ ¡ Positively skewed – mode is lowest, median is in the middle, and mean is highest Negatively skewed – mean is lowest, median is in the middle, and mode is highest
Measures of Relative Position l Purpose – indicates where a score is in relation to all other scores in the distribution l Characteristics ¡ Clear estimates of relative positions ¡ Possible to compare students’ performances across two or more different tests provided the scores are based on the same group
Measures of Relative Position l Z-score ¡ ¡ ¡ The deviation of a score from the mean in standard deviation units The basic standard score from which all other standard scores are calculated Characteristics l l Mean = 0 Standard deviation = 1 Positive if the score is above the mean and negative if it is below the mean Relationship with the area under the normal curve
Measures of Relative Position l Z-score (continued) ¡ Possible to calculate relative standings like the percent better than a score, the percent falling between two scores, the percent falling between the mean and a score, etc. ¡ Formula
Measures of Relative Position l T-score – a transformation of a z-score where t = 10(Z) + 50 ¡ Characteristics Mean = 50 l Standard deviation = 10 l No negative scores l
Measures of Relationship Purpose – to provide an indication of the relationship between two variables l Characteristics of correlation coefficients l ¡ ¡ l Strength or magnitude – 0 to 1 Direction – positive (+) or negative (-) Types of correlations coefficients – dependent on the scales of measurement of the variables ¡ ¡ Spearman Rho – ranked data Pearson r – interval or ratio data
Formula for the Mean
Formula for Standard Deviation
Formula for Pearson Correlation
Formula for Z-Score