
MSL Medical Stop Loss The Role of Captives

- Slides: 19
MSL Medical Stop Loss The Role of Captives in Financing / Mitigating Risk
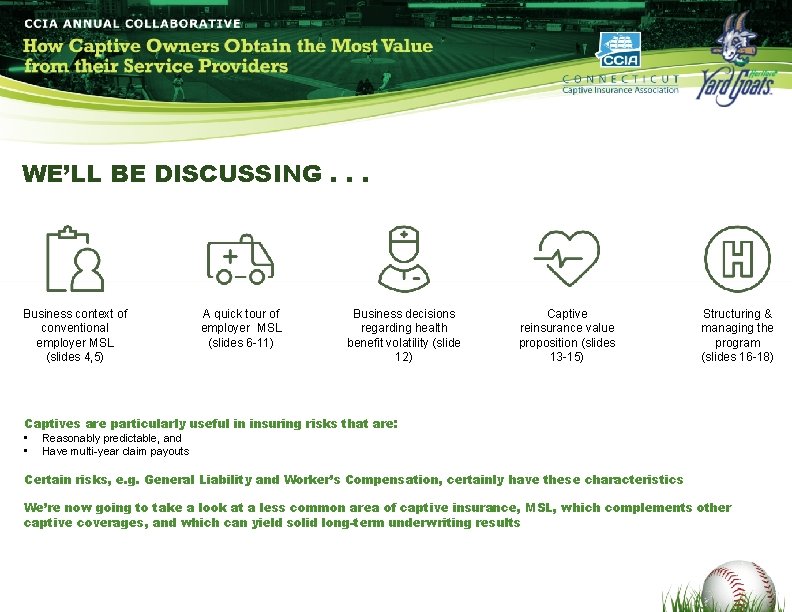
WE’LL BE DISCUSSING. . . Business context of conventional employer MSL (slides 4, 5) A quick tour of employer MSL (slides 6 -11) Business decisions regarding health benefit volatility (slide 12) Captive reinsurance value proposition (slides 13 -15) Structuring & managing the program (slides 16 -18) Captives are particularly useful in insuring risks that are: • Reasonably predictable, and • Have multi-year claim payouts Certain risks, e. g. General Liability and Worker’s Compensation, certainly have these characteristics We’re now going to take a look at a less common area of captive insurance, MSL, which complements other captive coverages, and which can yield solid long-term underwriting results
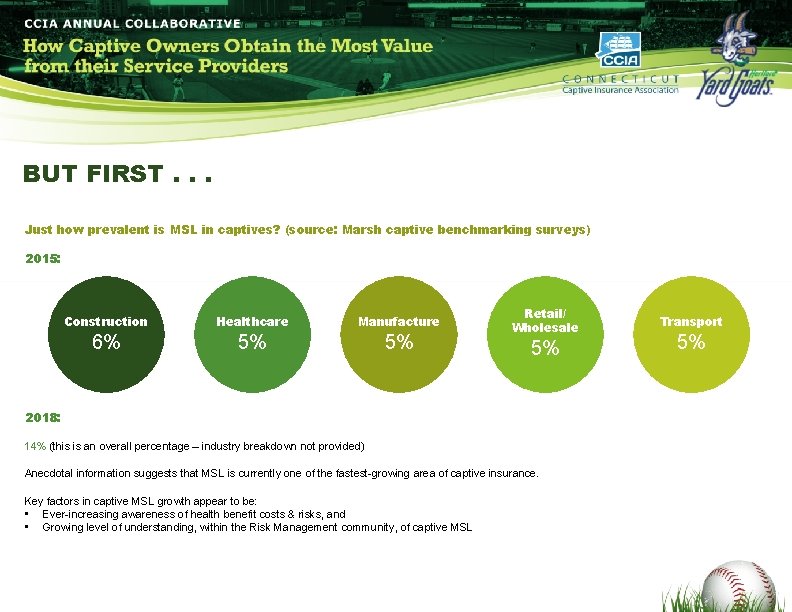
BUT FIRST. . . Just how prevalent is MSL in captives? (source: Marsh captive benchmarking surveys) 2015: Construction Healthcare Manufacture 6% 5% 5% Retail/ Wholesale 5% 2018: 14% (this is an overall percentage – industry breakdown not provided) Anecdotal information suggests that MSL is currently one of the fastest-growing area of captive insurance. Key factors in captive MSL growth appear to be: • Ever-increasing awareness of health benefit costs & risks, and • Growing level of understanding, within the Risk Management community, of captive MSL Transport 5%
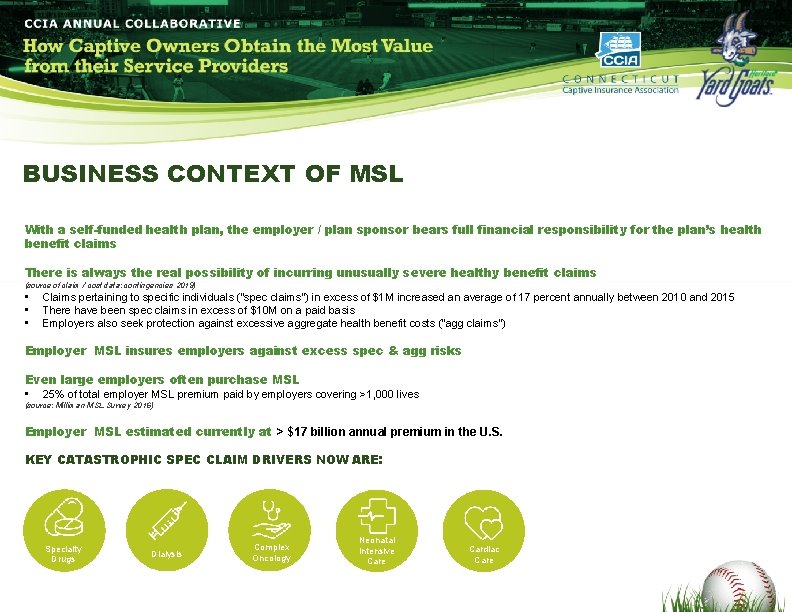
BUSINESS CONTEXT OF MSL With a self-funded health plan, the employer / plan sponsor bears full financial responsibility for the plan’s health benefit claims There is always the real possibility of incurring unusually severe healthy benefit claims (source of claim / cost data: contingencies 2019) • • • Claims pertaining to specific individuals (“spec claims”) in excess of $1 M increased an average of 17 percent annually between 2010 and 2015 There have been spec claims in excess of $10 M on a paid basis Employers also seek protection against excessive aggregate health benefit costs (“agg claims”) Employer MSL insures employers against excess spec & agg risks Even large employers often purchase MSL • 25% of total employer MSL premium paid by employers covering >1, 000 lives (source: Milliman MSL Survey 2016) Employer MSL estimated currently at > $17 billion annual premium in the U. S. KEY CATASTROPHIC SPEC CLAIM DRIVERS NOW ARE: Specialty Drugs Dialysis Complex Oncology Neonatal Intensive Cardiac Care
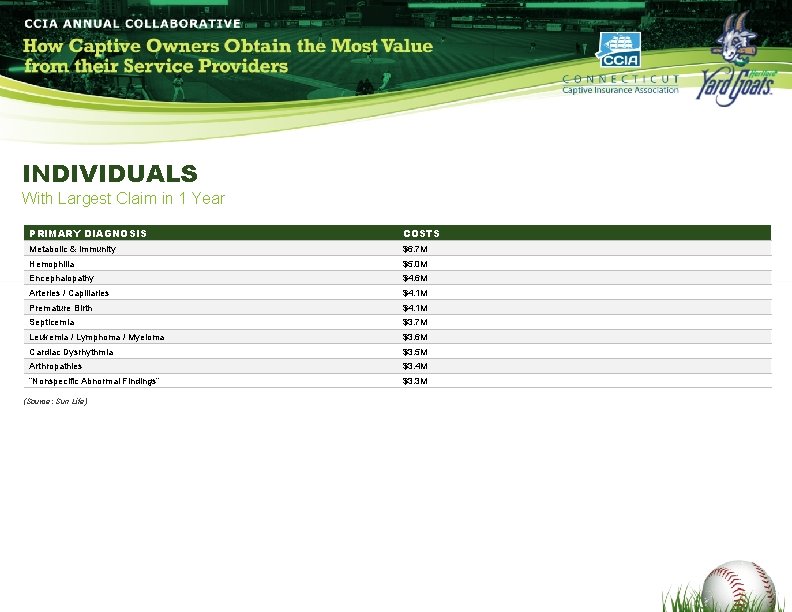
INDIVIDUALS With Largest Claim in 1 Year PRIMARY DIAGNOSIS COSTS Metabolic & Immunity $6. 7 M Hemophilia $5. 0 M Encephalopathy $4. 6 M Arteries / Capillaries $4. 1 M Premature Birth $4. 1 M Septicemia $3. 7 M Leukemia / Lymphoma / Myeloma $3. 6 M Cardiac Dysrhythmia $3. 5 M Arthropathies $3. 4 M “Nonspecific Abnormal Findings” $3. 3 M (Source: Sun Life)
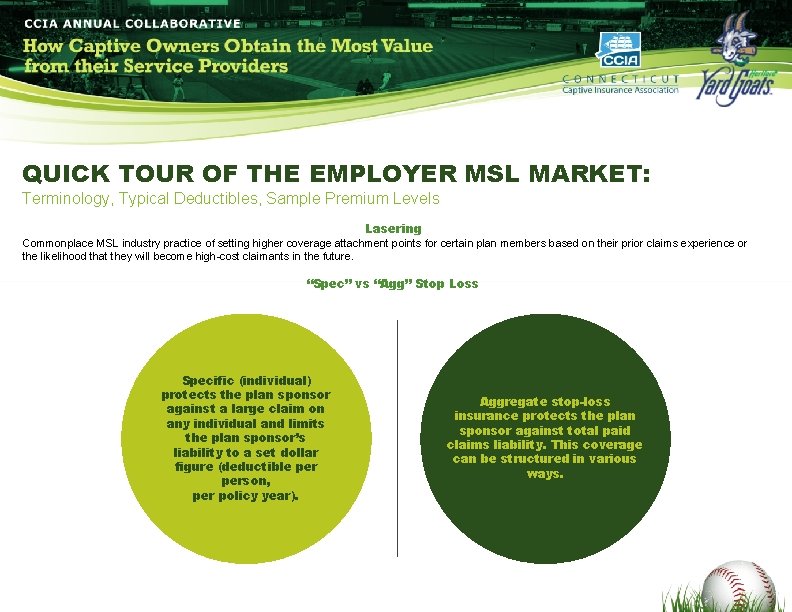
QUICK TOUR OF THE EMPLOYER MSL MARKET: Terminology, Typical Deductibles, Sample Premium Levels Lasering Commonplace MSL industry practice of setting higher coverage attachment points for certain plan members based on their prior claims experience or the likelihood that they will become high-cost claimants in the future. “Spec” vs “Agg” Stop Loss Specific (individual) protects the plan sponsor against a large claim on any individual and limits the plan sponsor’s liability to a set dollar figure (deductible person, per policy year). Aggregate stop-loss insurance protects the plan sponsor against total paid claims liability. This coverage can be structured in various ways.
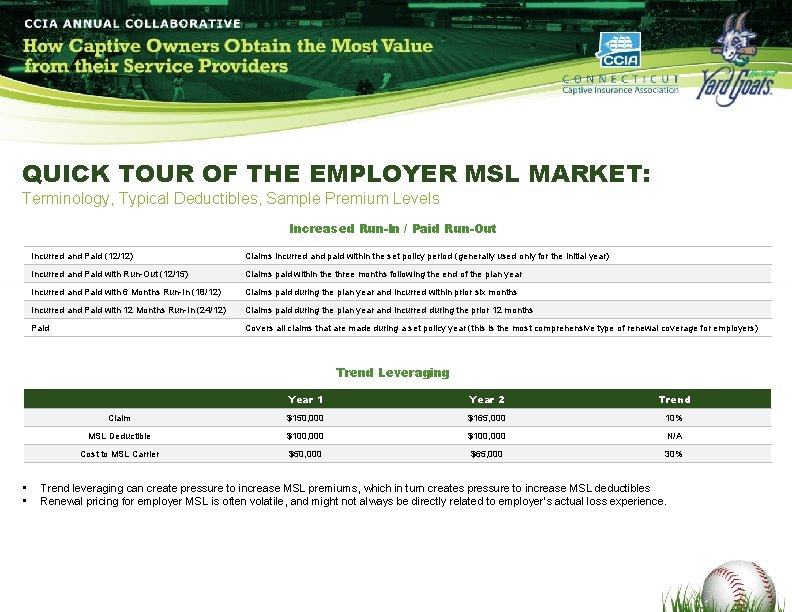
QUICK TOUR OF THE EMPLOYER MSL MARKET: Terminology, Typical Deductibles, Sample Premium Levels Increased Run-In / Paid Run-Out Incurred and Paid (12/12) Claims incurred and paid within the set policy period (generally used only for the initial year) Incurred and Paid with Run-Out (12/15) Claims paid within the three months following the end of the plan year Incurred and Paid with 6 Months Run-In (18/12) Claims paid during the plan year and incurred within prior six months Incurred and Paid with 12 Months Run-In (24/12) Claims paid during the plan year and incurred during the prior 12 months Paid Covers all claims that are made during a set policy year (this is the most comprehensive type of renewal coverage for employers) Trend Leveraging • • Year 1 Year 2 Trend Claim $150, 000 $165, 000 10% MSL Deductible $100, 000 N/A Cost to MSL Carrier $50, 000 $65, 000 30% Trend leveraging can create pressure to increase MSL premiums, which in turn creates pressure to increase MSL deductibles Renewal pricing for employer MSL is often volatile, and might not always be directly related to employer’s actual loss experience.
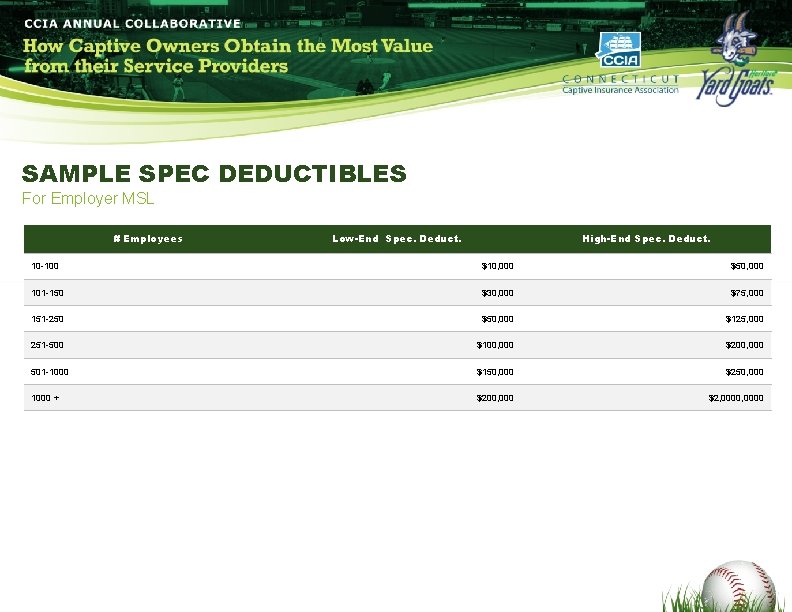
SAMPLE SPEC DEDUCTIBLES For Employer MSL # Employees Low-End Spec. Deduct. High-End Spec. Deduct. 10 -100 $10, 000 $50, 000 101 -150 $30, 000 $75, 000 151 -250 $50, 000 $125, 000 251 -500 $100, 000 $200, 000 501 -1000 $150, 000 $250, 000 1000 + $200, 000 $2, 0000
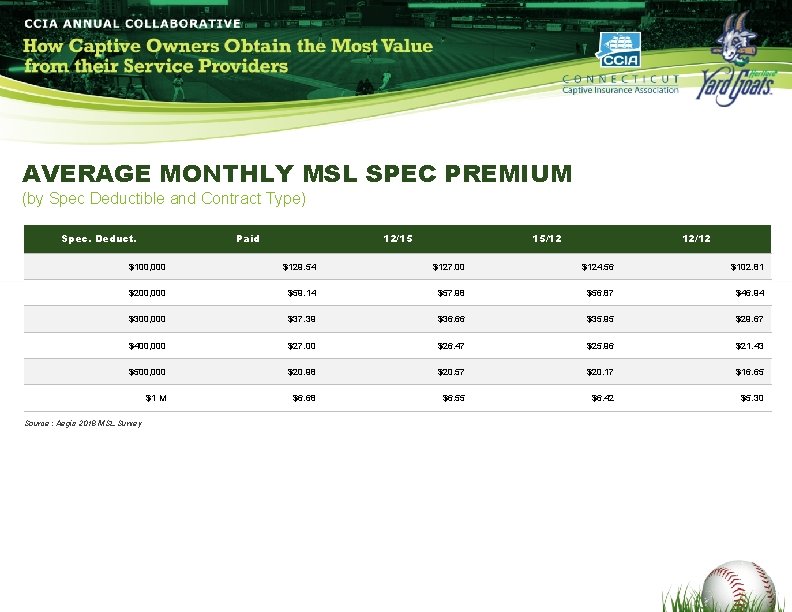
AVERAGE MONTHLY MSL SPEC PREMIUM (by Spec Deductible and Contract Type) Spec. Deduct. Paid 12/15 15/12 12/12 $100, 000 $129. 54 $127. 00 $124. 56 $102. 81 $200, 000 $59. 14 $57. 98 $56. 87 $46. 94 $300, 000 $37. 39 $36. 66 $35. 95 $29. 67 $400, 000 $27. 00 $26. 47 $25. 96 $21. 43 $500, 000 $20. 98 $20. 57 $20. 17 $16. 65 $1 M $6. 68 $6. 55 $6. 42 $5. 30 Source : Aegis 2018 MSL Survey
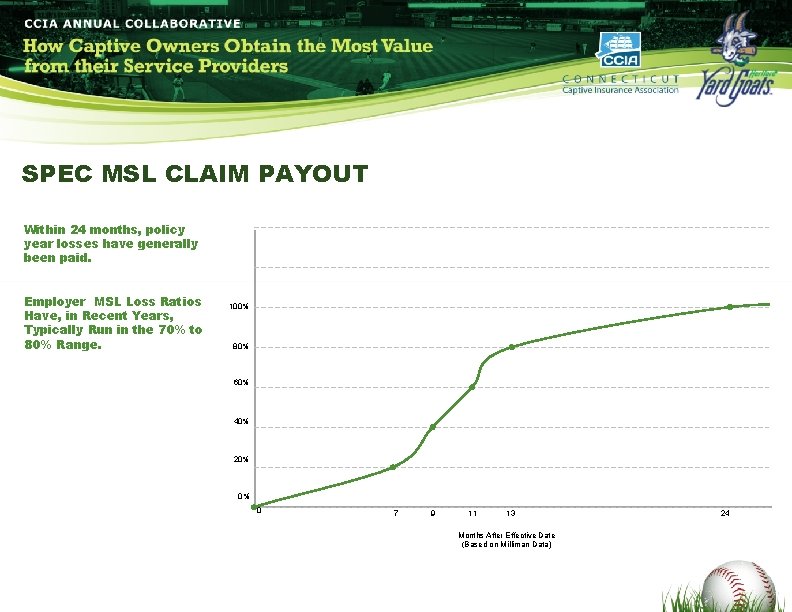
SPEC MSL CLAIM PAYOUT Within 24 months, policy year losses have generally been paid. Employer MSL Loss Ratios Have, in Recent Years, Typically Run in the 70% to 80% Range. 100% 80% 60% 40% 20% 0% 0 7 9 11 13 Months After Effective Date (Based on Milliman Data) 24
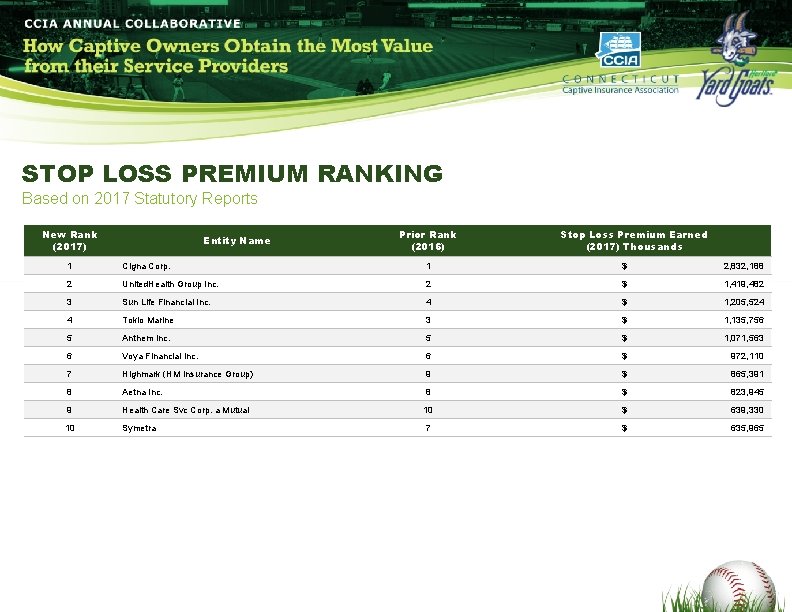
STOP LOSS PREMIUM RANKING Based on 2017 Statutory Reports New Rank (2017) Entity Name Prior Rank (2016) Stop Loss Premium Earned (2017) Thousands 1 Cigna Corp. 1 $ 2, 832, 188 2 United. Health Group Inc. 2 $ 1, 419, 482 3 Sun Life Financial Inc. 4 $ 1, 205, 524 4 Tokio Marine 3 $ 1, 135, 756 5 Anthem Inc. 5 $ 1, 071, 563 6 Voya Financial Inc. 6 $ 972, 110 7 Highmark (HM Insurance Group) 9 $ 865, 391 8 Aetna Inc. 8 $ 823, 945 9 Health Care Svc Corp. a Mutual 10 $ 639, 330 10 Symetra 7 $ 635, 965
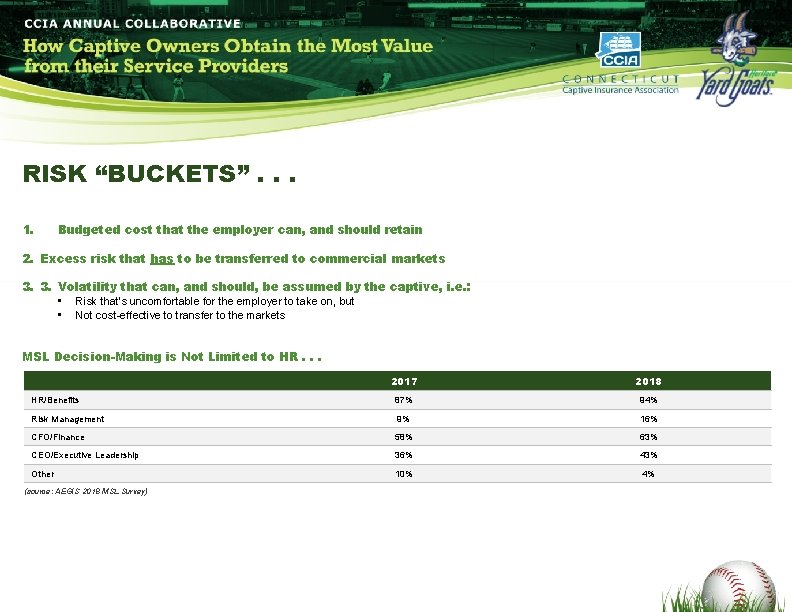
RISK “BUCKETS”. . . 1. Budgeted cost that the employer can, and should retain 2. Excess risk that has to be transferred to commercial markets 3. 3. Volatility that can, and should, be assumed by the captive, i. e. : • • Risk that’s uncomfortable for the employer to take on, but Not cost-effective to transfer to the markets MSL Decision-Making is Not Limited to HR. . . 2017 2018 HR/Benefits 87% 94% Risk Management 9% 16% CFO/Finance 58% 63% CEO/Executive Leadership 36% 43% Other 10% 4% (source: AEGIS 2018 MSL Survey)
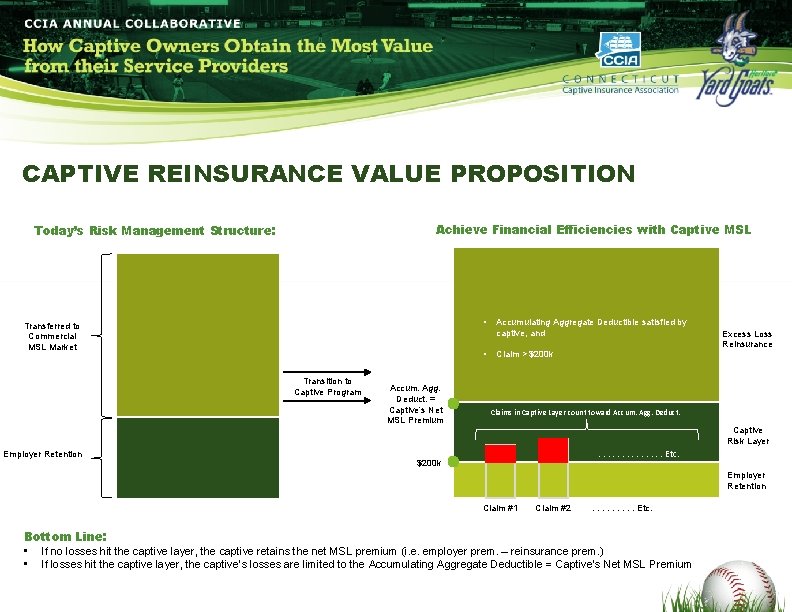
CAPTIVE REINSURANCE VALUE PROPOSITION Achieve Financial Efficiencies with Captive MSL Today’s Risk Management Structure: • Transferred to Commercial MSL Market • Transition to Captive Program Employer Retention Accum. Agg. Deduct. = Captive’s Net MSL Premium Accumulating Aggregate Deductible satisfied by captive, and Claim > $200 k Excess Loss Reinsurance Claims in Captive Layer count toward Accum. Agg. Deduct. Captive Risk Layer . . . Etc. $200 k Employer Retention Claim #1 Claim #2 . . Etc. Bottom Line: • If no losses hit the captive layer, the captive retains the net MSL premium (i. e. employer prem. – reinsurance prem. ) • If losses hit the captive layer, the captive’s losses are limited to the Accumulating Aggregate Deductible = Captive’s Net MSL Premium
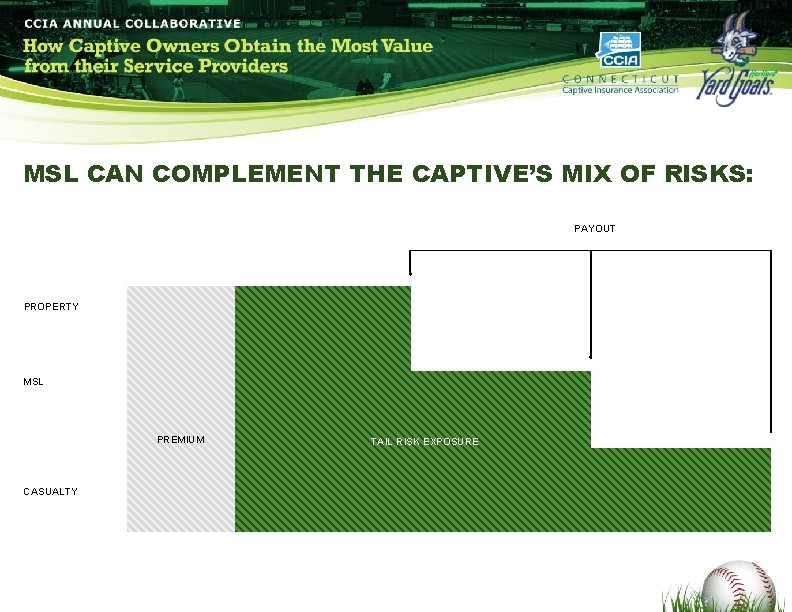
MSL CAN COMPLEMENT THE CAPTIVE’S MIX OF RISKS: PAYOUT PROPERTY MSL PREMIUM CASUALTY TAIL RISK EXPOSURE
STRUCTURING THE PROGRAM Pro-forma financials to evaluate impact of MSL on captive and its owner • Additional capital may be required to support additional risk assumed by the captive Determination of appropriate risk retention for captive & its owner • Loss experience review • Actuarial modeling MSL reinsurance market – optimize pricing for excess risk placement Incorporation of MSL into the captive’s long-term business plan
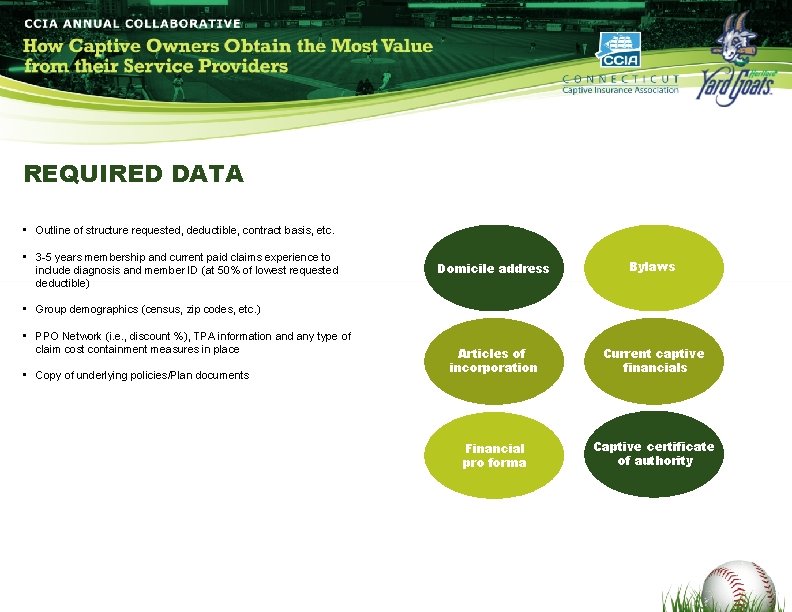
REQUIRED DATA • Outline of structure requested, deductible, contract basis, etc. • 3 -5 years membership and current paid claims experience to include diagnosis and member ID (at 50% of lowest requested deductible) Domicile address Bylaws Articles of incorporation Current captive financials Financial pro forma Captive certificate of authority • Group demographics (census, zip codes, etc. ) • PPO Network (i. e. , discount %), TPA information and any type of claim cost containment measures in place • Copy of underlying policies/Plan documents
MANAGING MSL Risks & Financial Results Like any other risk management program, a captive MSL program requires ongoing monitoring and evaluation. Changing conditions in commercial MSL markets may indicate that the risks borne by the captive should be adjusted relative to the commercial MSL markets, or the captive’s owner. Ongoing review & oversight of: DEDUCTIBLES REINSURANCE COORDINATION BETWEEN MSL AND UNDERLYING HEALTH PLAN VENDOR PERFORMANCE ACTUARIAL PROJECTION UPDATES
SUMMARY / CONCLUSION Health benefit risk is no longer just an HR issue - - it’s also an issue for Risk Management and Finance. The captive can be a useful risk financing tool for health benefit risks that are: BEYOND THE BUDGETED COSTS OF THE HEALTH PLAN SPONSOR NOT SO LARGE AS TO REQUIRE TRANSFER TO COMMERCIAL MSL MARKETS A sound business decision regarding captive MSL is based on both: EMPLOYER HEALTH CLAIM DATA PRICING DATA FROM THE COMMERCIAL MSL MARKETS
George O’Donnell Mc. Griff, Seibels & Williams 30 Old Kings Highway South Darien CT 06820 Direct: (203)202. 2096 Mobile: (203)564. 3171 godonnell@mcgriff. com MSL_CCIA_TEMPLATE. PPTX(CURRENT MSW/ODONNELL/2019) MSW information within this document is confidential & proprietary. © 2019 Mc. Griff, Seibels & Williams, Inc.