
MSIT Master of Science in Information Technology MSIT
- Slides: 82
MSIT | Master of Science in Information Technology MSIT 413: Wireless Technologies Week 3 Michael L. Honig Department of EECS Northwestern University January 2016
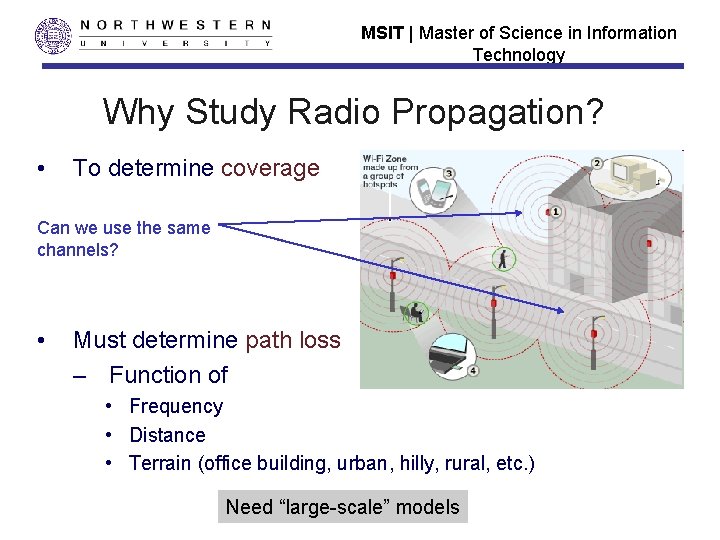
MSIT | Master of Science in Information Technology Why Study Radio Propagation? • To determine coverage Can we use the same channels? • Must determine path loss – Function of • Frequency • Distance • Terrain (office building, urban, hilly, rural, etc. ) Need “large-scale” models
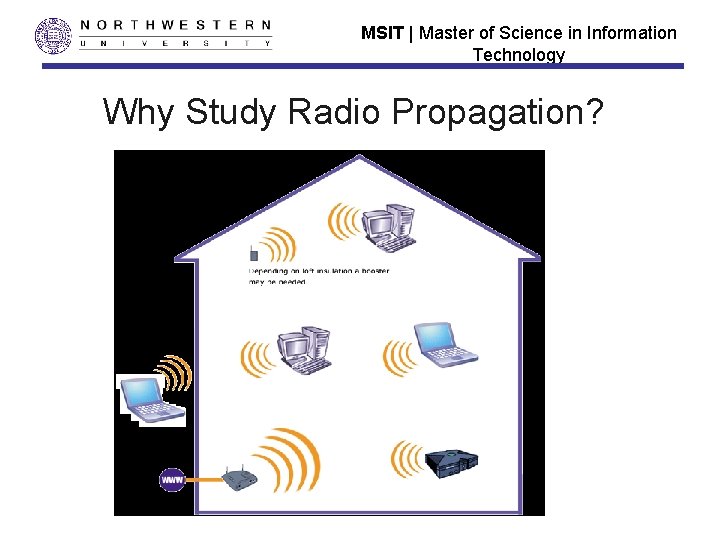
MSIT | Master of Science in Information Technology Why Study Radio Propagation?
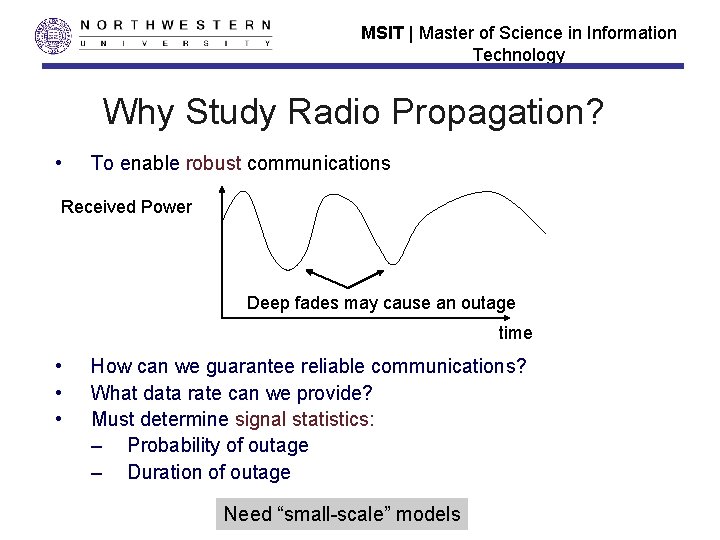
MSIT | Master of Science in Information Technology Why Study Radio Propagation? • To enable robust communications Received Power Deep fades may cause an outage time • • • How can we guarantee reliable communications? What data rate can we provide? Must determine signal statistics: – Probability of outage – Duration of outage Need “small-scale” models
MSIT | Master of Science in Information Technology Will provide answers to… • • What are the major causes of attenuation and fading? Why does the achievable data rate decrease with mobility? Why are wireless systems evolving to wider bandwidths (spread spectrum and OFDM)? Why does the accuracy of location tracking methods increase with wider bandwidths?
MSIT | Master of Science in Information Technology Propagation Key Words • Large-scale effects – Path-loss exponent – Shadow fading • Small-scale effects – Rayleigh fading – Doppler shift and Doppler spectrum – Coherence time / fast vs slow fading • Narrowband vs wideband signals • Multipath delay spread and coherence bandwidth • Frequency-selective fading and frequency diversity
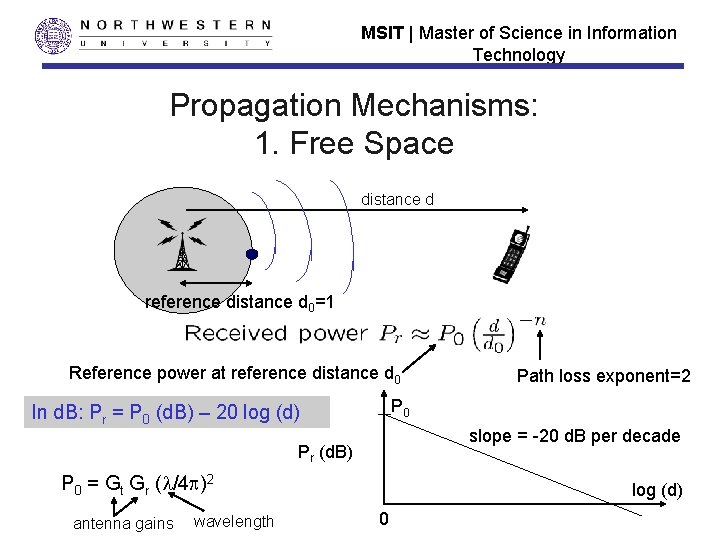
MSIT | Master of Science in Information Technology Propagation Mechanisms: 1. Free Space distance d reference distance d 0=1 Reference power at reference distance d 0 P 0 In d. B: Pr = P 0 (d. B) – 20 log (d) slope = -20 d. B per decade Pr (d. B) P 0 = Gt Gr ( /4 )2 antenna gains wavelength Path loss exponent=2 log (d) 0
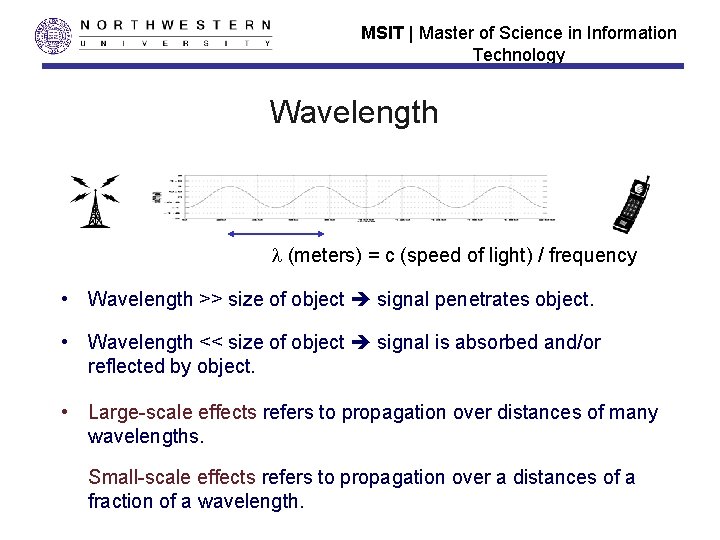
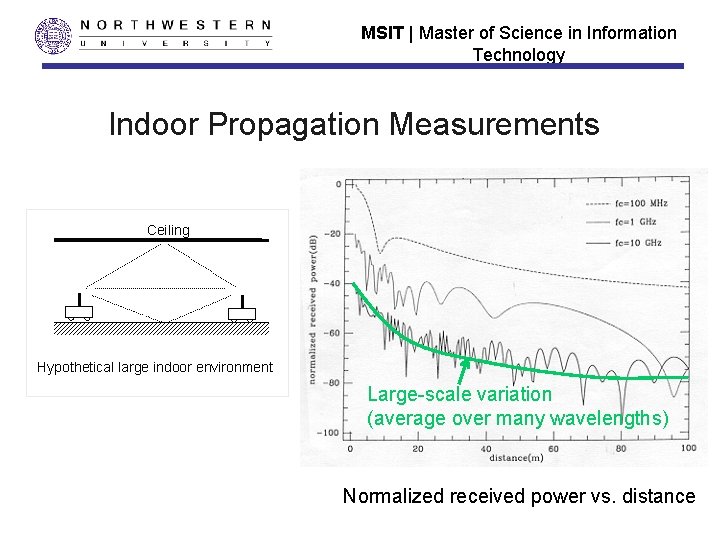
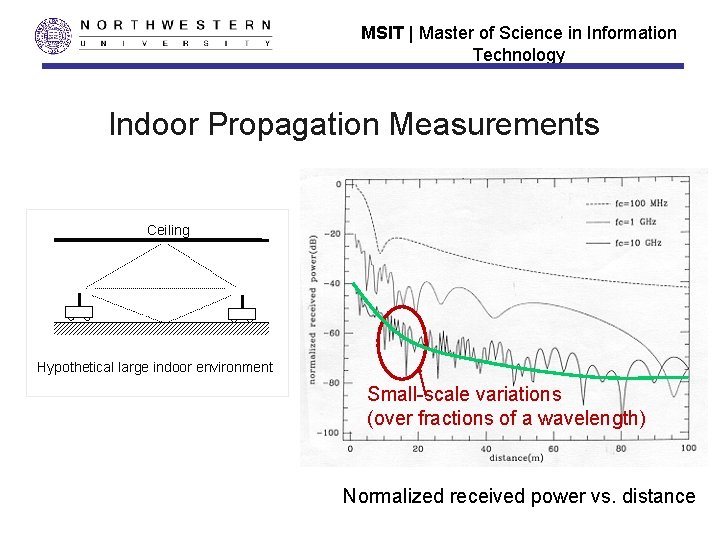
MSIT | Master of Science in Information Technology Wavelength (meters) = c (speed of light) / frequency • Wavelength >> size of object signal penetrates object. • Wavelength << size of object signal is absorbed and/or reflected by object. • Large-scale effects refers to propagation over distances of many wavelengths. Small-scale effects refers to propagation over a distances of a fraction of a wavelength.
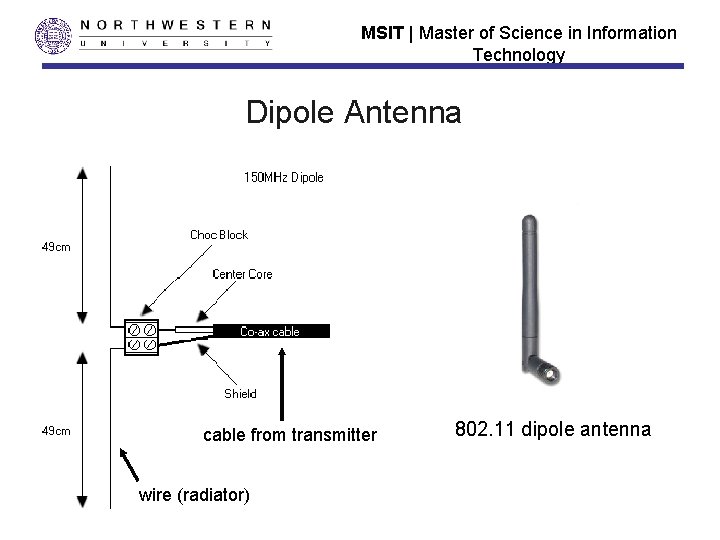
MSIT | Master of Science in Information Technology Dipole Antenna cable from transmitter wire (radiator) 802. 11 dipole antenna
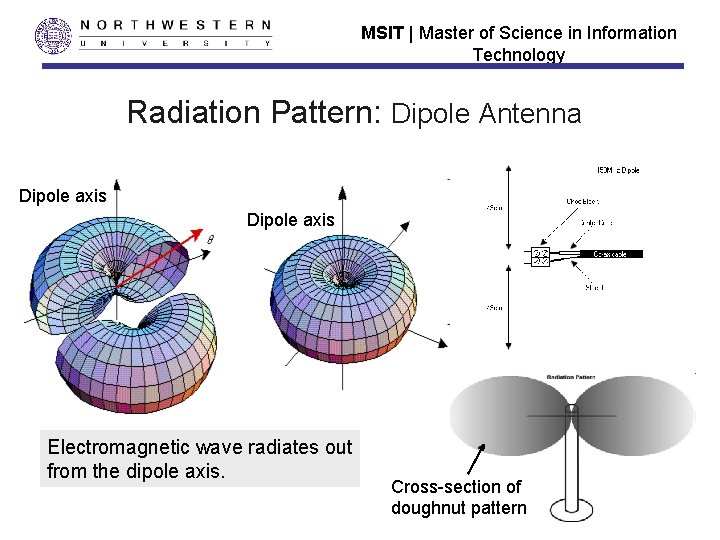
MSIT | Master of Science in Information Technology Radiation Pattern: Dipole Antenna Dipole axis Electromagnetic wave radiates out from the dipole axis. Cross-section of doughnut pattern
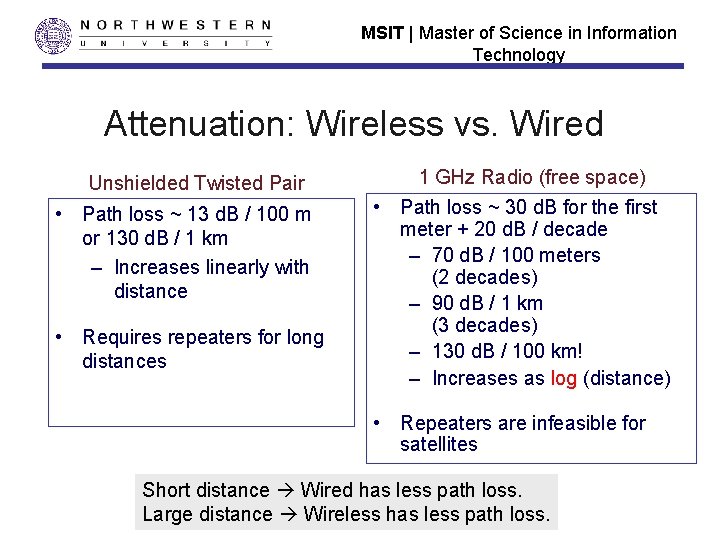
MSIT | Master of Science in Information Technology Attenuation: Wireless vs. Wired Unshielded Twisted Pair • Path loss ~ 13 d. B / 100 m or 130 d. B / 1 km – Increases linearly with distance • Requires repeaters for long distances 1 GHz Radio (free space) • Path loss ~ 30 d. B for the first meter + 20 d. B / decade – 70 d. B / 100 meters (2 decades) – 90 d. B / 1 km (3 decades) – 130 d. B / 100 km! – Increases as log (distance) • Repeaters are infeasible for satellites Short distance Wired has less path loss. Large distance Wireless has less path loss.
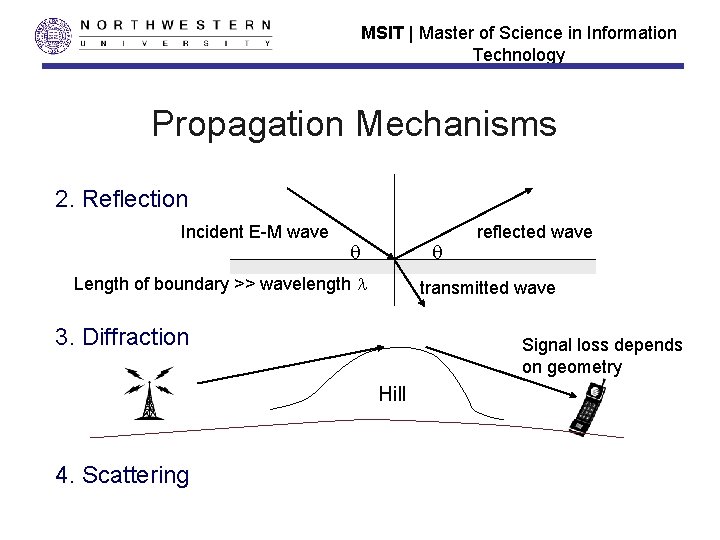
MSIT | Master of Science in Information Technology Propagation Mechanisms 2. Reflection Incident E-M wave Length of boundary >> wavelength transmitted wave 3. Diffraction Signal loss depends on geometry Hill 4. Scattering reflected wave
MSIT | Master of Science in Information Technology Why Use > 500 MHz?
MSIT | Master of Science in Information Technology Why Use > 500 MHz? • There is more spectrum available above 500 MHz. • Lower frequencies require larger antennas – Antenna dimension is on the order of a wavelength = (speed of light/frequency) = 0. 6 M @ 500 MHz • Path loss increases with frequency for the first meter – 10’s of GHz: signals are confined locally – More than 60 GHz: attenuation is too large (oxygen absorbs signal)
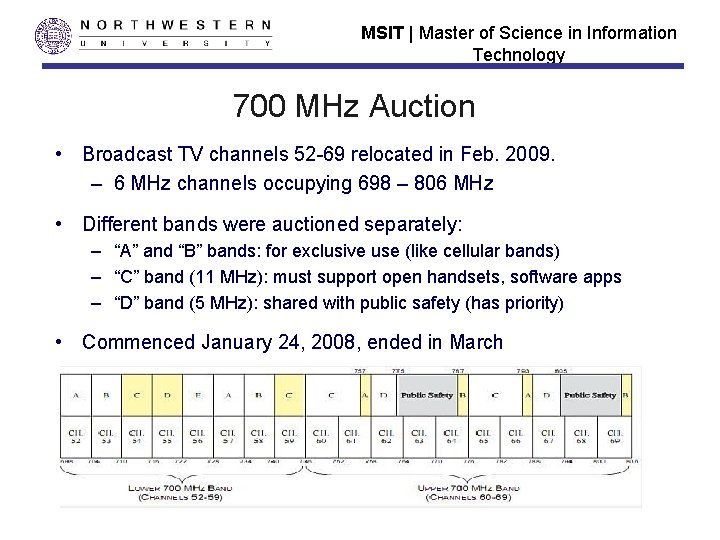
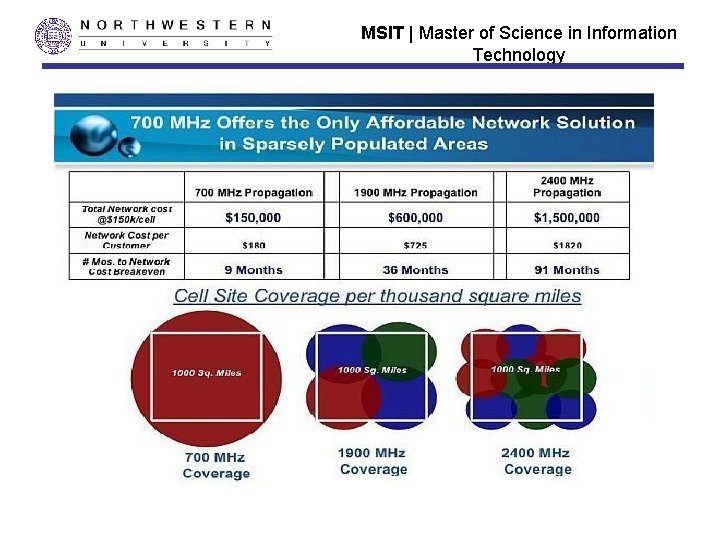
MSIT | Master of Science in Information Technology 700 MHz Auction • Broadcast TV channels 52 -69 relocated in Feb. 2009. – 6 MHz channels occupying 698 – 806 MHz • Different bands were auctioned separately: – “A” and “B” bands: for exclusive use (like cellular bands) – “C” band (11 MHz): must support open handsets, software apps – “D” band (5 MHz): shared with public safety (has priority) • Commenced January 24, 2008, ended in March
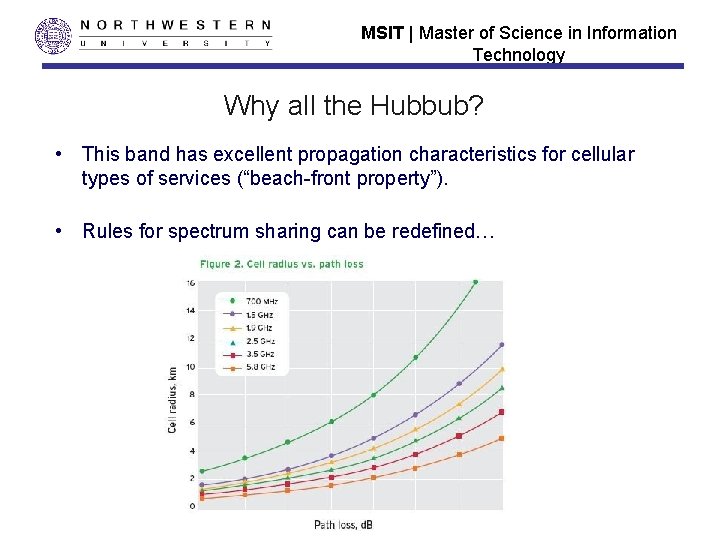
MSIT | Master of Science in Information Technology Why all the Hubbub? • This band has excellent propagation characteristics for cellular types of services (“beach-front property”). • Rules for spectrum sharing can be redefined…
MSIT | Master of Science in Information Technology
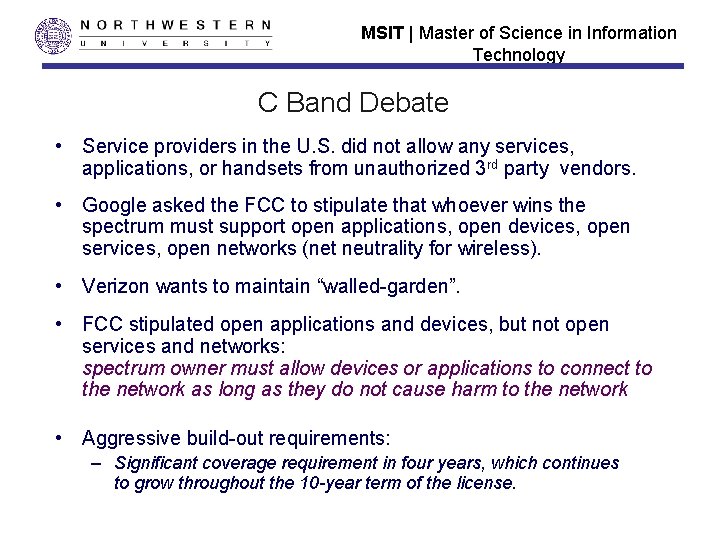
MSIT | Master of Science in Information Technology C Band Debate • Service providers in the U. S. did not allow any services, applications, or handsets from unauthorized 3 rd party vendors. • Google asked the FCC to stipulate that whoever wins the spectrum must support open applications, open devices, open services, open networks (net neutrality for wireless). • Verizon wants to maintain “walled-garden”. • FCC stipulated open applications and devices, but not open services and networks: spectrum owner must allow devices or applications to connect to the network as long as they do not cause harm to the network • Aggressive build-out requirements: – Significant coverage requirement in four years, which continues to grow throughout the 10 -year term of the license.
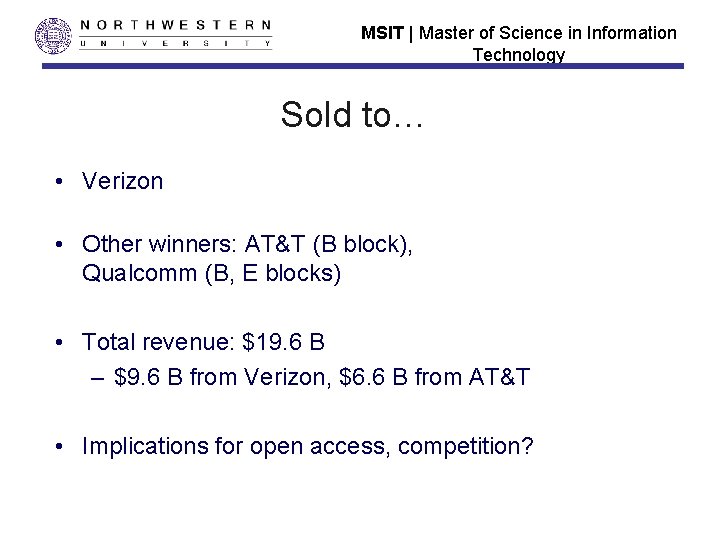
MSIT | Master of Science in Information Technology Sold to… • Verizon • Other winners: AT&T (B block), Qualcomm (B, E blocks) • Total revenue: $19. 6 B – $9. 6 B from Verizon, $6. 6 B from AT&T • Implications for open access, competition?
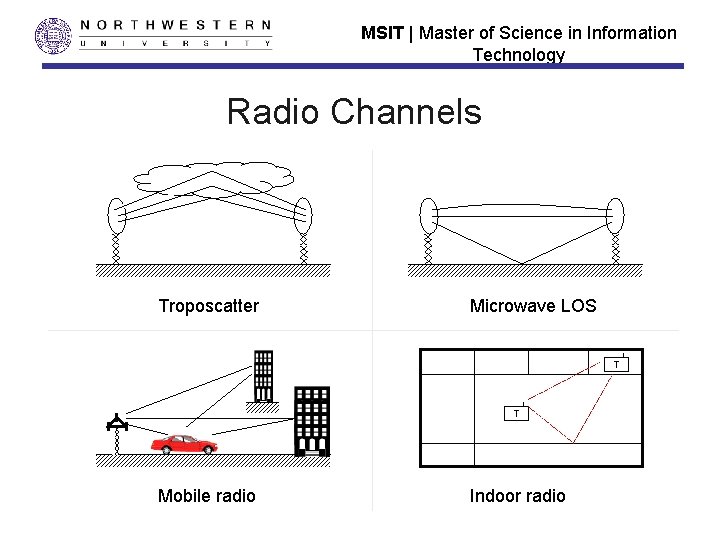
MSIT | Master of Science in Information Technology Radio Channels Troposcatter Microwave LOS T T Mobile radio Indoor radio
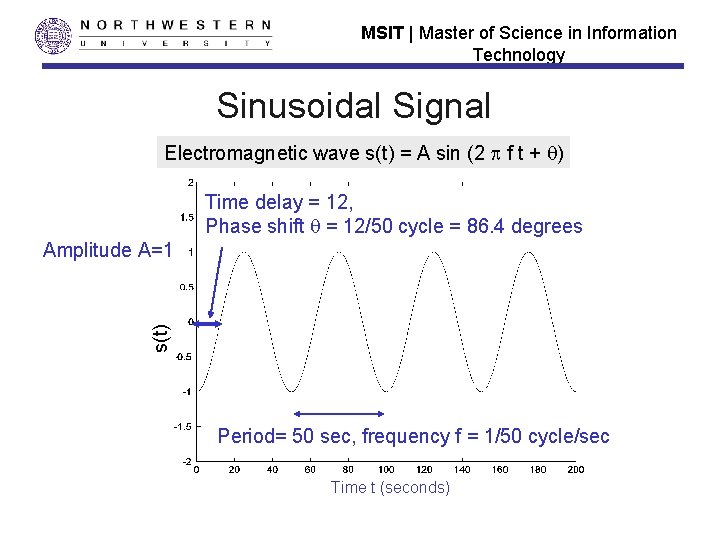
MSIT | Master of Science in Information Technology Sinusoidal Signal Electromagnetic wave s(t) = A sin (2 f t + ) Time delay = 12, Phase shift = 12/50 cycle = 86. 4 degrees s(t) Amplitude A=1 Period= 50 sec, frequency f = 1/50 cycle/sec Time t (seconds)
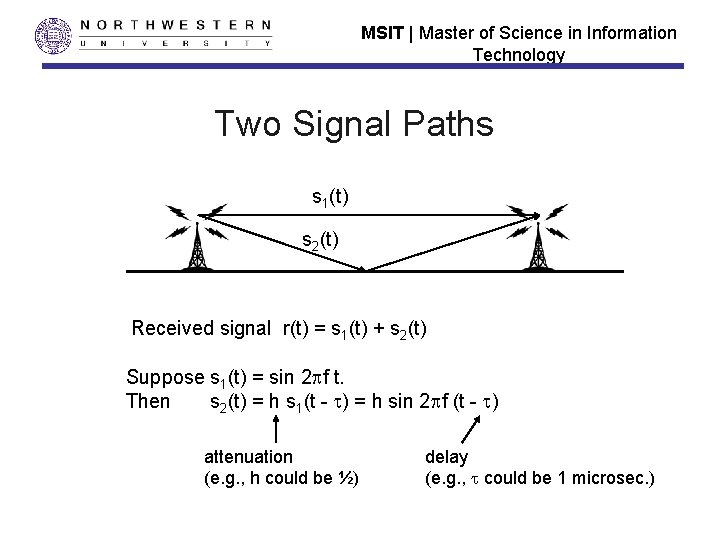
MSIT | Master of Science in Information Technology Two Signal Paths s 1(t) s 2(t) Received signal r(t) = s 1(t) + s 2(t) Suppose s 1(t) = sin 2 f t. Then s 2(t) = h s 1(t - ) = h sin 2 f (t - ) attenuation (e. g. , h could be ½) delay (e. g. , could be 1 microsec. )
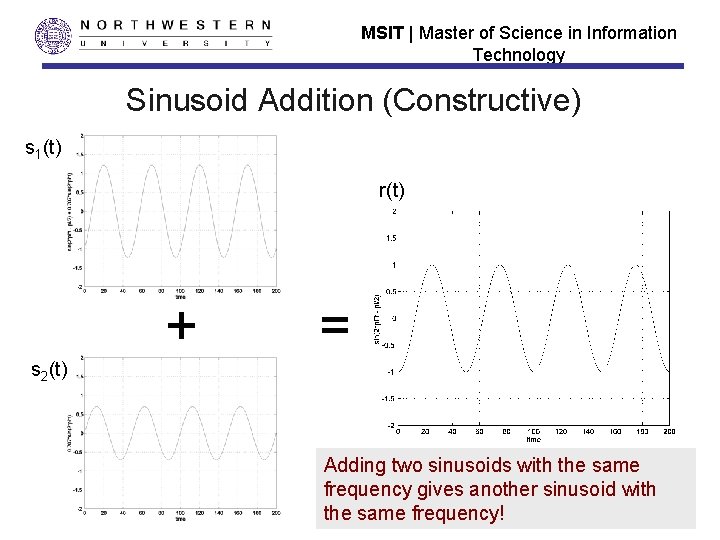
MSIT | Master of Science in Information Technology Sinusoid Addition (Constructive) s 1(t) r(t) + = s 2(t) Adding two sinusoids with the same frequency gives another sinusoid with the same frequency!
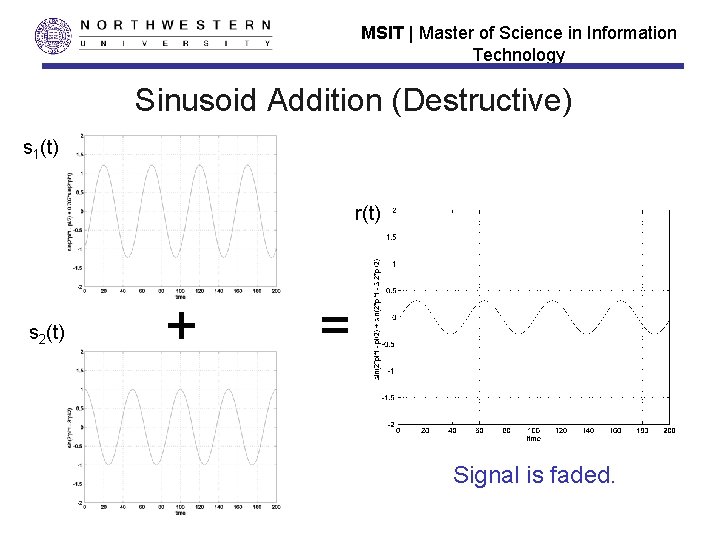
MSIT | Master of Science in Information Technology Sinusoid Addition (Destructive) s 1(t) r(t) s 2(t) + = Signal is faded.
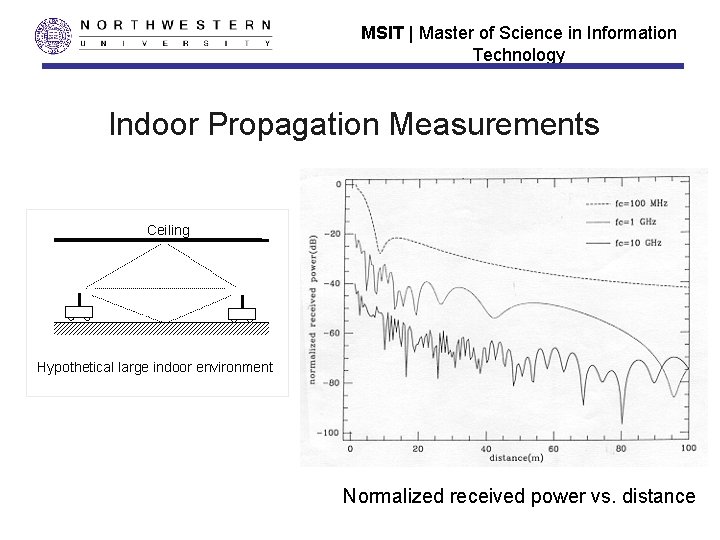
MSIT | Master of Science in Information Technology Indoor Propagation Measurements Ceiling Hypothetical large indoor environment Normalized received power vs. distance
MSIT | Master of Science in Information Technology Indoor Propagation Measurements Ceiling Hypothetical large indoor environment Large-scale variation (average over many wavelengths) Normalized received power vs. distance
MSIT | Master of Science in Information Technology Indoor Propagation Measurements Ceiling Hypothetical large indoor environment Small-scale variations (over fractions of a wavelength) Normalized received power vs. distance
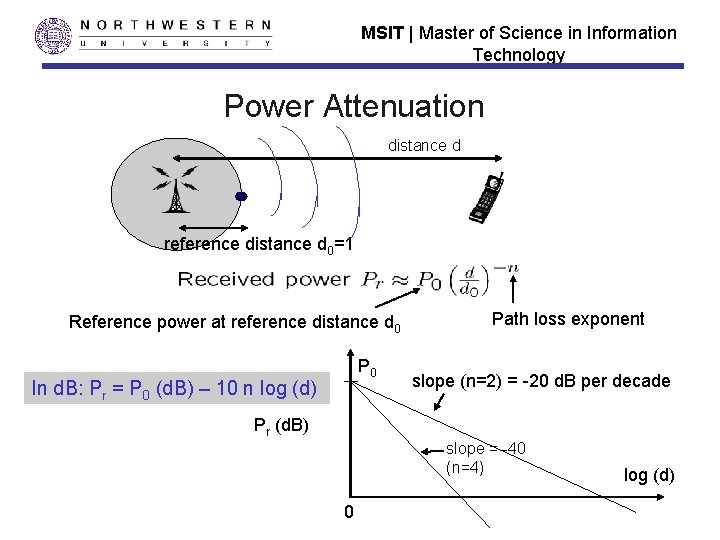
MSIT | Master of Science in Information Technology Power Attenuation distance d reference distance d 0=1 Reference power at reference distance d 0 P 0 In d. B: Pr = P 0 (d. B) – 10 n log (d) Path loss exponent slope (n=2) = -20 d. B per decade Pr (d. B) slope = -40 (n=4) 0 log (d)
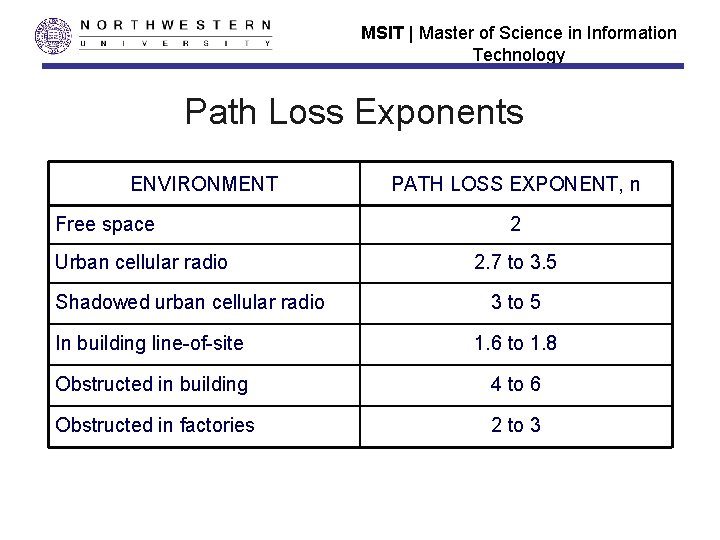
MSIT | Master of Science in Information Technology Path Loss Exponents ENVIRONMENT Free space Urban cellular radio Shadowed urban cellular radio PATH LOSS EXPONENT, n 2 2. 7 to 3. 5 3 to 5 In building line-of-site 1. 6 to 1. 8 Obstructed in building 4 to 6 Obstructed in factories 2 to 3
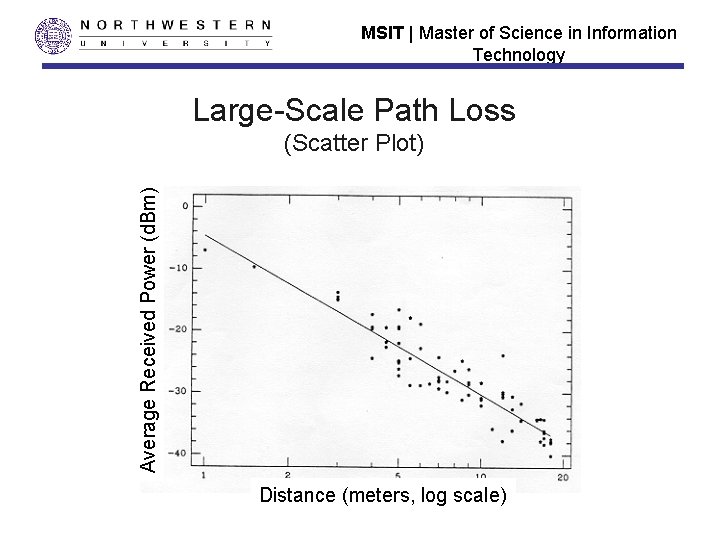
MSIT | Master of Science in Information Technology Large-Scale Path Loss Average Received Power (d. Bm) (Scatter Plot) Distance (meters, log scale)
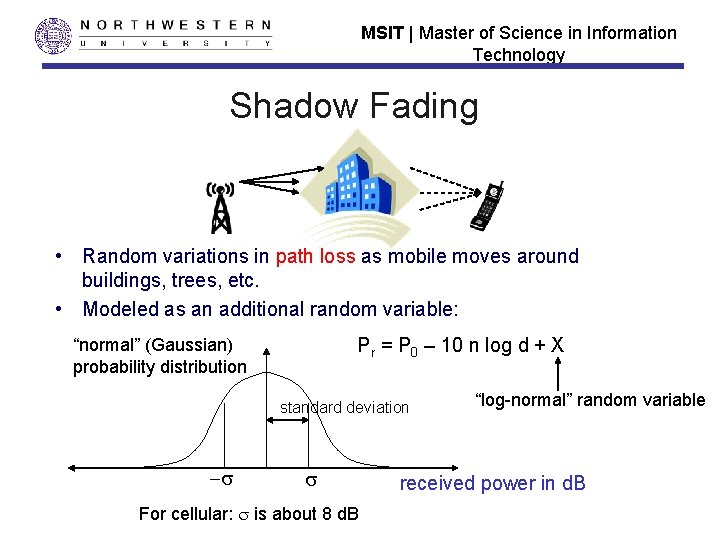
MSIT | Master of Science in Information Technology Shadow Fading • Random variations in path loss as mobile moves around buildings, trees, etc. • Modeled as an additional random variable: Pr = P 0 – 10 n log d + X “normal” (Gaussian) probability distribution standard deviation - For cellular: is about 8 d. B “log-normal” random variable received power in d. B
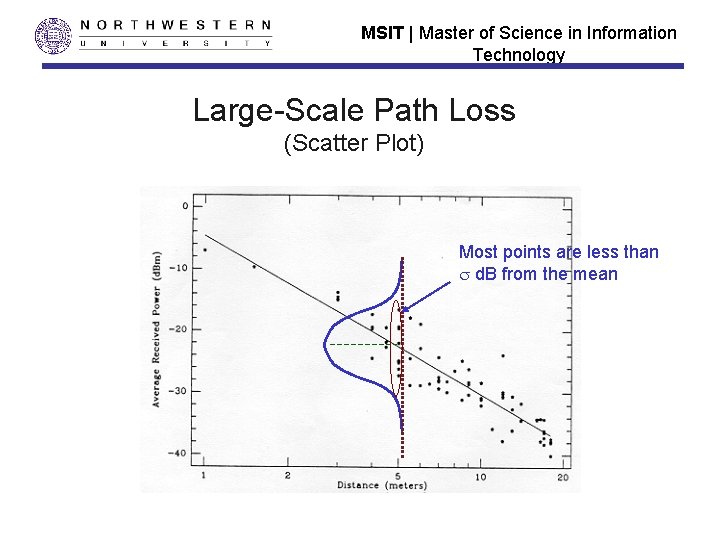
MSIT | Master of Science in Information Technology Large-Scale Path Loss (Scatter Plot) Most points are less than d. B from the mean
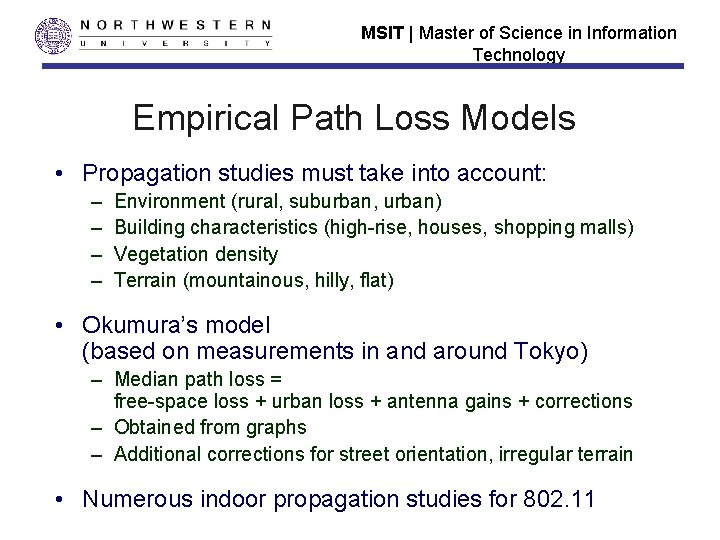
MSIT | Master of Science in Information Technology Empirical Path Loss Models • Propagation studies must take into account: – – Environment (rural, suburban, urban) Building characteristics (high-rise, houses, shopping malls) Vegetation density Terrain (mountainous, hilly, flat) • Okumura’s model (based on measurements in and around Tokyo) – Median path loss = free-space loss + urban loss + antenna gains + corrections – Obtained from graphs – Additional corrections for street orientation, irregular terrain • Numerous indoor propagation studies for 802. 11
MSIT | Master of Science in Information Technology SINR Measurements: 1 x. EV-DO drive test plots
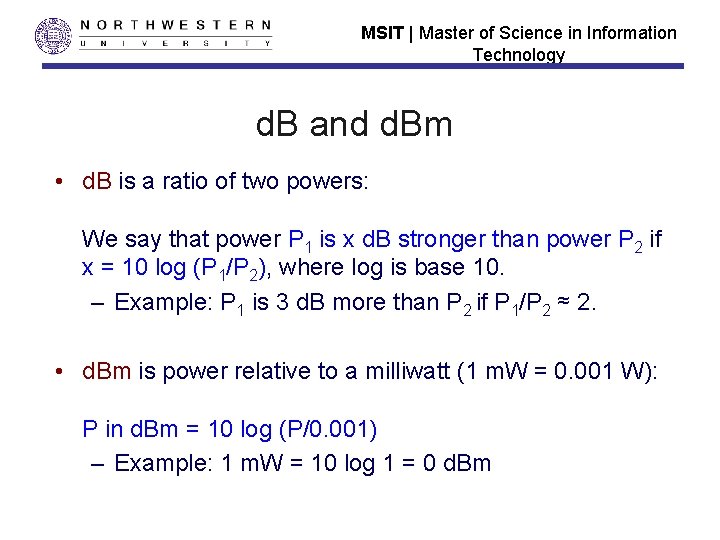
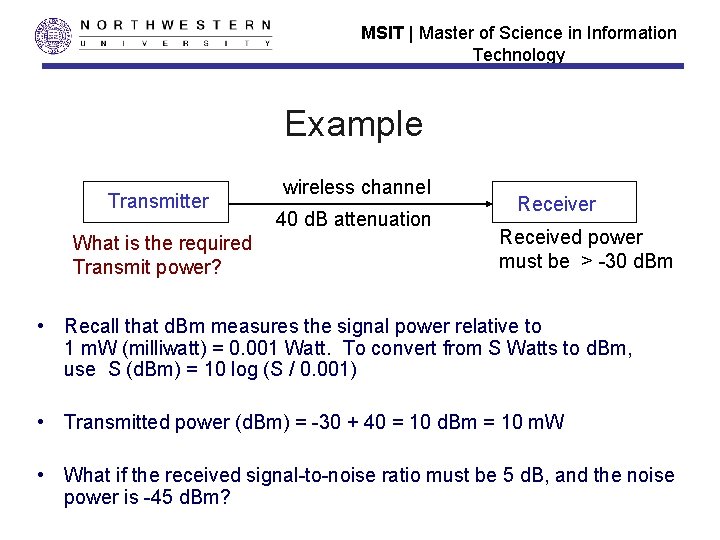
MSIT | Master of Science in Information Technology d. B and d. Bm • d. B is a ratio of two powers: We say that power P 1 is x d. B stronger than power P 2 if x = 10 log (P 1/P 2), where log is base 10. – Example: P 1 is 3 d. B more than P 2 if P 1/P 2 ≈ 2. • d. Bm is power relative to a milliwatt (1 m. W = 0. 001 W): P in d. Bm = 10 log (P/0. 001) – Example: 1 m. W = 10 log 1 = 0 d. Bm
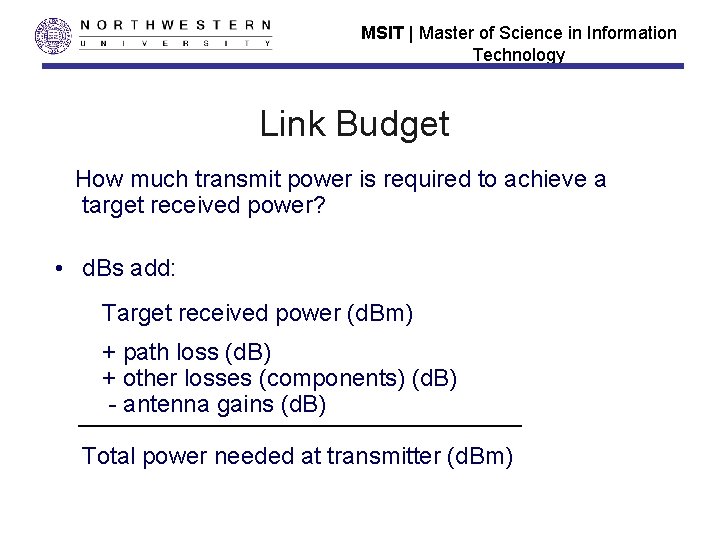
MSIT | Master of Science in Information Technology Link Budget How much transmit power is required to achieve a target received power? • d. Bs add: Target received power (d. Bm) + path loss (d. B) + other losses (components) (d. B) - antenna gains (d. B) Total power needed at transmitter (d. Bm)
MSIT | Master of Science in Information Technology Example Transmitter What is the required Transmit power? wireless channel 40 d. B attenuation Receiver Received power must be > -30 d. Bm • Recall that d. Bm measures the signal power relative to 1 m. W (milliwatt) = 0. 001 Watt. To convert from S Watts to d. Bm, use S (d. Bm) = 10 log (S / 0. 001) • Transmitted power (d. Bm) = -30 + 40 = 10 d. Bm = 10 m. W • What if the received signal-to-noise ratio must be 5 d. B, and the noise power is -45 d. Bm?
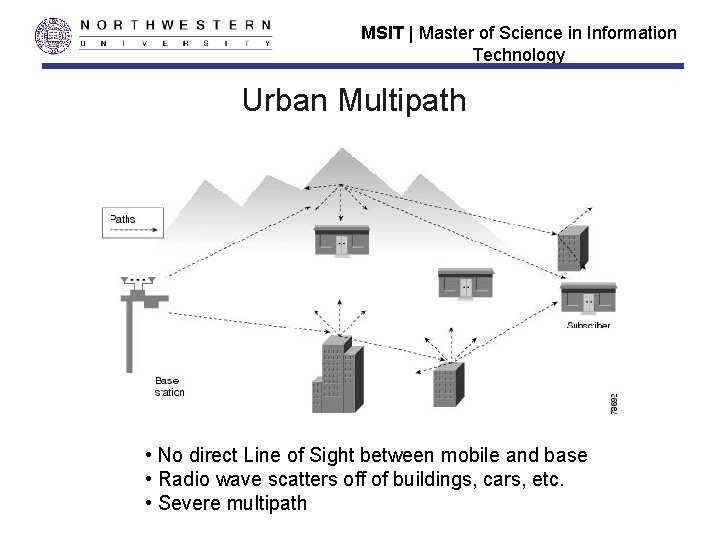
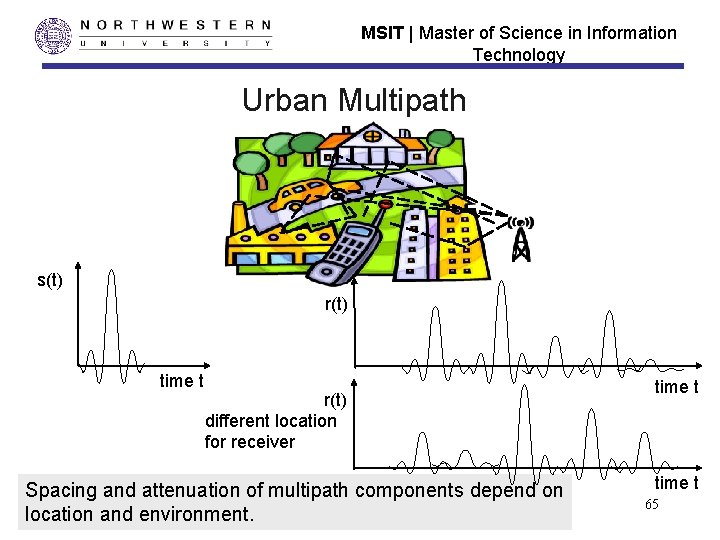
MSIT | Master of Science in Information Technology Urban Multipath • No direct Line of Sight between mobile and base • Radio wave scatters off of buildings, cars, etc. • Severe multipath
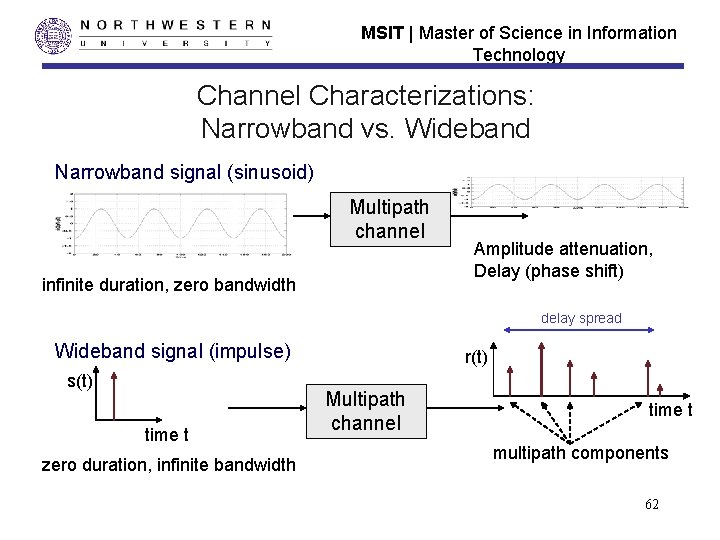
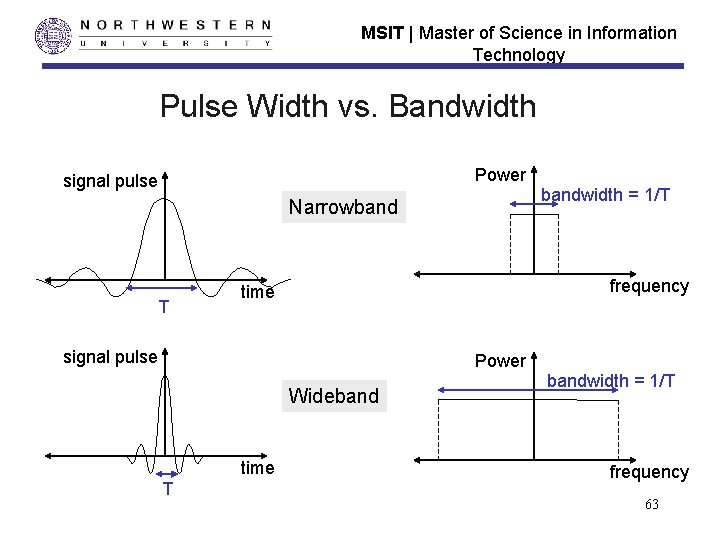
MSIT | Master of Science in Information Technology Narrowband vs. Wideband • Narrowband means that the bandwidth of the transmitted signal is small (e. g. , < 100 k. Hz for cellular). It therefore looks “almost” like a sinusoid. – Multipath changes the amplitude and phase. • Wideband means that the transmitted signal has a large bandwidth (e. g. , > 1 MHz for cellular). – Multipath causes “self-interference”.
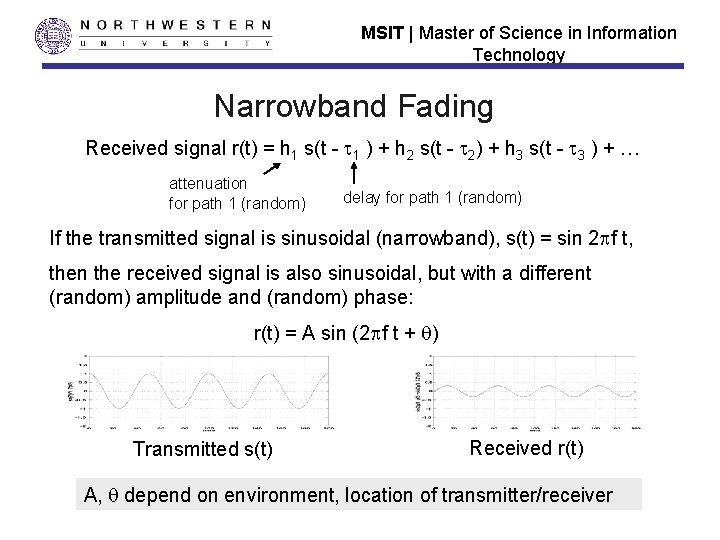
MSIT | Master of Science in Information Technology Narrowband Fading Received signal r(t) = h 1 s(t - 1 ) + h 2 s(t - 2) + h 3 s(t - 3 ) + … attenuation for path 1 (random) delay for path 1 (random) If the transmitted signal is sinusoidal (narrowband), s(t) = sin 2 f t, then the received signal is also sinusoidal, but with a different (random) amplitude and (random) phase: r(t) = A sin (2 f t + ) Transmitted s(t) Received r(t) A, depend on environment, location of transmitter/receiver
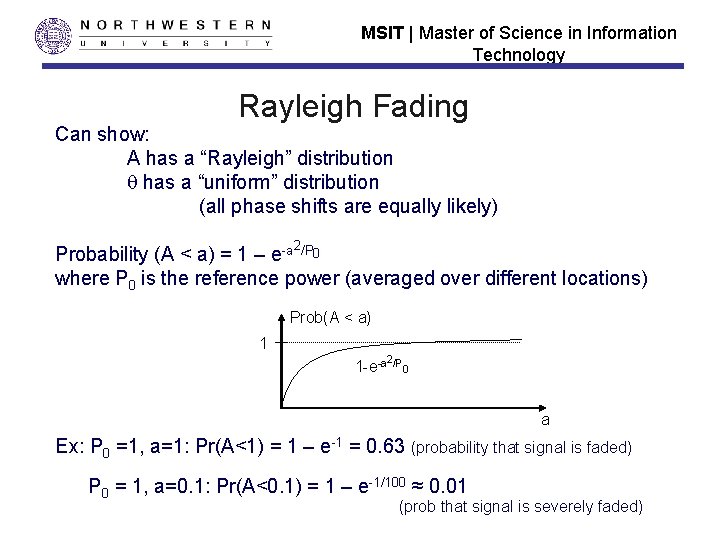
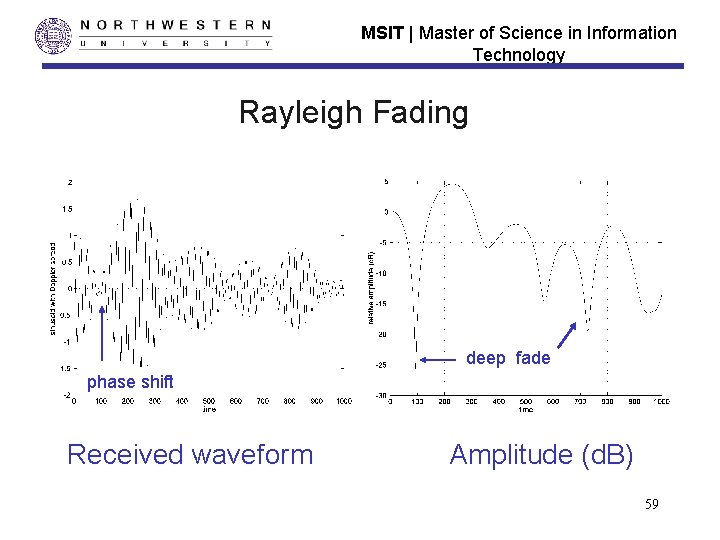
MSIT | Master of Science in Information Technology Rayleigh Fading Can show: A has a “Rayleigh” distribution has a “uniform” distribution (all phase shifts are equally likely) 2 Probability (A < a) = 1 – e-a /P 0 where P 0 is the reference power (averaged over different locations) Prob(A < a) 1 2/P 0 1 -e-a a Ex: P 0 =1, a=1: Pr(A<1) = 1 – e-1 = 0. 63 (probability that signal is faded) P 0 = 1, a=0. 1: Pr(A<0. 1) = 1 – e-1/100 ≈ 0. 01 (prob that signal is severely faded)
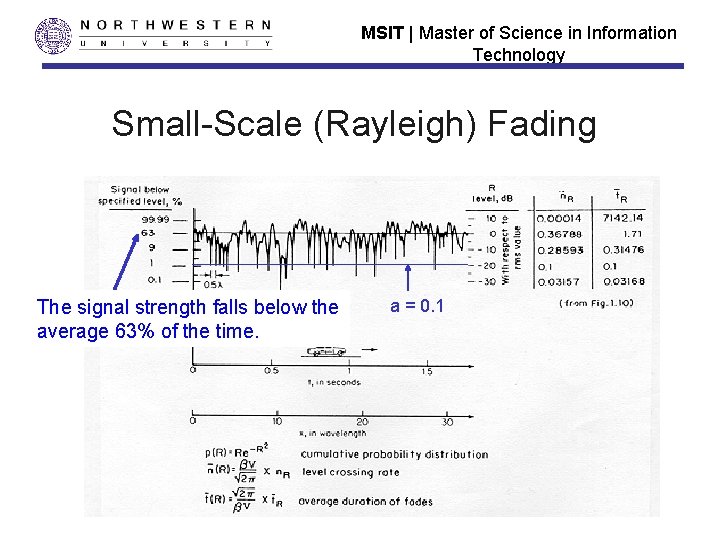
MSIT | Master of Science in Information Technology Small-Scale (Rayleigh) Fading The signal strength falls below the average 63% of the time. a = 0. 1
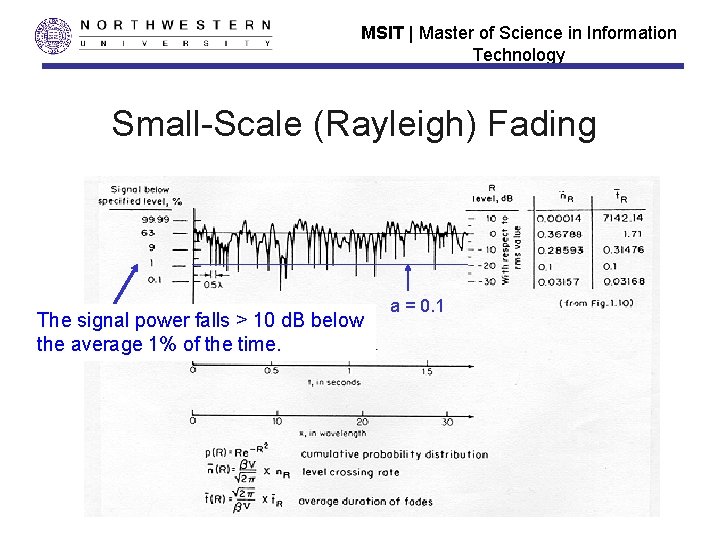
MSIT | Master of Science in Information Technology Small-Scale (Rayleigh) Fading The signal power falls > 10 d. B below the average 1% of the time. a = 0. 1
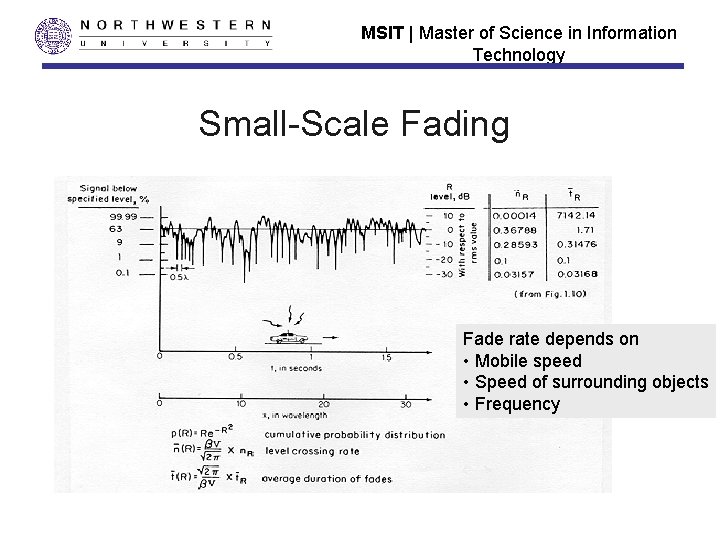
MSIT | Master of Science in Information Technology Small-Scale Fading Fade rate depends on • Mobile speed • Speed of surrounding objects • Frequency
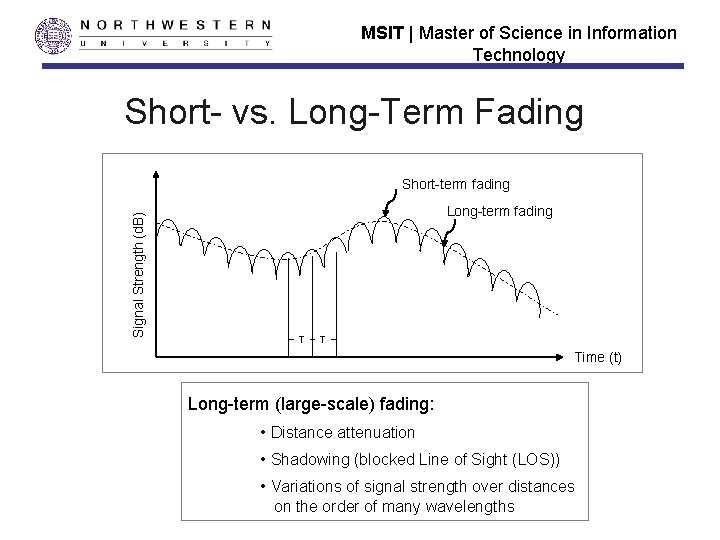
MSIT | Master of Science in Information Technology Short- vs. Long-Term Fading Signal Strength (d. B) Short-term fading Long-term fading T T Time (t) Long-term (large-scale) fading: • Distance attenuation • Shadowing (blocked Line of Sight (LOS)) • Variations of signal strength over distances on the order of many wavelengths
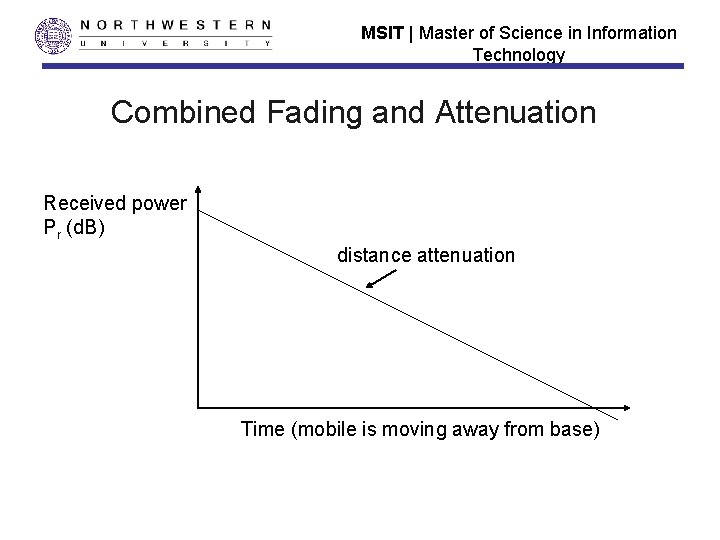
MSIT | Master of Science in Information Technology Combined Fading and Attenuation Received power Pr (d. B) distance attenuation Time (mobile is moving away from base)
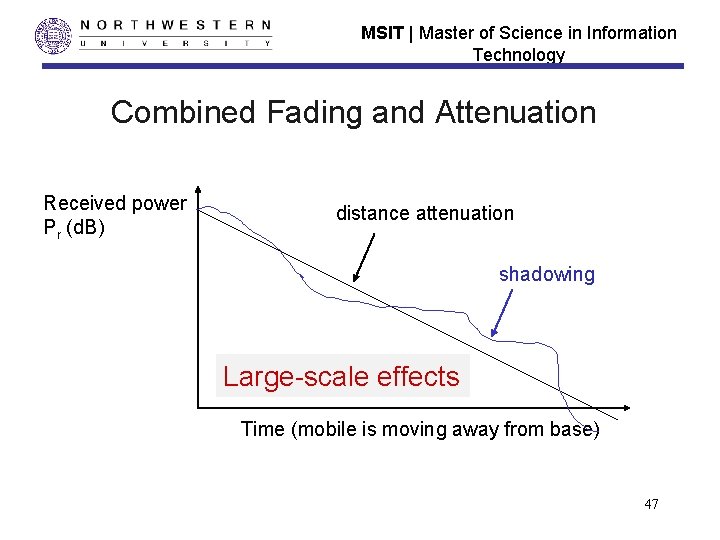
MSIT | Master of Science in Information Technology Combined Fading and Attenuation Received power Pr (d. B) distance attenuation shadowing Large-scale effects Time (mobile is moving away from base) 47
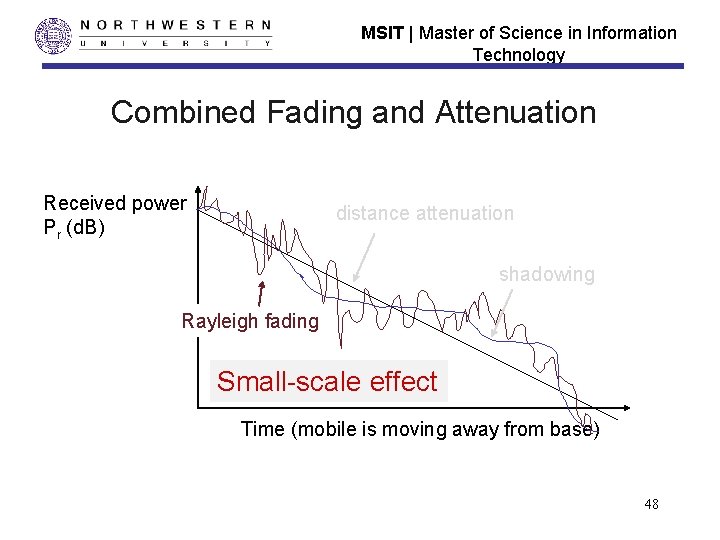
MSIT | Master of Science in Information Technology Combined Fading and Attenuation Received power Pr (d. B) distance attenuation shadowing Rayleigh fading Small-scale effect Time (mobile is moving away from base) 48
MSIT | Master of Science in Information Technology Example Diagnostic Measurements: 1 XEV-DO drive test measurements drive path
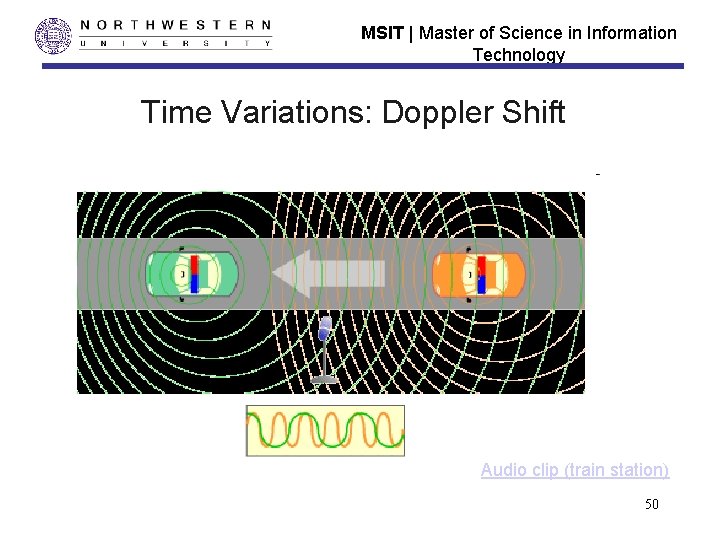
MSIT | Master of Science in Information Technology Time Variations: Doppler Shift Audio clip (train station) 50
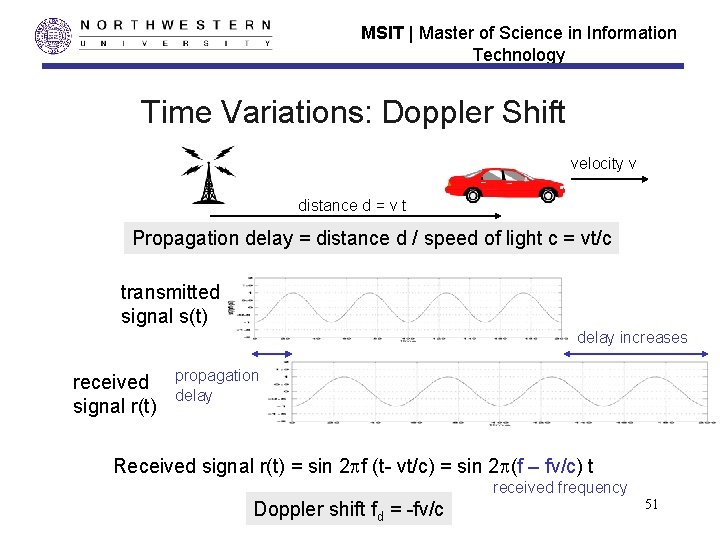
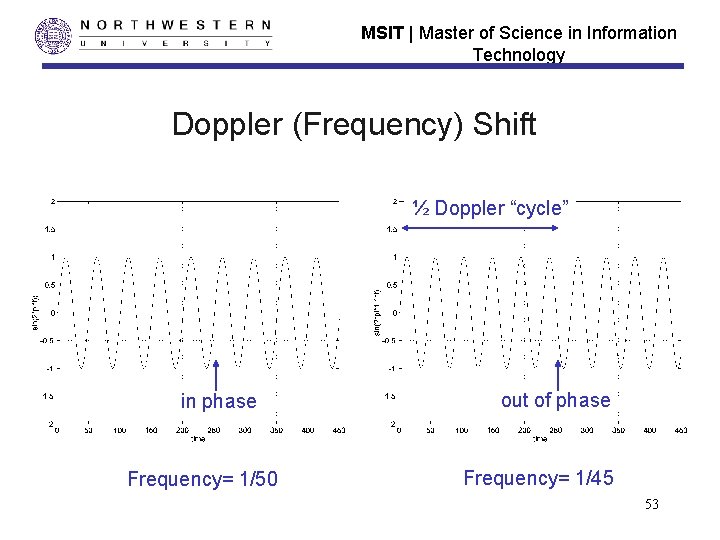
MSIT | Master of Science in Information Technology Time Variations: Doppler Shift velocity v distance d = v t Propagation delay = distance d / speed of light c = vt/c transmitted signal s(t) delay increases received signal r(t) propagation delay Received signal r(t) = sin 2 f (t- vt/c) = sin 2 (f – fv/c) t received frequency Doppler shift fd = -fv/c 51
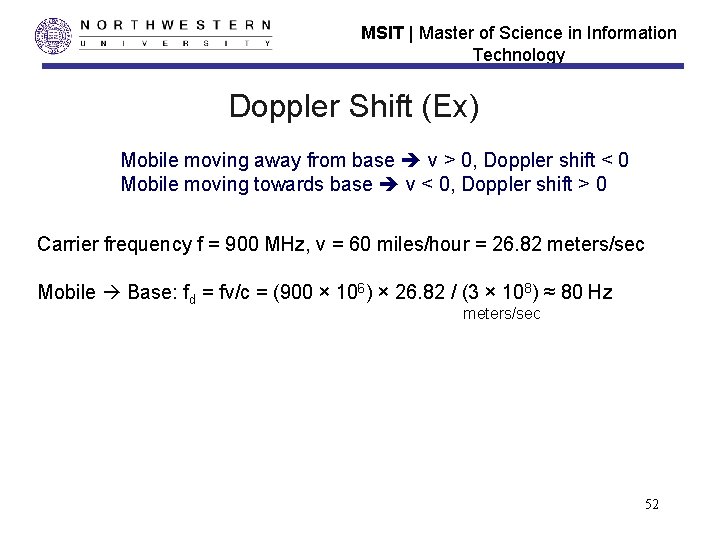
MSIT | Master of Science in Information Technology Doppler Shift (Ex) Mobile moving away from base v > 0, Doppler shift < 0 Mobile moving towards base v < 0, Doppler shift > 0 Carrier frequency f = 900 MHz, v = 60 miles/hour = 26. 82 meters/sec Mobile Base: fd = fv/c = (900 × 106) × 26. 82 / (3 × 10⁸) ≈ 80 Hz meters/sec 52
MSIT | Master of Science in Information Technology Doppler (Frequency) Shift ½ Doppler “cycle” in phase Frequency= 1/50 out of phase Frequency= 1/45 53
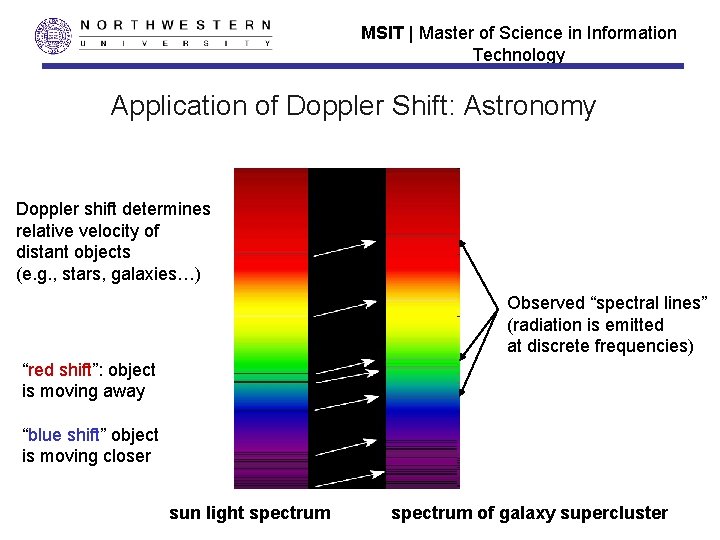
MSIT | Master of Science in Information Technology Application of Doppler Shift: Astronomy Doppler shift determines relative velocity of distant objects (e. g. , stars, galaxies…) Observed “spectral lines” (radiation is emitted at discrete frequencies) “red shift”: object is moving away “blue shift” object is moving closer sun light spectrum of galaxy supercluster
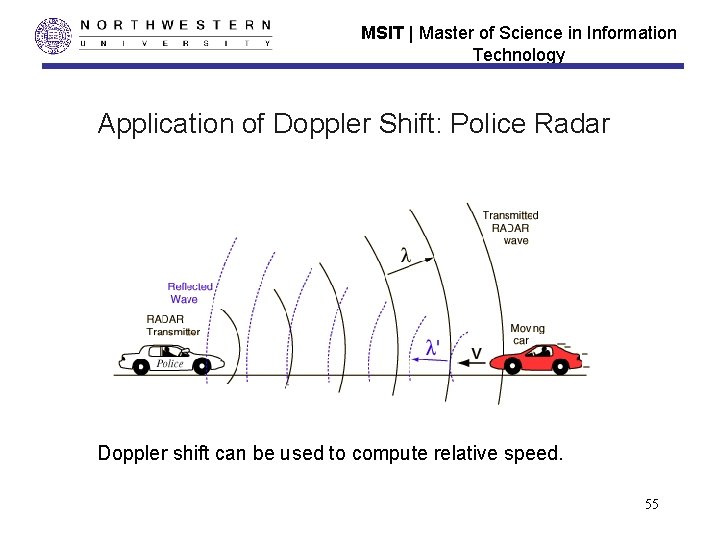
MSIT | Master of Science in Information Technology Application of Doppler Shift: Police Radar Doppler shift can be used to compute relative speed. 55
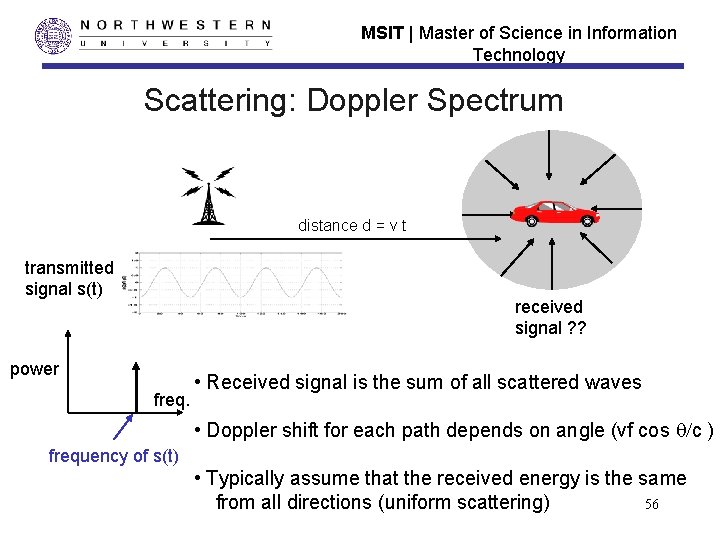
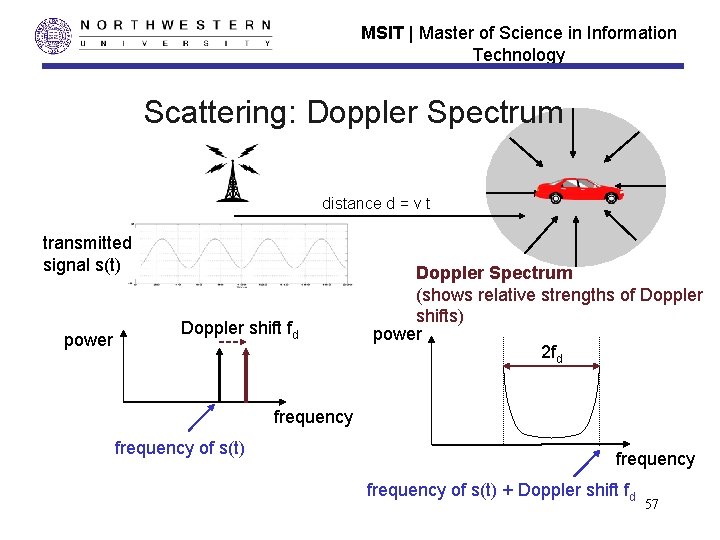
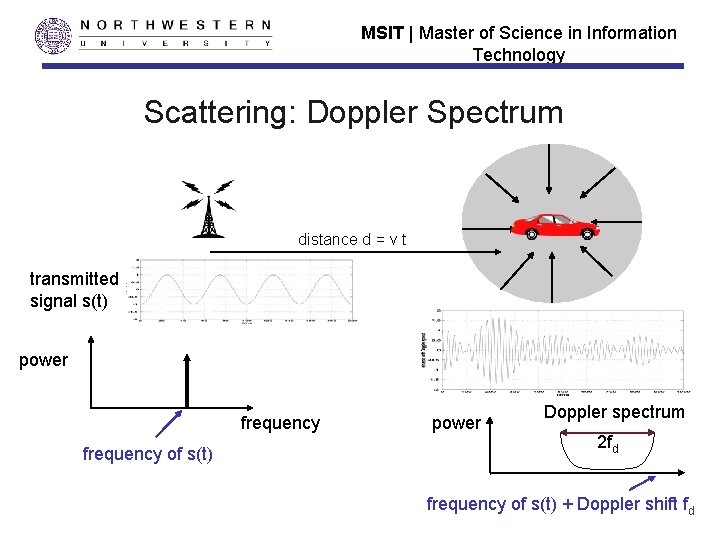
MSIT | Master of Science in Information Technology Scattering: Doppler Spectrum distance d = v t transmitted signal s(t) received signal ? ? power freq. • Received signal is the sum of all scattered waves • Doppler shift for each path depends on angle (vf cos /c ) frequency of s(t) • Typically assume that the received energy is the same from all directions (uniform scattering) 56
MSIT | Master of Science in Information Technology Scattering: Doppler Spectrum distance d = v t transmitted signal s(t) power Doppler shift fd Doppler Spectrum (shows relative strengths of Doppler shifts) power 2 fd frequency of s(t) + Doppler shift fd 57
MSIT | Master of Science in Information Technology Scattering: Doppler Spectrum distance d = v t transmitted signal s(t) power frequency of s(t) power Doppler spectrum 2 fd frequency of s(t) + Doppler shift fd
MSIT | Master of Science in Information Technology Rayleigh Fading deep fade phase shift Received waveform Amplitude (d. B) 59
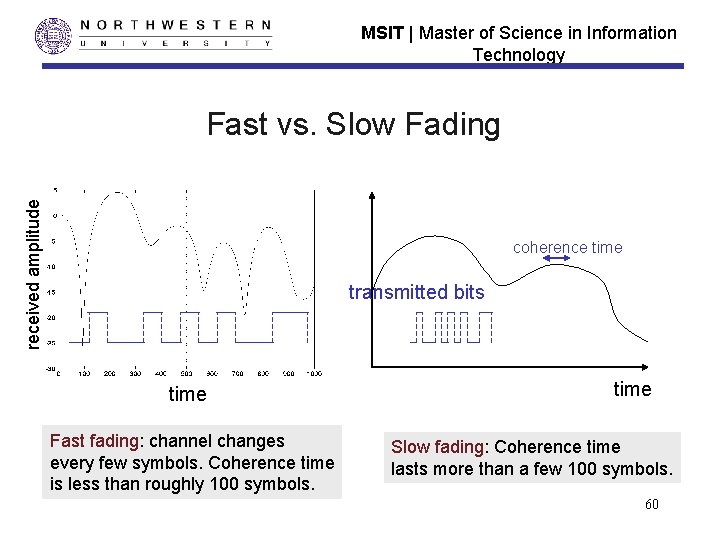
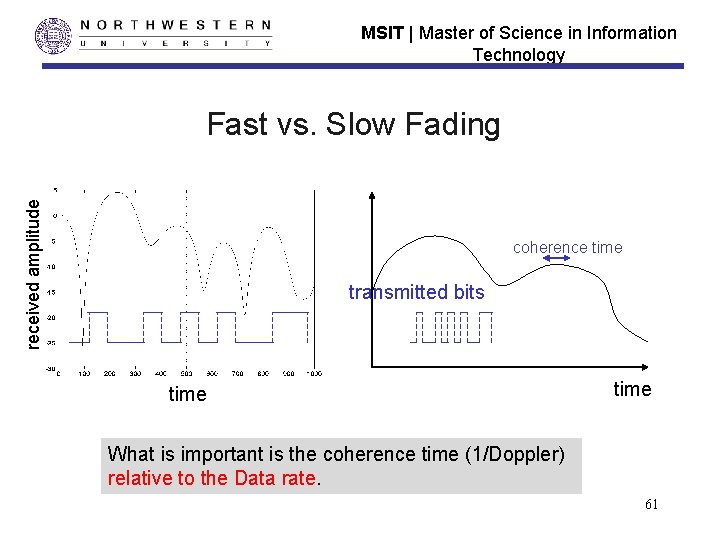
MSIT | Master of Science in Information Technology received amplitude Fast vs. Slow Fading coherence time transmitted bits time Fast fading: channel changes every few symbols. Coherence time is less than roughly 100 symbols. time Slow fading: Coherence time lasts more than a few 100 symbols. 60
MSIT | Master of Science in Information Technology received amplitude Fast vs. Slow Fading coherence time transmitted bits time What is important is the coherence time (1/Doppler) relative to the Data rate. 61
MSIT | Master of Science in Information Technology Channel Characterizations: Narrowband vs. Wideband Narrowband signal (sinusoid) Multipath channel infinite duration, zero bandwidth Amplitude attenuation, Delay (phase shift) delay spread Wideband signal (impulse) s(t) time t zero duration, infinite bandwidth r(t) Multipath channel time t multipath components 62
MSIT | Master of Science in Information Technology Pulse Width vs. Bandwidth Power signal pulse Narrowband T frequency time signal pulse Power Wideband time T bandwidth = 1/T frequency 63
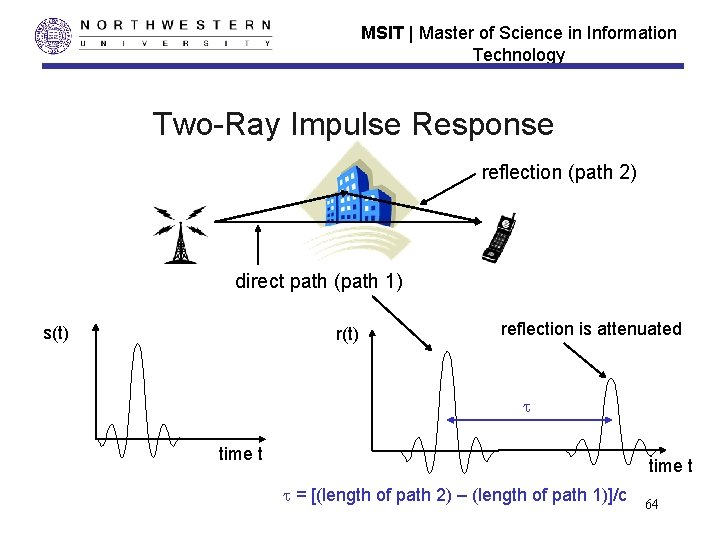
MSIT | Master of Science in Information Technology Two-Ray Impulse Response reflection (path 2) direct path (path 1) s(t) reflection is attenuated time t = [(length of path 2) – (length of path 1)]/c 64
MSIT | Master of Science in Information Technology Urban Multipath s(t) r(t) time t r(t) different location for receiver Spacing and attenuation of multipath components depend on location and environment. time t 65
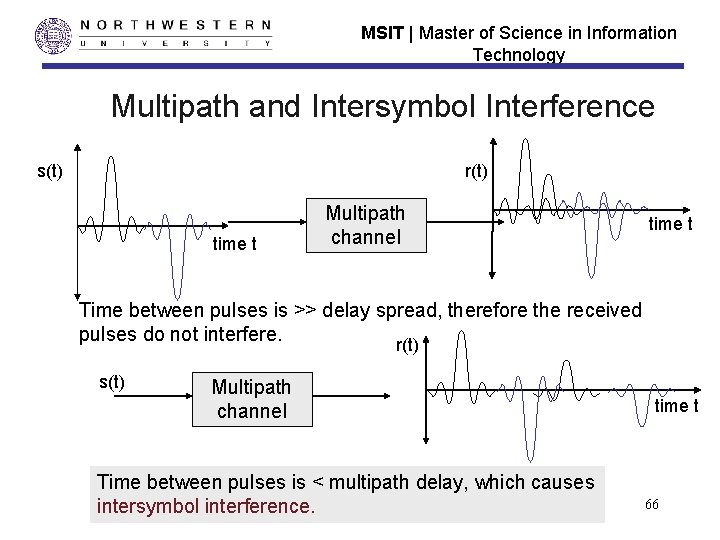
MSIT | Master of Science in Information Technology Multipath and Intersymbol Interference s(t) r(t) time t Multipath channel time t Time between pulses is >> delay spread, therefore the received pulses do not interfere. r(t) s(t) Multipath channel Time between pulses is < multipath delay, which causes intersymbol interference. time t 66
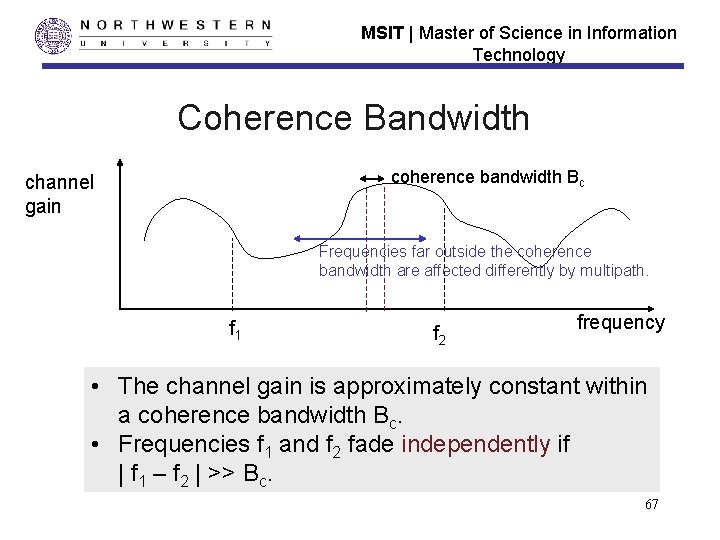
MSIT | Master of Science in Information Technology Coherence Bandwidth coherence bandwidth Bc channel gain Frequencies far outside the coherence bandwidth are affected differently by multipath. f 1 f 2 frequency • The channel gain is approximately constant within a coherence bandwidth Bc. • Frequencies f 1 and f 2 fade independently if | f 1 – f 2 | >> Bc. 67
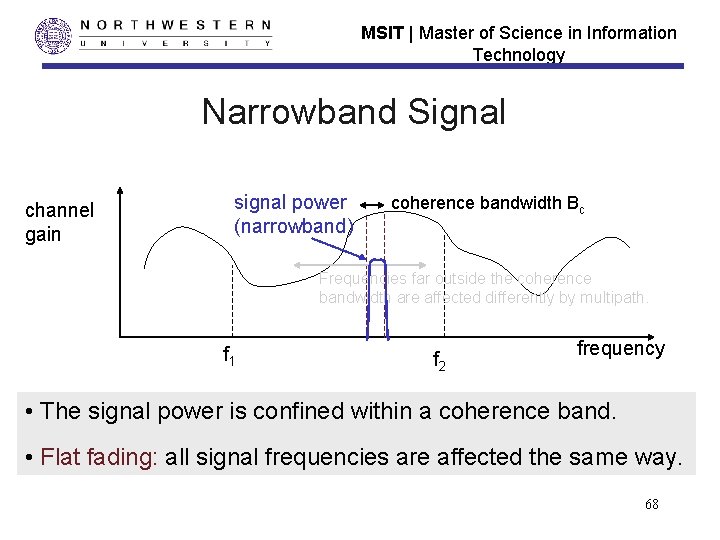
MSIT | Master of Science in Information Technology Narrowband Signal channel gain signal power (narrowband) coherence bandwidth Bc Frequencies far outside the coherence bandwidth are affected differently by multipath. f 1 f 2 frequency • The signal power is confined within a coherence band. • Flat fading: all signal frequencies are affected the same way. 68
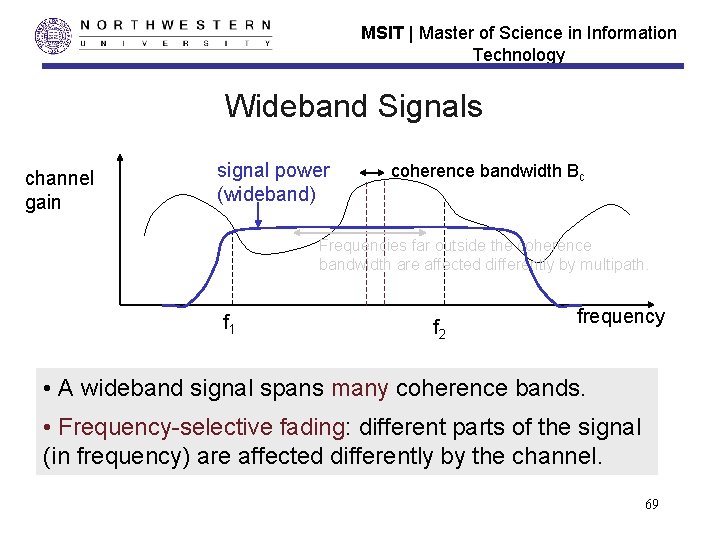
MSIT | Master of Science in Information Technology Wideband Signals channel gain signal power (wideband) coherence bandwidth Bc Frequencies far outside the coherence bandwidth are affected differently by multipath. f 1 f 2 frequency • A wideband signal spans many coherence bands. • Frequency-selective fading: different parts of the signal (in frequency) are affected differently by the channel. 69
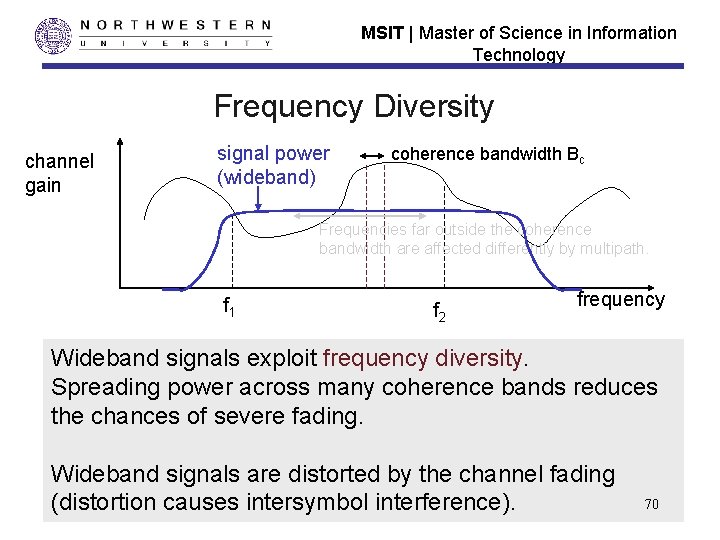
MSIT | Master of Science in Information Technology Frequency Diversity channel gain signal power (wideband) coherence bandwidth Bc Frequencies far outside the coherence bandwidth are affected differently by multipath. f 1 f 2 frequency Wideband signals exploit frequency diversity. Spreading power across many coherence bands reduces the chances of severe fading. Wideband signals are distorted by the channel fading (distortion causes intersymbol interference). 70
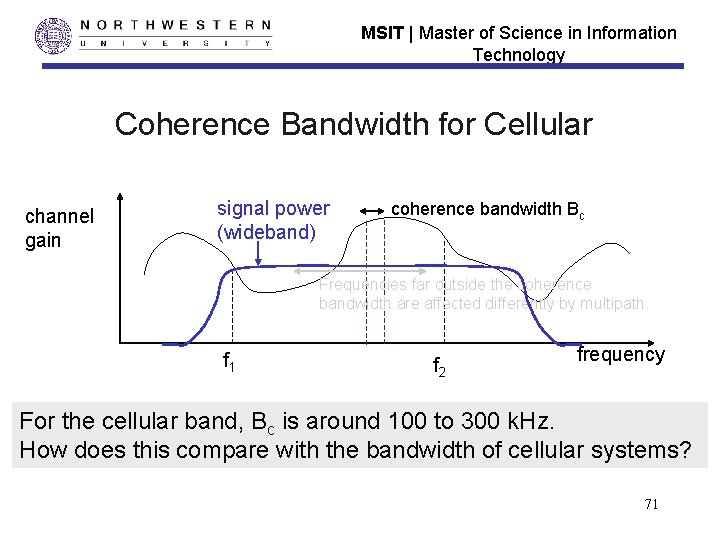
MSIT | Master of Science in Information Technology Coherence Bandwidth for Cellular channel gain signal power (wideband) coherence bandwidth Bc Frequencies far outside the coherence bandwidth are affected differently by multipath. f 1 f 2 frequency For the cellular band, Bc is around 100 to 300 k. Hz. How does this compare with the bandwidth of cellular systems? 71
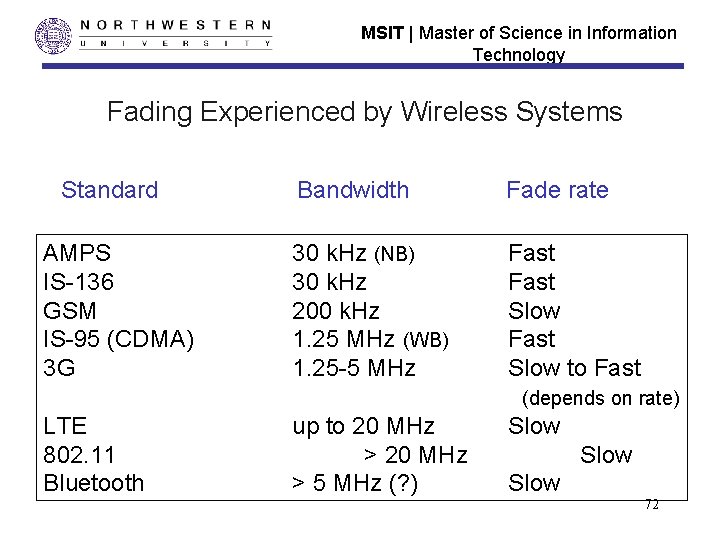
MSIT | Master of Science in Information Technology Fading Experienced by Wireless Systems Standard AMPS IS-136 GSM IS-95 (CDMA) 3 G Bandwidth Fade rate 30 k. Hz (NB) 30 k. Hz 200 k. Hz 1. 25 MHz (WB) 1. 25 -5 MHz Fast Slow to Fast (depends on rate) LTE 802. 11 Bluetooth up to 20 MHz > 5 MHz (? ) Slow 72
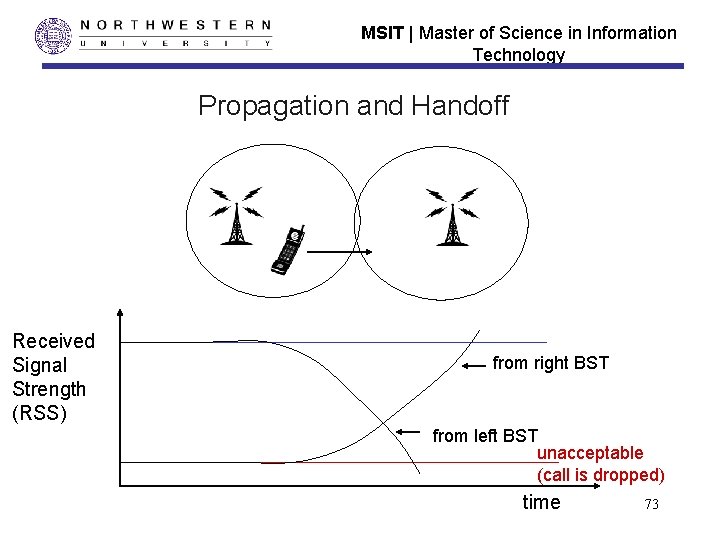
MSIT | Master of Science in Information Technology Propagation and Handoff Received Signal Strength (RSS) from right BST from left BST unacceptable (call is dropped) time 73
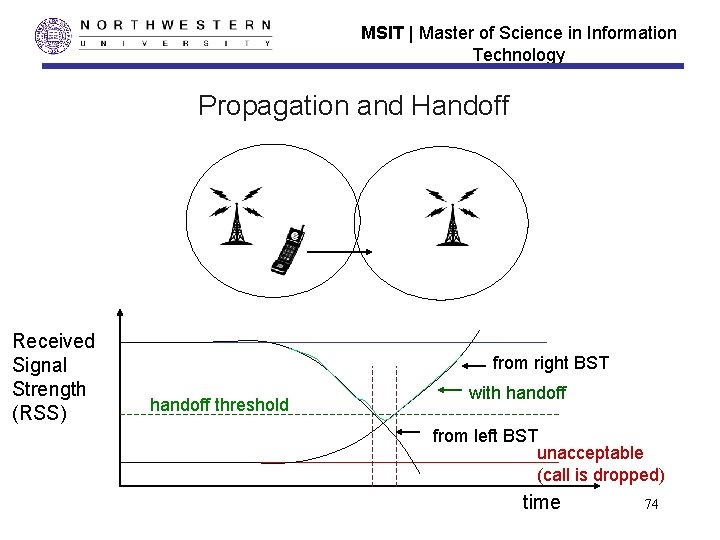
MSIT | Master of Science in Information Technology Propagation and Handoff Received Signal Strength (RSS) from right BST handoff threshold with handoff from left BST unacceptable (call is dropped) time 74
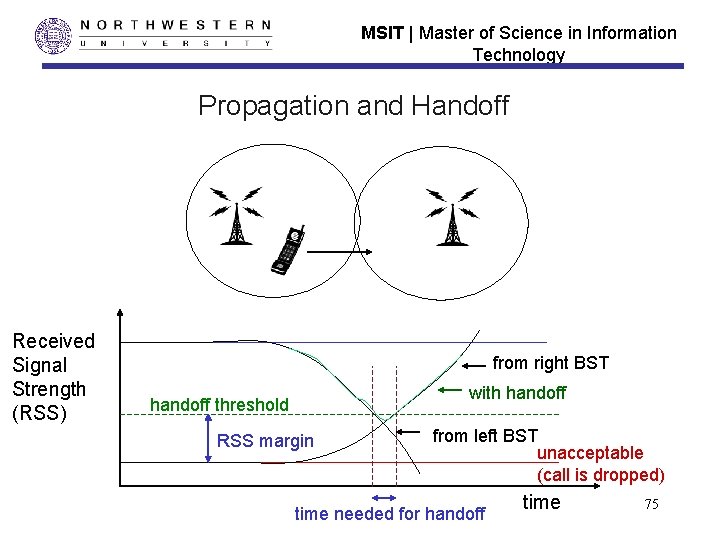
MSIT | Master of Science in Information Technology Propagation and Handoff Received Signal Strength (RSS) from right BST with handoff threshold RSS margin from left BST unacceptable (call is dropped) time needed for handoff time 75
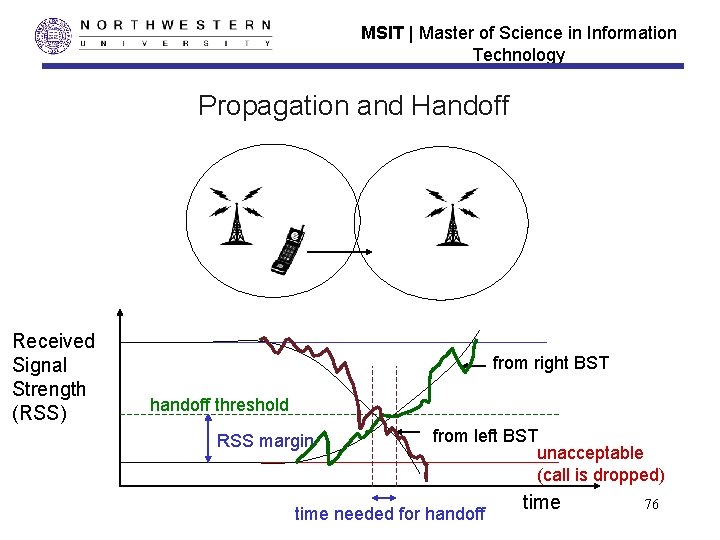
MSIT | Master of Science in Information Technology Propagation and Handoff Received Signal Strength (RSS) from right BST handoff threshold RSS margin from left BST unacceptable (call is dropped) time needed for handoff time 76
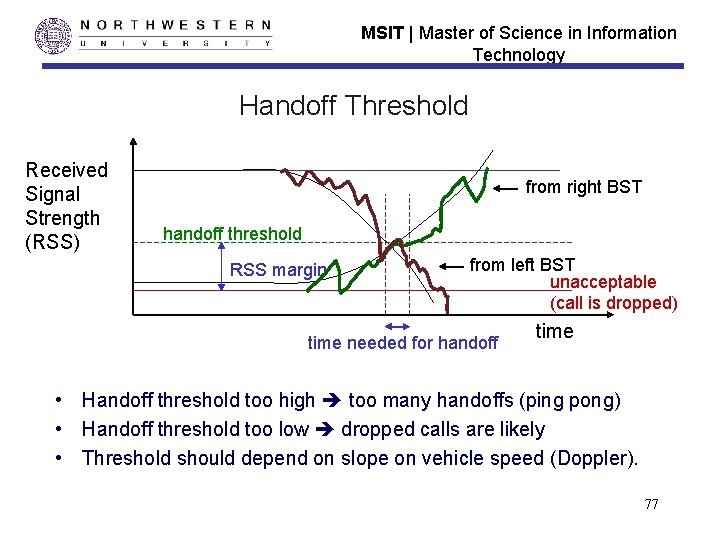
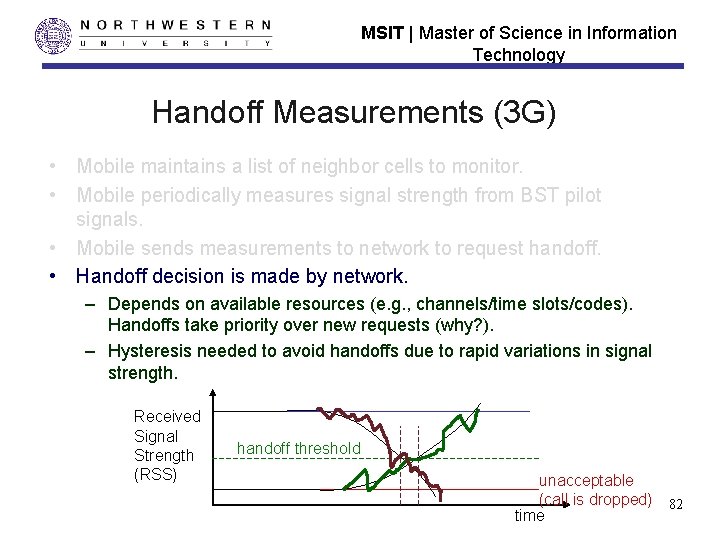
MSIT | Master of Science in Information Technology Handoff Threshold Received Signal Strength (RSS) from right BST handoff threshold RSS margin from left BST unacceptable (call is dropped) time needed for handoff time • Handoff threshold too high too many handoffs (ping pong) • Handoff threshold too low dropped calls are likely • Threshold should depend on slope on vehicle speed (Doppler). 77
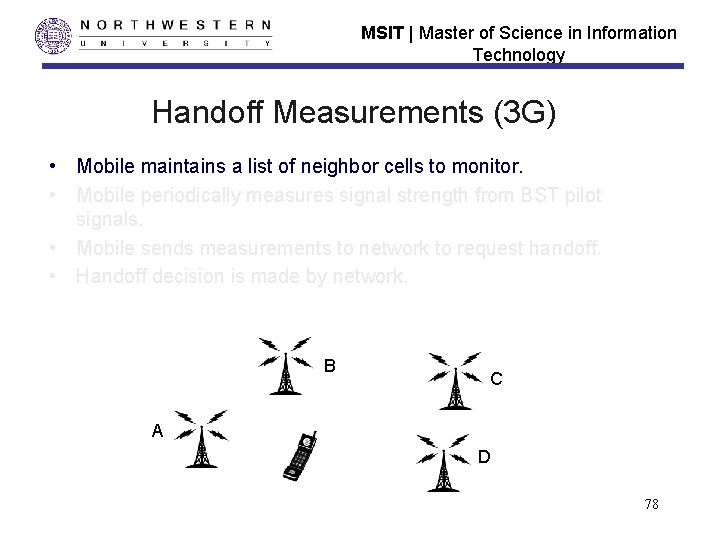
MSIT | Master of Science in Information Technology Handoff Measurements (3 G) • Mobile maintains a list of neighbor cells to monitor. • Mobile periodically measures signal strength from BST pilot signals. • Mobile sends measurements to network to request handoff. • Handoff decision is made by network. B C A D 78
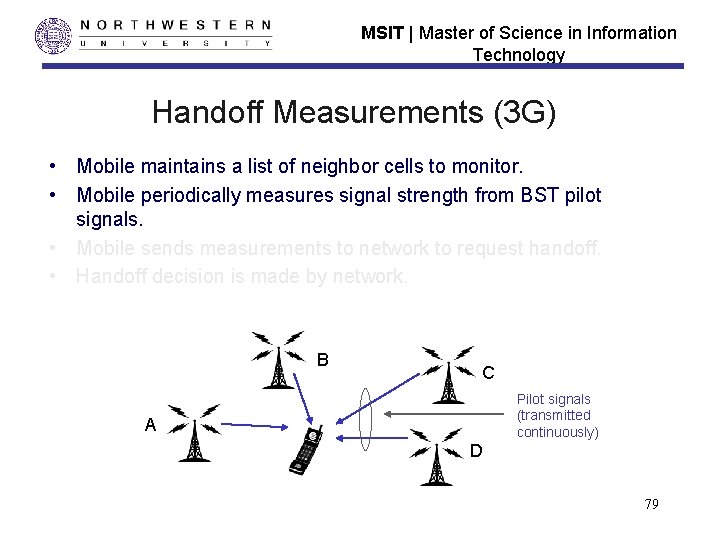
MSIT | Master of Science in Information Technology Handoff Measurements (3 G) • Mobile maintains a list of neighbor cells to monitor. • Mobile periodically measures signal strength from BST pilot signals. • Mobile sends measurements to network to request handoff. • Handoff decision is made by network. B C Pilot signals (transmitted continuously) A D 79
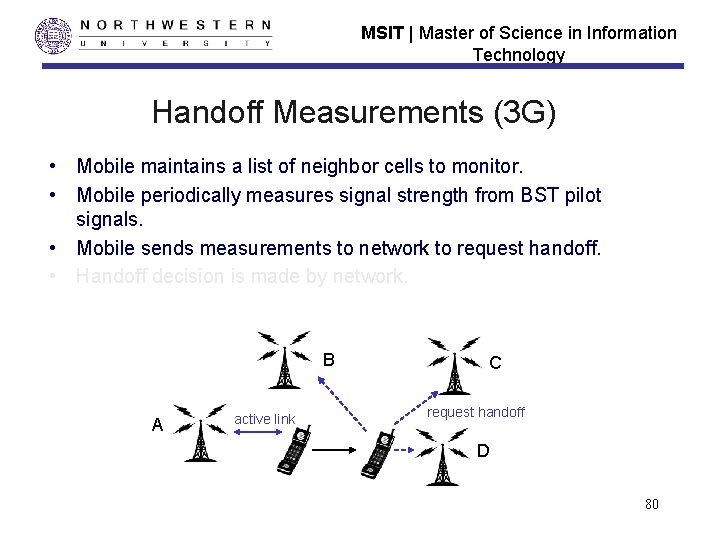
MSIT | Master of Science in Information Technology Handoff Measurements (3 G) • Mobile maintains a list of neighbor cells to monitor. • Mobile periodically measures signal strength from BST pilot signals. • Mobile sends measurements to network to request handoff. • Handoff decision is made by network. B A active link C request handoff D 80
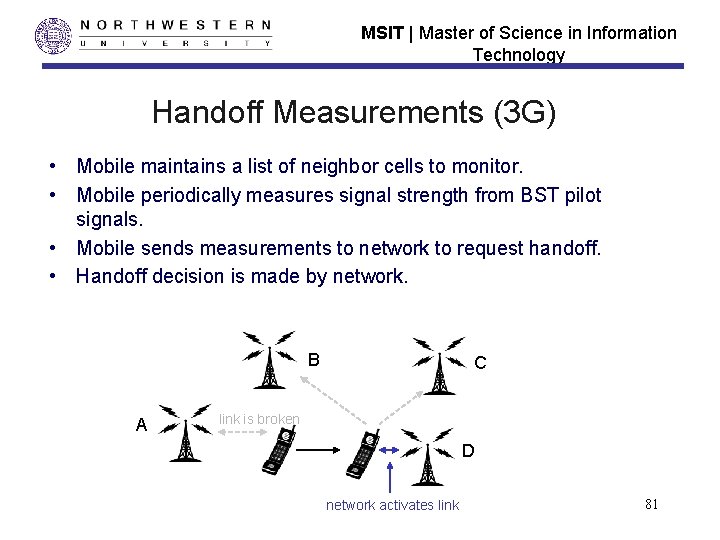
MSIT | Master of Science in Information Technology Handoff Measurements (3 G) • Mobile maintains a list of neighbor cells to monitor. • Mobile periodically measures signal strength from BST pilot signals. • Mobile sends measurements to network to request handoff. • Handoff decision is made by network. B A C link is broken D network activates link 81
MSIT | Master of Science in Information Technology Handoff Measurements (3 G) • Mobile maintains a list of neighbor cells to monitor. • Mobile periodically measures signal strength from BST pilot signals. • Mobile sends measurements to network to request handoff. • Handoff decision is made by network. – Depends on available resources (e. g. , channels/time slots/codes). Handoffs take priority over new requests (why? ). – Hysteresis needed to avoid handoffs due to rapid variations in signal strength. Received Signal Strength (RSS) handoff threshold unacceptable (call is dropped) time 82