
MRP Learning Objectives Describe the conditions under which
MRP
Learning Objectives § § Describe the conditions under which MRP is most appropriate. Describe the inputs, outputs, and nature of MRP processing. Explain how requirements in a master production schedule are translated into material requirements for lower-level items. Discuss the benefits and requirements of MRP. 2
Learning Objectives § Explain how an MRP system is useful in capacity requirements planning. § Outline the potential benefits and some of the difficulties users have encountered with MRP. § Describe MRP II and its benefits. § Describe ERP, what it provides, and its hidden costs. 3
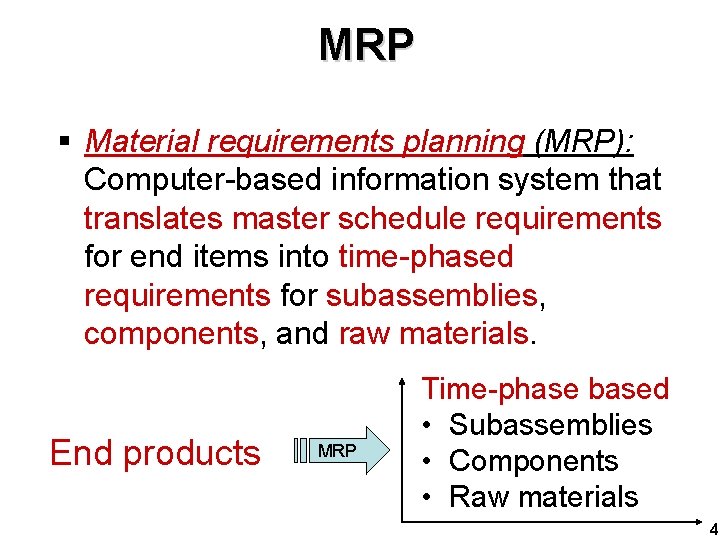
MRP § Material requirements planning (MRP): Computer-based information system that translates master schedule requirements for end items into time-phased requirements for subassemblies, components, and raw materials. End products MRP Time-phase based • Subassemblies • Components • Raw materials 4
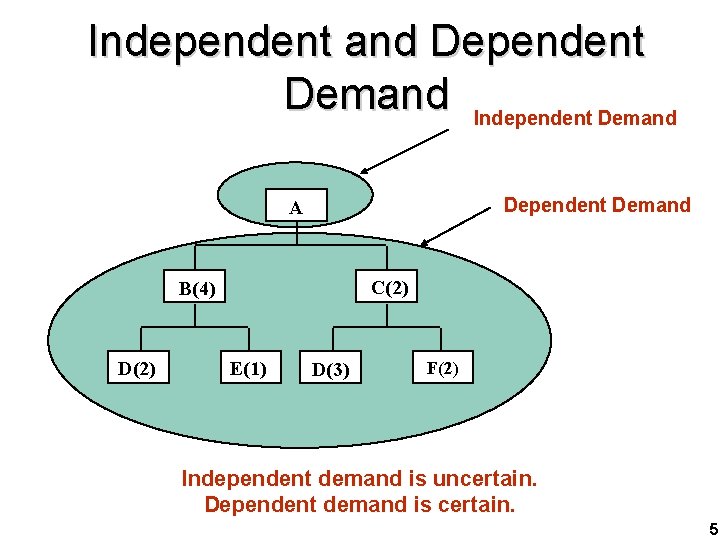
Independent and Dependent Demand Independent Demand Dependent Demand A C(2) B(4) D(2) E(1) D(3) F(2) Independent demand is uncertain. Dependent demand is certain. 5
Dependant Demand § Dependent demand: Demand for items that are subassemblies or component parts to be used in production of finished goods. § Once the independent demand is known, the dependent demand can be determined. 6
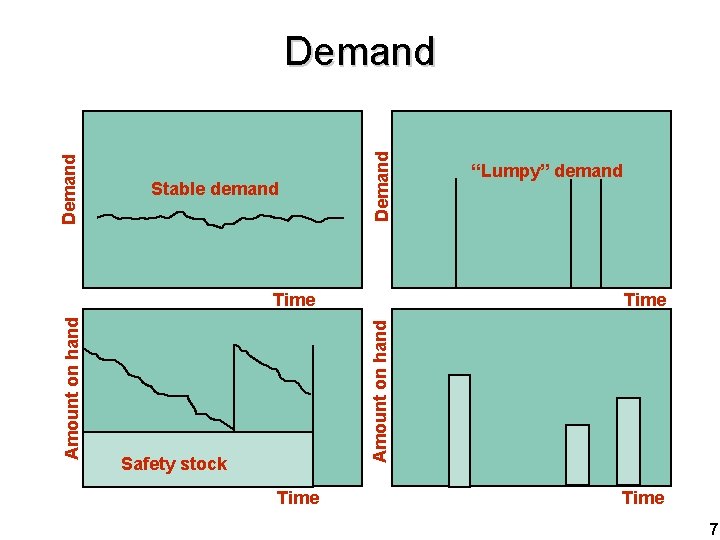
Stable demand Demand Time Amount on hand Time “Lumpy” demand Safety stock Time 7
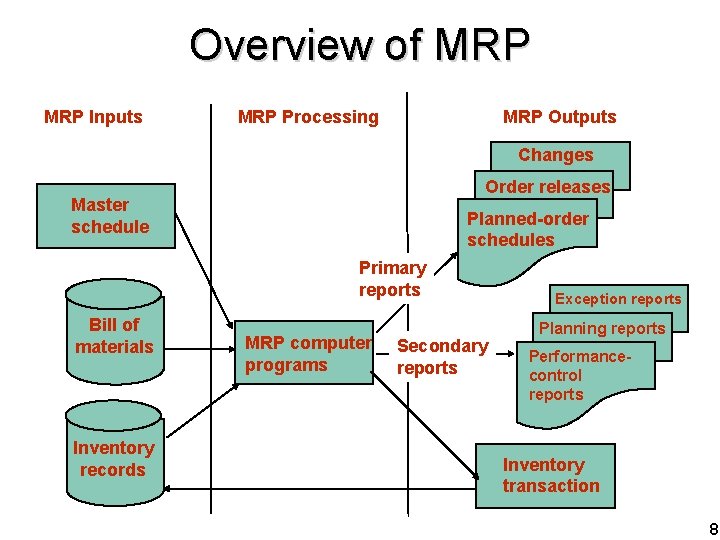
Overview of MRP Inputs MRP Processing MRP Outputs Changes Order releases Master schedule Planned-order schedules Primary reports Bill of materials Inventory records MRP computer programs Secondary reports Exception reports Planning reports Performancecontrol reports Inventory transaction 8
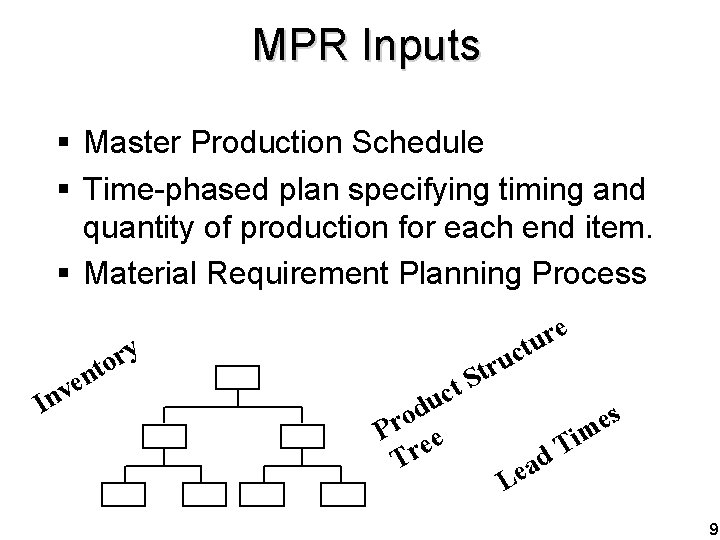
MPR Inputs § Master Production Schedule § Time-phased plan specifying timing and quantity of production for each end item. § Material Requirement Planning Process In y r to n ve e r u uct c u d o Pr ee Tr tr S t s e m i T d a e L 9
Master Schedule Master schedule: One of three primary inputs in MRP; states which end items are to be produced, when these are needed, and in what quantities. Cumulative lead time: The sum of the lead times that sequential phases of a process require, from ordering of parts or raw materials to completion of final assembly. 10
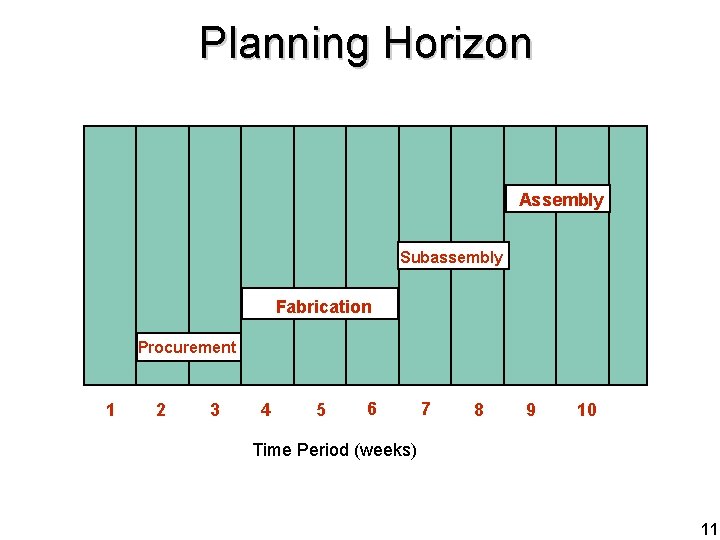
Planning Horizon Assembly Subassembly Fabrication Procurement 1 2 3 4 5 6 7 8 9 10 Time Period (weeks) 11
Bill-of-Materials Bill of materials (BOM): One of the three primary inputs of MRP; a listing of all of the raw materials, parts, subassemblies, and assemblies needed to produce one unit of a product. Product structure tree: Visual depiction of the requirements in a bill of materials, where all components are listed by levels. Low-level coding: Restructuring the bill of materials so that multiple occurrences of a component all coincide with the lowest level the component occurs 12
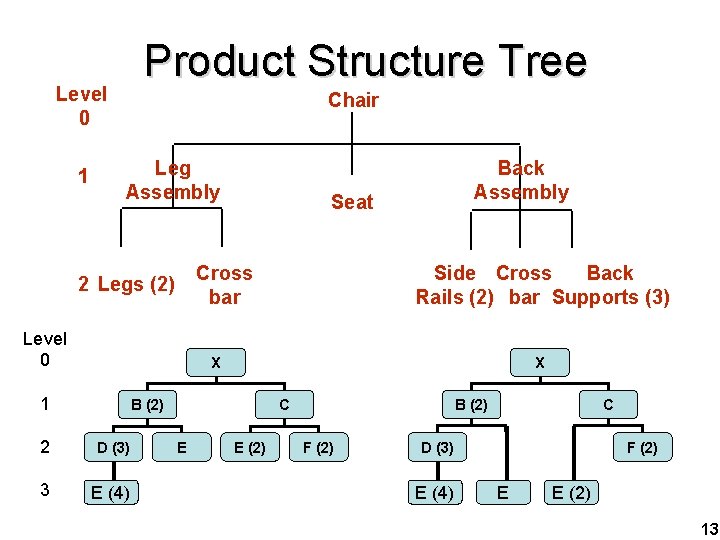
Product Structure Tree Level 0 1 Chair Leg Assembly Seat Cross bar 2 Legs (2) Level 0 Back Assembly Side Cross Back Rails (2) bar Supports (3) X 1 X B (2) 2 D (3) 3 E (4) C E E (2) B (2) F (2) C D (3) E E (2) E (4) E E (2) F (2) 13
Inventory Records § One of the three primary inputs in MRP § Includes information on the status of each item by time period § § § Gross requirements Scheduled receipts Amount on hand Lead times Lot sizes And more … 14
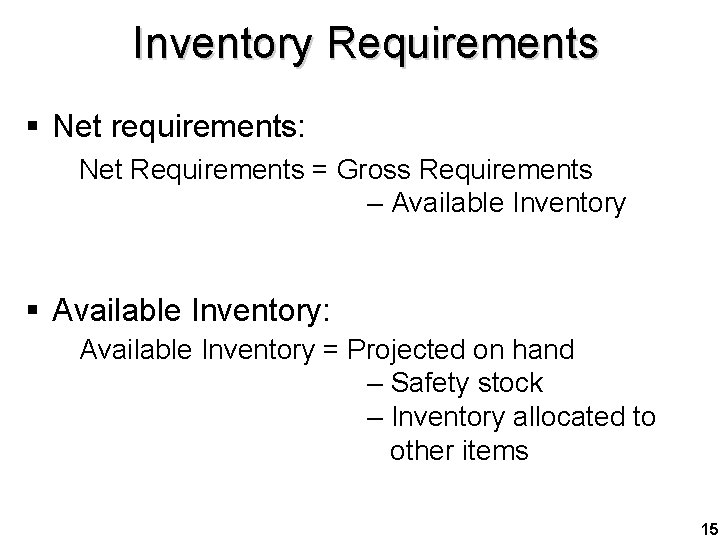
Inventory Requirements § Net requirements: Net Requirements = Gross Requirements – Available Inventory § Available Inventory: Available Inventory = Projected on hand – Safety stock – Inventory allocated to other items 15
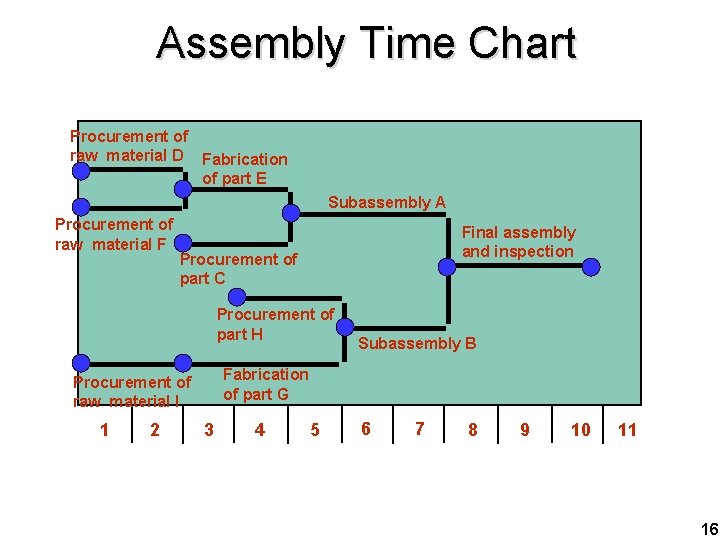
Assembly Time Chart Procurement of raw material D Fabrication of part E Subassembly A Procurement of raw material F Final assembly and inspection Procurement of part C Procurement of part H Fabrication of part G Procurement of raw material I 1 2 Subassembly B 3 4 5 6 7 8 9 10 11 16

Time-Phased Product Structure Must have D and E completed here so production can begin on B Start production of D 1 week D (2) Lead time A B C D E F G 2 weeks to produce B (2) 2 weeks E (2) A 2 weeks 1 week E (2) 2 weeks 1 week G (1) C (3) 3 weeks 1 2 1 1 2 3 2 weeks weeks F (2) 1 week D (2) | | | 1 2 3 | | 4 5 Time in weeks | | | 6 7 8 17
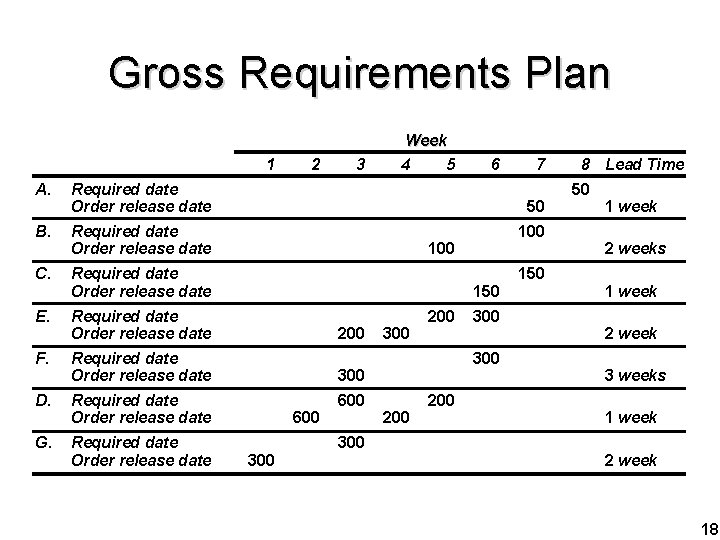
Gross Requirements Plan 1 A. Required date Order release date B. Required date Order release date C. Required date Order release date E. Required date Order release date F. Required date Order release date D. Required date Order release date G. Required date Order release date 2 3 Week 4 5 6 7 50 100 150 200 300 300 600 300 200 150 8 Lead Time 50 1 week 2 weeks 1 week 2 week 3 weeks 1 week 2 week 18
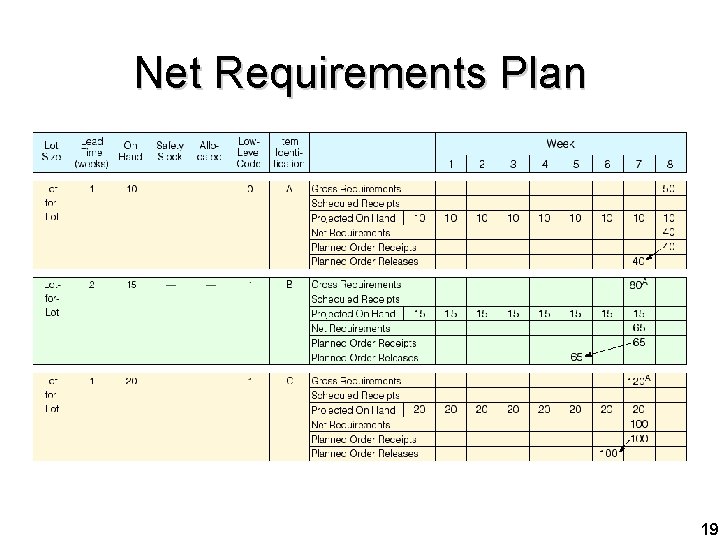
Net Requirements Plan 19
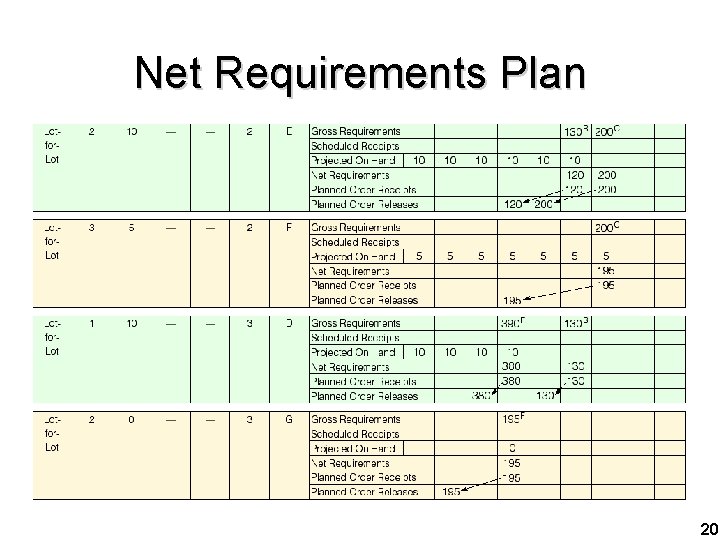
Net Requirements Plan 20
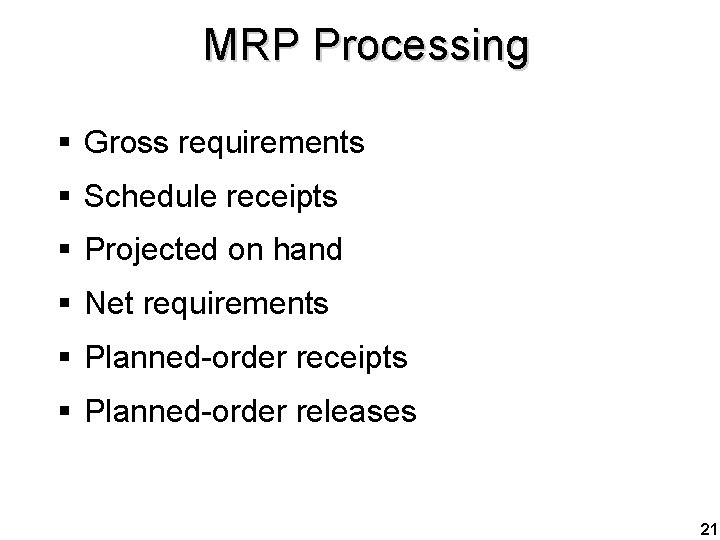
MRP Processing § Gross requirements § Schedule receipts § Projected on hand § Net requirements § Planned-order receipts § Planned-order releases 21
MPR Processing § Gross requirements § Total expected demand § Scheduled receipts § Open orders scheduled to arrive § Projected on hand § Expected inventory on hand at the beginning of each time period 22
MPR Processing § Net requirements § Actual amount needed in each time period § Planned-order receipts § Quantity expected to be received at the beginning of the period § Offset by lead time § Planned-order releases § Planned amount to order in each time period 23

Lot-Sizing Techniques þ Lot-for-lot techniques order just what is required for production based on net requirements þ May not always be feasible þ If setup costs are high, costs may be high as well þ Economic order quantity (EOQ) þ EOQ expects a known constant demand MRP systems often deal with unknown and variable demand 24
Lot-Sizing Techniques þ Part Period Balancing (PPB) looks at future orders to determine most economic lot size þ EPP = setup cost / holding cost þ Programming technique þ Assumes a finite time horizon þ Effective, but computationally burdensome 25
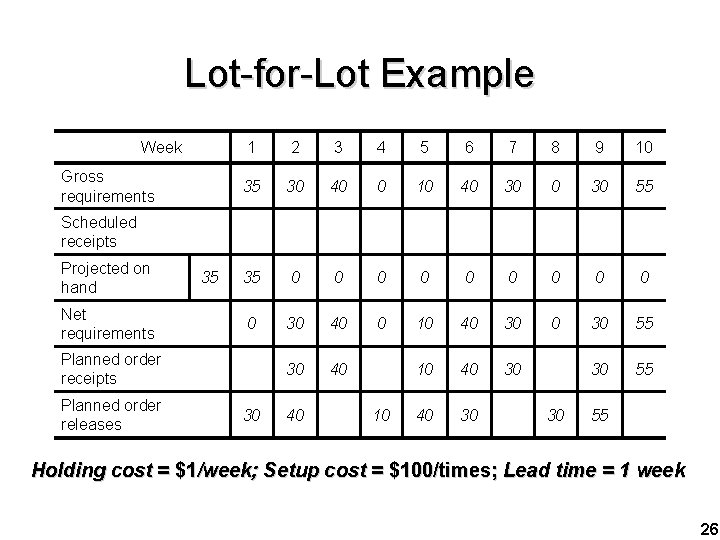
Lot-for-Lot Example Week Gross requirements 1 2 3 4 5 6 7 8 9 10 35 30 40 0 10 40 30 55 35 0 0 0 0 0 30 40 0 10 40 30 55 30 40 10 40 30 30 55 40 30 Scheduled receipts Projected on hand Net requirements 35 Planned order receipts Planned order releases 30 40 10 30 55 Holding cost = $1/week; Setup cost = $100/times; Lead time = 1 week 26
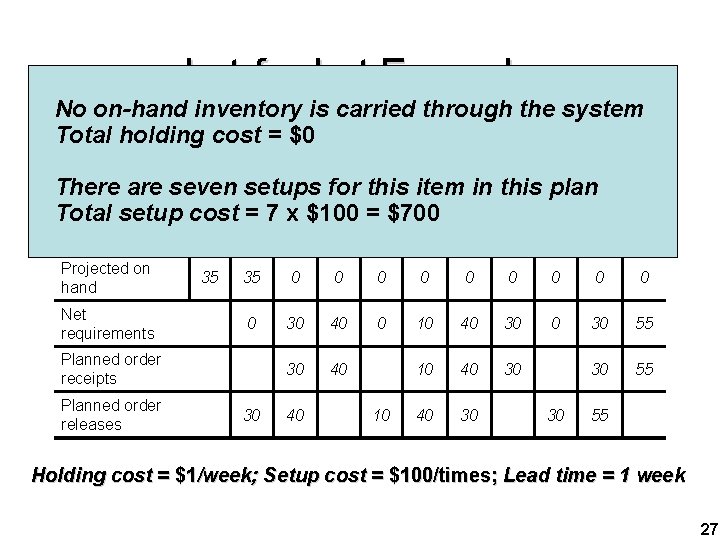
Lot-for-Lot Example No on-hand inventory is carried through the system Total holding cost = $0 1 2 3 4 5 6 7 8 9 10 Gross 30 40 this 0 10 30 There are seven 35 setups for item 40 in this plan requirements Total setup cost = 7 x $100 = $700 Scheduled 55 receipts Projected on hand Net requirements 35 35 0 0 0 0 0 30 40 0 10 40 30 55 30 40 10 40 30 30 55 40 30 Planned order receipts Planned order releases 30 40 10 30 55 Holding cost = $1/week; Setup cost = $100/times; Lead time = 1 week 27
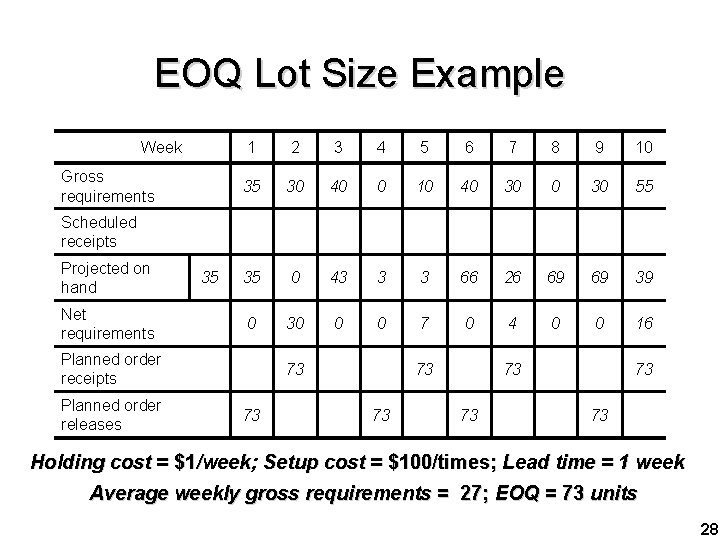
EOQ Lot Size Example Week Gross requirements 1 2 3 4 5 6 7 8 9 10 35 30 40 0 10 40 30 55 35 0 43 3 3 66 26 69 69 39 0 30 0 0 7 0 4 0 0 16 Scheduled receipts Projected on hand Net requirements 35 Planned order receipts Planned order releases 73 73 Holding cost = $1/week; Setup cost = $100/times; Lead time = 1 week Average weekly gross requirements = 27; EOQ = 73 units 28
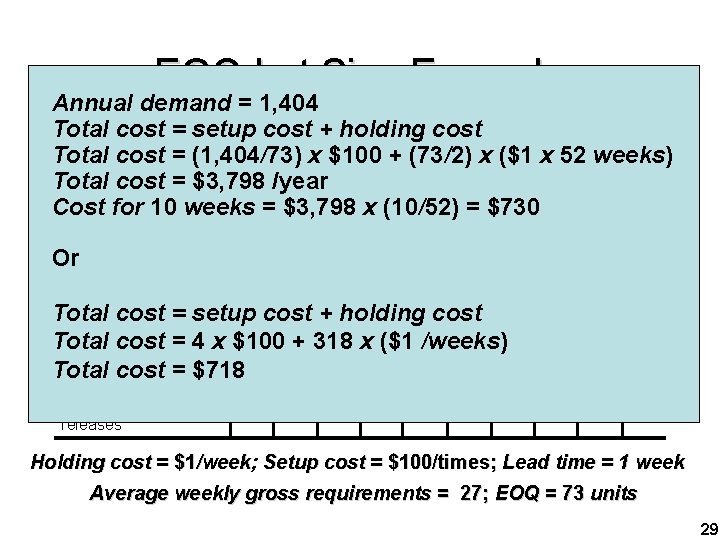
EOQ Lot Size Example Annual demand = 1, 404 Total cost = setup cost + holding cost 1 2 3 4 5 6 7 9 10 Total cost = (1, 404/73) x $100 + (73/2) x ($1 x 852 weeks) Gross cost = $3, 798 /year Total 35 30 40 0 10 40 30 55 requirements Cost for 10 weeks = $3, 798 x (10/52) = $730 Scheduled receipts Or Projected on hand 35 35 0 0 0 Net Total cost = setup 0 cost + 0 holding cost 30 0 7 0 4 requirements Total cost = 4 x $100 + 318 x ($1 /weeks) Planned order 73 73 73 Total receiptscost = $718 Planned order releases 73 73 73 0 0 0 16 73 73 Holding cost = $1/week; Setup cost = $100/times; Lead time = 1 week Average weekly gross requirements = 27; EOQ = 73 units 29
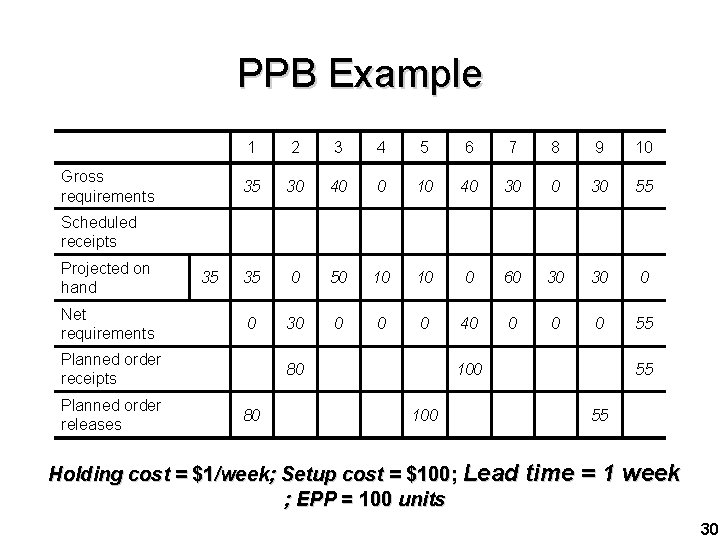
PPB Example Gross requirements 1 2 3 4 5 6 7 8 9 10 35 30 40 0 10 40 30 55 35 0 50 10 10 0 60 30 30 0 0 0 40 0 55 Scheduled receipts Projected on hand Net requirements 35 Planned order receipts Planned order releases 80 80 100 55 55 Holding cost = $1/week; Setup cost = $100; Lead time = 1 week ; EPP = 100 units 30
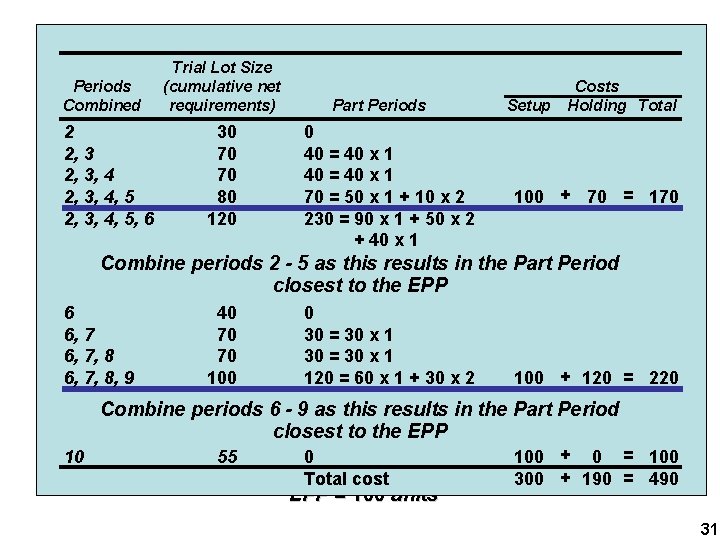
PPB Example Trial Lot Size (cumulative net requirements) Periods Combined 2 2, 3, 4 Gross requirements 2, 3, 4, 5, 6 Scheduled 30 70 1 70 35 80 120 receipts Combine periods Projected on 35 hand 6 Net requirements 6, 7, 8 order Planned 6, 7, 8, 9 receipts Planned order Combine releases 10 40 70 70 100 Part Periods 0 2 40 =3 40 x 41 5 6 40 = 40 x 1 30 40 0 10 40 70 = 50 x 1 + 10 x 2 230 = 90 x 1 + 50 x 2 + 40 x 1 Setup Costs Holding Total 7 8 9 10 30 55 100 + 70 = 170 2 - 5 as this results in the Part Period closest to the EPP 0 30 = 30 x 1 120 = 60 x 1 + 30 x 2 100 + 120 = 220 periods 6 - 9 as this results in the Part Period closest to the EPP 0 100 + 0 = 100 Holding cost = $1 /week; $100; + 190 = 490 Total cost Setup cost = 300 55 EPP = 100 units 31
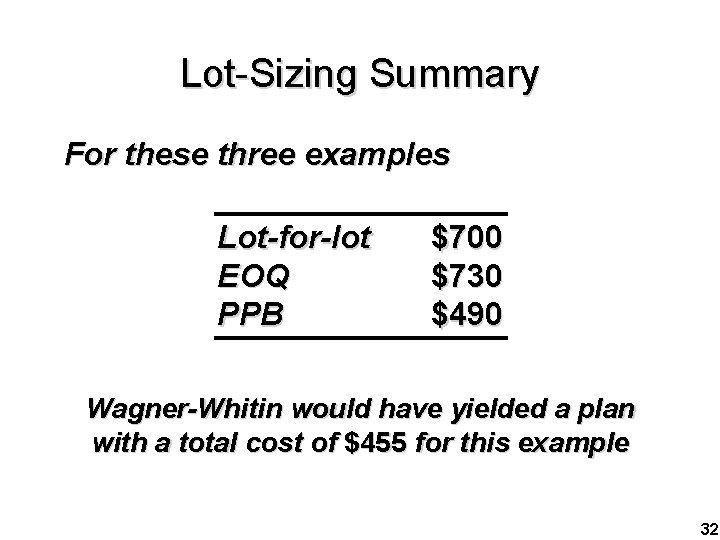
Lot-Sizing Summary For these three examples Lot-for-lot EOQ PPB $700 $730 $490 Wagner-Whitin would have yielded a plan with a total cost of $455 for this example 32
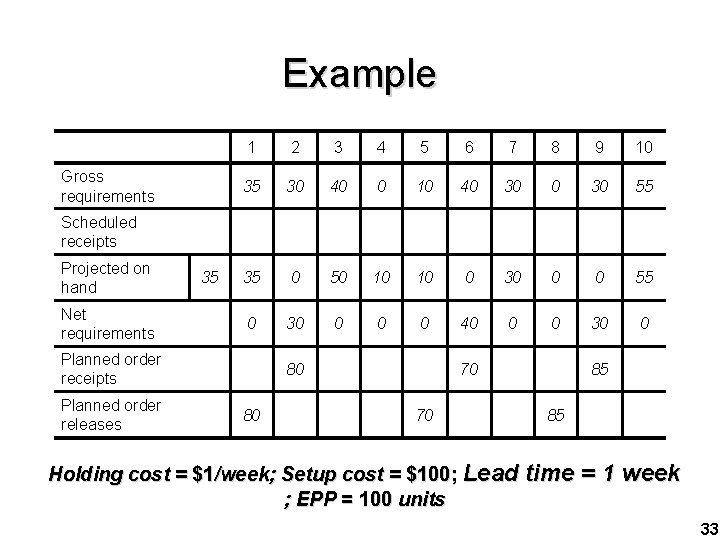
Example Gross requirements 1 2 3 4 5 6 7 8 9 10 35 30 40 0 10 40 30 55 35 0 50 10 10 0 30 0 0 55 0 30 0 40 0 0 30 0 Scheduled receipts Projected on hand Net requirements 35 Planned order receipts Planned order releases 80 80 70 70 85 85 Holding cost = $1/week; Setup cost = $100; Lead time = 1 week ; EPP = 100 units 33
Lot-Sizing Summary þ In theory, lot sizes should be recomputed whenever there is a lot size or order quantity change þ In practice, this results in system nervousness and instability þ Lot-for-lot should be used whenever economical þ Lot sizes can be modified to allow for scrap, process constraints, and purchase lots 34
Lot-Sizing Summary þ Use lot-sizing with care as it can cause considerable distortion of requirements at lower levels of the BOM þ When setup costs are significant and demand is reasonably smooth, PPB, Wagner-Whitin, or EOQ should give reasonable results 35
Updating the System § Regenerative system § Updates MRP records periodically § Net-change system § Updates MPR records continuously 36
MRP Primary Reports § Planned orders - schedule indicating the amount and timing of future orders. § Order releases - Authorization for the execution of planned orders. § Changes - revisions of due dates or order quantities, or cancellations of orders. 37
MRP Secondary Reports § Performance-control reports system evaluation, deviation, late delivery, stockouts § Planning reports useful forecasting future inventory, assess future material requirement § Exception reports late or overdue orders, excessive scrap rate, requirement of nonexisting parts 38
Material Checking & Balancing þ Use for monitoring of amount of part and product during processes þ Needs information to balance materials þAccumulative production planning or target plan þBOM or Assembly diagram þ Normally periodic checked 39
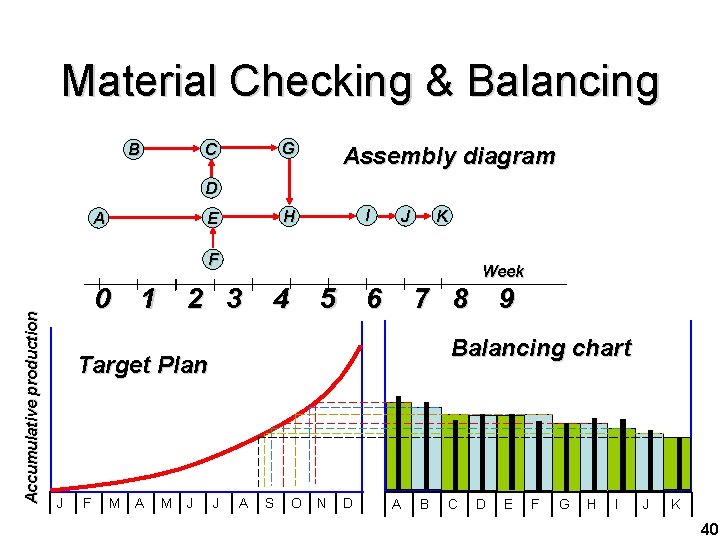
Material Checking & Balancing G C B Assembly diagram D I H E A K J Accumulative production F 0 1 Week 2 3 4 5 6 7 8 Balancing chart Target Plan J F M A M J 9 J A S O N D A B C D E F G H I J K 40
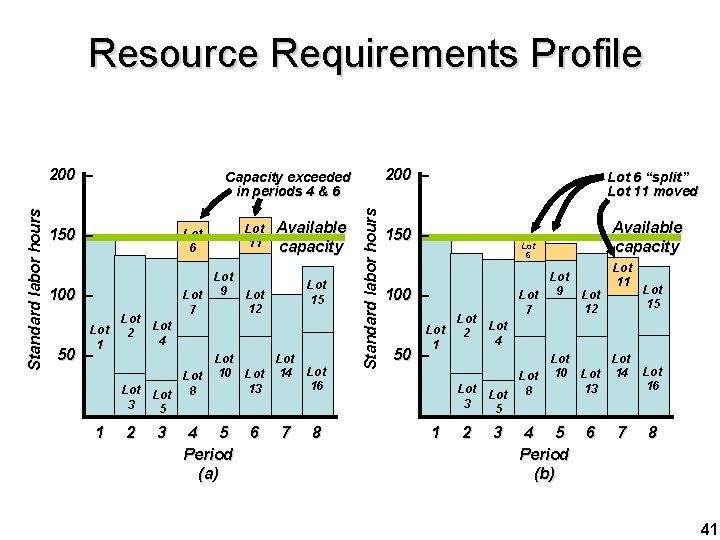
Resource Requirements Profile Capacity exceeded in periods 4 & 6 150 – 100 – Lot 1 Lot 2 50 – – Lot 11 Lot 6 Lot 3 1 2 Lot 7 Lot 9 Available capacity Lot 15 Lot 12 Lot 4 Lot 8 Lot 5 3 Lot 10 Lot 14 13 4 5 Period (a) 6 7 Lot 16 8 Standard labor hours 200 – Lot 6 “split” Lot 11 moved 150 – Available capacity Lot 6 100 – Lot 1 Lot 2 50 – – Lot 3 1 2 Lot 7 Lot 9 Lot 12 Lot 11 Lot 15 Lot 4 Lot 8 Lot 5 3 Lot 10 Lot 14 13 4 5 Period (b) 6 7 Lot 16 8 41
Smoothing Tactics 1. Overlapping þ Sends part of the work to following operations before the entire lot is complete þ Reduces lead time 2. Operations splitting þ Sends the lot to two different machines for the same operation þ Shorter throughput time but increased setup costs 3. Lot splitting þ Breaking up the order into smaller lots and running part ahead of schedule 42
Other Considerations § Safety Stock § Lot sizing § § § Lot-for-lot ordering Economic order quantity Fixed-period ordering 43
MRP in Services § Food catering service § End item => catered food § Dependent demand => ingredients for each recipe, i. e. bill of materials 44
Benefits of MRP § Low levels of in-process inventories § Ability to track material requirements § Ability to evaluate capacity requirements § Means of allocating production time § Ability to easily determine inventory usage by backflushing § Backflushing: Exploding an end item’s bill of materials to determine the quantities of the components that were used to make the item. 45
Requirements of MRP § Computer and necessary software § Accurate and up-to-date § § § Master schedules Bills of materials Inventory records § Integrity of data 46
MRP II § Expanded MRP with emphasis placed on integration § Financial planning § Marketing § Engineering § Purchasing § Manufacturing 47
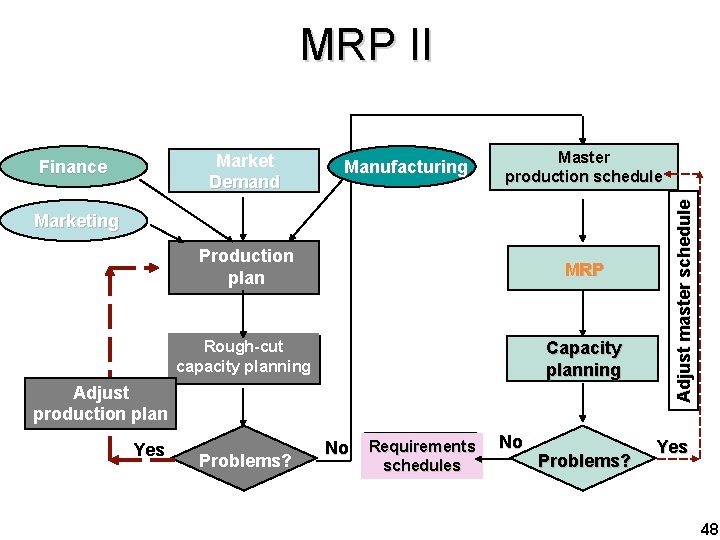
MRP II Manufacturing Master production schedule Marketing Production plan MRP Rough-cut capacity planning Capacity planning Adjust production plan Yes Problems? No Requirements schedules No Problems? Adjust master schedule Market Demand Finance Yes 48
ERP § Enterprise resource planning (ERP): § Next step in an evolution that began with MPR and evolved into MRPII § Integration of financial, manufacturing, and human resources on a single computer system. 49
ERP Software § ERP software provides a system to capture and make data available in real time to decision makers and other users in the organization § Provides tools for planning and monitoring various business processes § Includes § Production planning and scheduling § Inventory management § Product costing § Distribution 50
MRP in Services § Service applications such as: § § § § § Professional services Postal services Retail Banking Healthcare Higher education Engineering Logistical services Real estate 51
ERP Strategy Considerations § § High initial cost High cost to maintain Future upgrades Training 52
- Slides: 52