MRI Physics KSpace Anna Beaumont FRCR Part I

MRI Physics: K-Space Anna Beaumont FRCR Part I Physics

K space questions Concerning k-space: n a. A line of data in k-space contains information corresponding to a particular phase-encoding step n b. The central part of k-space contains information about low spatial frequencies n c. Elimination of the periphery of the k-space would result in poor contrast but a sharp image n d. One abnormally bright pixel in k-space would transform into a series of bright and dark circles originating from the centre of the final image n e. The entire k-space must be acquired in order for the information to be transformed into a usable image n f. The centre of K-space contains the data relating to high spatial resolution
; the distance between two")
k? • A wave is characterised by its wavelength (λ); the distance between two corresponding peaks. • The wavenumber is k • k= 1/ λ • k= the number of waves per unit distance • Spatial analogue to ‘cycles per second’ (frequency)

What is k-space? n K space is an array of numbers representing spatial frequencies in the MR image. n The readout MR signal is a mixture of RF waves with different amplitudes, frequencies and phases containing spatial information. n This signal is digitised and the raw data written into a data matrix called k-space n To go from k-space data to an image requires using a 2 D inverse Fourier Transform. n The individual points in k space do not correspond to individual pixels in the image. n Each k space point contains spatial frequency & phase information about every pixel in the final image. n Conversely, each pixel in the image maps to every point in k space.
 • S 1 has amplitude • • • A • f")
Fourier Transform (FT) • S 1 has amplitude • • • A • f a and frequency f S 2 has a/2 and 3 f S 3 = S 1 + S 2 S 3 is two sine waves of different frequency and amplitude The FT is shown

What is k-space? n The Fourier transform can decompose images. n Instead of analysing a time varying signal, it decomposes a variation of intensity (grey levels) over distance. n Time domain becomes space domain and frequency is called spatial frequency.

What is k-space? n Spatial frequency is related to the periodicity with which the image intensity values change. n Image features that change in intensity over short image distances correspond to high spatial frequencies. n Image features that change in intensity over long image distances correspond to low spatial frequencies. n To decompose a 2 D image we need to perform a 2 D

What is k-space? n Decompose image row by row n Obtain grey level intensities of chosen line n Perform 1 D Fourier Transform n Obtain spectrum
")
What is k-space? n Note: Low spatial frequencies (change in intensity over long distances) are prevailing n Low spatial frequencies have greatest change in intensity n High spatial frequencies (change in intensity over short distances) have lower amplitudes n General shape of the image is described by low spatial frequencies: this is also true with MRI

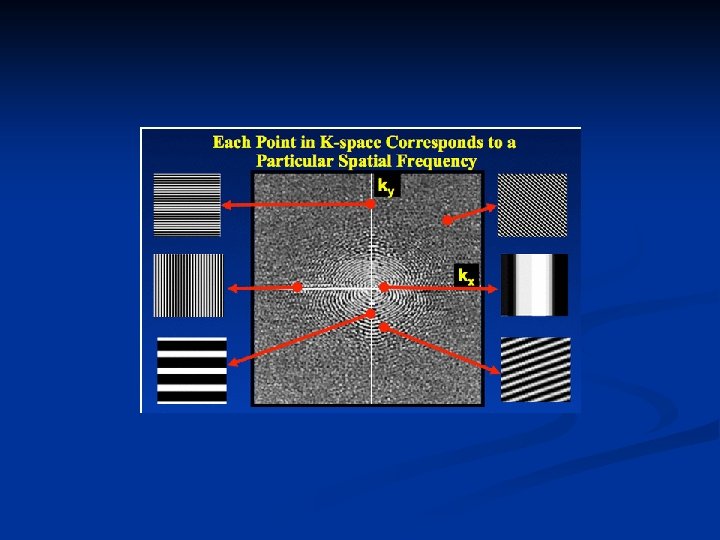
What is k-space? n Final result is called a Fourier plane and is represented by an image: n. Horizontal and vertical axis correspond to horizontal and vertical spatial frequencies. n. Pixel intensity corresponds to amplitude of frequency component n. Centre of k space corresponds to low spatial frequencies n. The periphery of k space corresponds to high spatial frequencies.

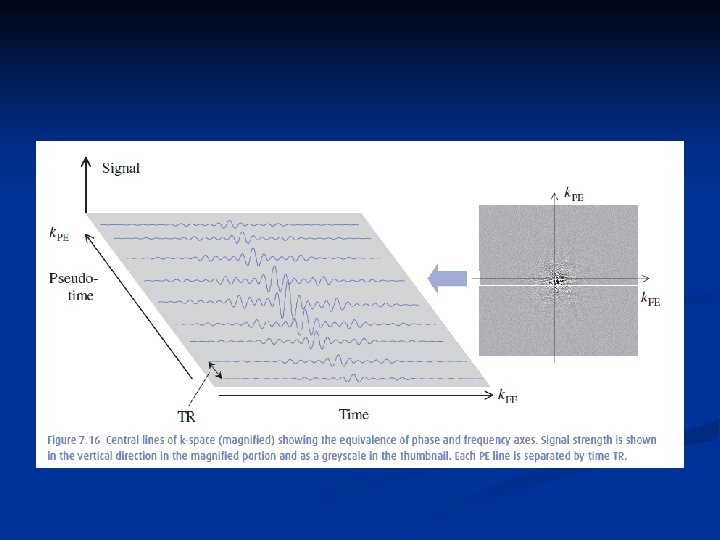
What is k-space? n A spin echo sequence fills k- space line by line. n Each application of the FE gradient fills a line in kx n Increments in PE gradient fills each line in ky n Echo amplitudes are larger at low order PE steps (less gradient induced dephasing), values will be brighter near the centre of the grid. n Higher strength/ longer duration gradients cause more dephasing, hence greater differences

Contrast & Resolution in kspace n The location of the data in k-space depends on the net strength and duration of the PE and FE gradients. n A low amplitude or short duration gradient event encodes low spatial frequency information. n A high amplitude or long duration gradient event encodes high spatial frequency information.
 is")
Contrast & Resolution in kspace n Most MR information (contrast & general shape) is contained in the centre of k-space. n. Low spatial frequencies have the highest amplitude, giving the greatest changes in grey levels (contrast) n. However these changes are spread over the image and only give the general shape of the organs n Image is contrasted but blurry

Contrast & Resolution in kspace n High spatial frequency has lower amplitude n Sharpens the image as encoding the edges (rapid changes of image signal as a function of position). n The further from the centre of k-space, the higher the frequencies and the better the spatial resolution

k-space Full k-space Centre k-space Edge k-space

k-space trajectories ky kx GRE or SE: one line of k-space per TR (usually 256, 512 lines) Image time = Nphase TR EPI: all lines of k-space per TR (typically 64 or 128) Image time = TR

k-space trajectories Spiral: more efficient single shot Radial k-space: Centre oversampled Motion compensation

Partial k-space These techniques acquire part of k-space and ‘fill-in’ the rest due to conjugate symmetry ky Just over half data collected kx Partial Fourier: Also called fractional NEX Collects half of phase-encode steps and speeds up imaging Partial Echo: Collects half of echo reducing the shortest possible TE

Summary: Key points n Spatial encoding uses gradients. n The data acquired are mapped into k space so that an inverse Fourier transform reconstructs the MR image. n The location of the data in k space depends on the strength and duration of the gradients. n. If no gradient applied, the location is at the centre of k space n. The higher the strength or the longer the duration, the further from the centre of k space the data will be located.

Summary: Key points n Simplest way to fill k-space is line by line. n One line of k-space is fully acquired at each excitation (containing low and high horizontal spatial frequency information). n Between each repetition there is a change in PE gradient strength. n This allows filling of the lines of k-space from top to bottom.

Summary: Key points n Each point in k space encodes for spatial information of the entire MR image. n Each point of the MR image is the result of the combination of ALL the data of k-space. n Centre of k-space contains low spatial frequency information. n. Most image information is contained in low spatial frequency information: general shape & contrast. n Periphery of k-space does not correspond to periphery of image: it contains high spatial frequency. n. The higher the spatial frequency, the smaller the details of the image (edges and spatial resolution).

K space -answers Concerning k-space: n a. A line of data in k-space contains information corresponding to a particular phase-encoding step - TRUE n b. The central part of k-space contains information about low spatial frequencies – TRUE. This contributes to the bulk of the image contrast. n c. Elimination of the periphery of the k-space would result in poor contrast but a sharp image – FALSE. This would result in blurry images, i. e poor spatial resolution, but contrast would be preserved. As contrast is more important for the final image, acquisition of the k-space periphery can sometimes be omitted to gain imaging speed, but sacrificing sharpness. n D. See artefact lecture

K space -answers Concerning k-space: n e. The entire k-space must be acquired in order for the information to be transformed into a usable image – FALSE. It is sufficient to acquire just over one-half of the k-space. As k-space is symmetrical, the acquired half may be ‘mirrored’ (with appropriate mathematical corrections) into the missing half and the image reconstructed without loss of spatial resolution but with decreased SNR. This is sometimes known as half or fractional NEX imaging. n f. The centre of K-space contains the data relating to high spatial resolution – FALSE – The periphery of K-space contains data relating to spatial resolution. The centre contains data for high signal intensity.

Imaging Issues

Anatomical Axes for FE/PE FE and PE directions can be swapped. n PE information takes longer to acquire, so useful to avoid PE in direction of any potential motion artefacts. n Phase encoding also susceptible to Phase Wrap artefacts (more on that in Lecture 9) n To avoid this, make sure no anatomy outside of FOV in PE direction. n n E. g. in a coronal head scan, use R-L for PE (all anatomy inside the FOV), and S-I for FE

Multi slice imaging Dead time in TR whilst waiting for a sequence to repeat can be used to excite other slices. n For example: n TR =600 ms, TE = 20 ms for T 1 weighting n Take ~ 30 ms to excite the slice, generate the spin echo and collect the data. 570 ms left before we can excite that slice a second time. n Use time to excite a different slice… and another… n n Second slice chosen will have a small gap to avoid artefacts called cross-talk.

Frequency aliasing n The MRI signal is a rapidly changing analogue electric voltage in the receiver coil, oscillating at high frequencies. n It needs to be converted into a digital signal, before being reconstructed into the final image. n The digital signal needs to be an accurate representation of the digital signal, so needs to be sampled at a high enough rate.

Frequency aliasing n n Nyquist Law: If ωmax is the max. frequency in the signal, then the sampling rate must be at least twice the maximum signal frequency to avoid aliasing, i. e. ωsampling = ≥ 2 ωmax

Frequency aliasing n n Not common due to oversampling Need to sample at least twice highest frequency n Nyquist frequency (above) high-frequency inadequately sampled and misinterpreted as low frequency

Image Quality n IQ depends on: n Spatial resolution & image contrast n Signal to Noise Ratio (SNR) n Artefacts n MRI scan is a compromise between scan time and image

Image Quality Spatial Resolution Noise Contrast Artefacts

Image Quality n Noise is a random variation in signal n Main source of noise is patient’s body, but also everything in the scanner (coils, electronics etc. )

Noise n n n Noise comes from random fluctuations in electrical current. n Exists in all electrical conductors n Also includes electrically conducting tissues of the patient Human tissue contains many ions such as sodium, potassium and chloride. n These are electrically charged atomic particles carrying currents within the body, e. g. in nerve conduction. n These currents generate fluctuating magnetic fields which induce a noise voltage in the coil. Most effective way to reduce this is to use a

Image Quality n Image Contrast n n Varies with pulse sequence & sequence parameters Spatial Resolution Size of smallest detectable detail n Smaller voxels= higher spatial resolution n Voxel volume determined by matrix size (how many pixels FOV divided into), Field of view & slice thickness n However; smaller voxels → lower SNR n
 Matrix size")
Image Voxel Slice thickness Single pixel Pixel size = FOV/matrix Field-of-view (FOV) Matrix size typically 256 or 512 For example: a 32 cm FOV with a 256 (FE) x 192 PE and slice thickness of 4. 5 mm will give a voxel size of 1. 25 x 1. 67 x 4. 5 mm 3.

Spatial Resolution • • Controlled by size of voxel. Voxel volume affected by • • • n n n • • • Slice thickness FOV Matrix Smaller voxels give better resolution However; small voxels could have too little signal compared to noise, therefore SNR is worse. = Trade off: need to determine voxel size required for adequate SNR, but small enough to visualise relevant pathological detail. Matrix size ↓, SNR ↑ , Resolution ↓ FOV ↑, pixel dimension ↑ , SNR ↑, Resolution ↓ Slice thickness ↑, SNR ↑, Resolution ↓
: n Static")
SNR n Depends on: n Fixed factors (user not able to vary): n Static Field intensity n Pulse Sequence Design n Tissue Characteristics n Variable factors (under the operator’s control): n RF coil (Surface coils have higher SNR than body coils) n Receiver bandwidth (more noise for wider bandwidth, but faster sampling) n Sequence parameters n SNR is a trade-off with image contrast n n Increasing TR improves SNR Decreasing TE improves SNR

SNR • ↑ as B ↑ (more spin up than spin down as fewer have energy to oppose field. Net magnetisation vector ↑) • NEX= no. of times frequencies in signal are sampled with the same slope of phase encoding gradient • • • Increasing the NEX increases the signal collected. However; noise also sampled. As noise occurs at all frequencies and randomly, doubling the no. of signal averages only increases the SNR by √ 2 Receiver bandwidth ↓, SNR ↑ (noise sampled ↓

What is needed? n Certain applications, e. g. MR angiography work better with higher resolution. n However; you generally need a certain SNR whatever the resolution. n Mc Robbie et al. states that a SNR of >20: 1 offers little image quality advantage and excess SNR would be better converted to either a larger matrix or shorter scan time. n IF SNR is adequate, high resolution will look better, but diagnostic advantage of 1024 over 512 matrix has not yet been established.

Some images n Images from “From Picture to Proton”

Some images n Images from “From Picture to Proton”
")
Can now understand MR image! Exam/Series/Image Scan plane, position Sequence Frequency direction Timing (weighting) RF coil Slice information Scan time FOV Matrix, Averages

Apply phase encoding gradient slower unchanged faster

Apply Frequency Encoding Gradient Faster unchanged slower
- Slides: 46