
Movie Advisor M Sc Project Doron Harlev Supervisor

- Slides: 21
Movie Advisor M. Sc. Project Doron Harlev Supervisor: Dr. Dana Ron Movie Advisor
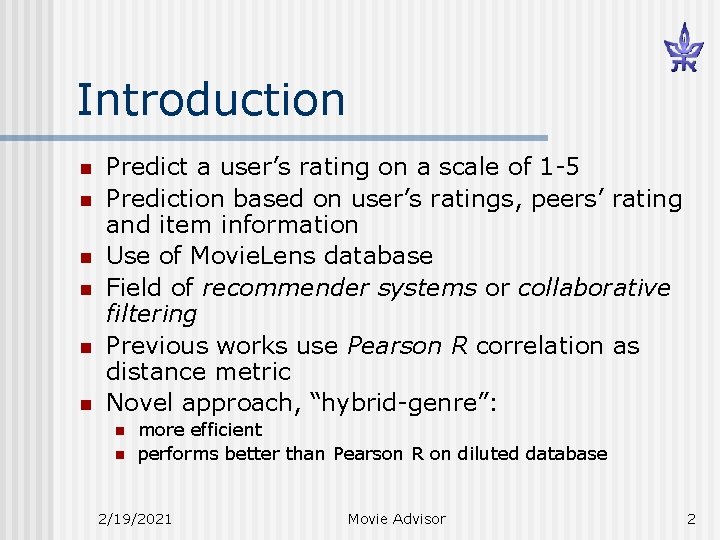
Introduction n n n Predict a user’s rating on a scale of 1 -5 Prediction based on user’s ratings, peers’ rating and item information Use of Movie. Lens database Field of recommender systems or collaborative filtering Previous works use Pearson R correlation as distance metric Novel approach, “hybrid-genre”: n n more efficient performs better than Pearson R on diluted database 2/19/2021 Movie Advisor 2
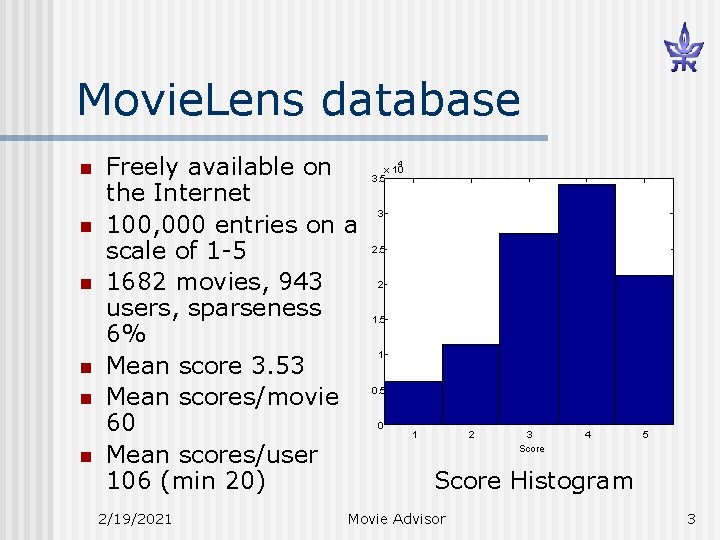
Movie. Lens database n n n Freely available on the Internet 100, 000 entries on a scale of 1 -5 1682 movies, 943 users, sparseness 6% Mean score 3. 53 Mean scores/movie 60 Mean scores/user 106 (min 20) 2/19/2021 4 x 10 3. 5 3 2. 5 2 1. 5 1 0. 5 0 1 2 3 Score 4 5 Score Histogram Movie Advisor 3
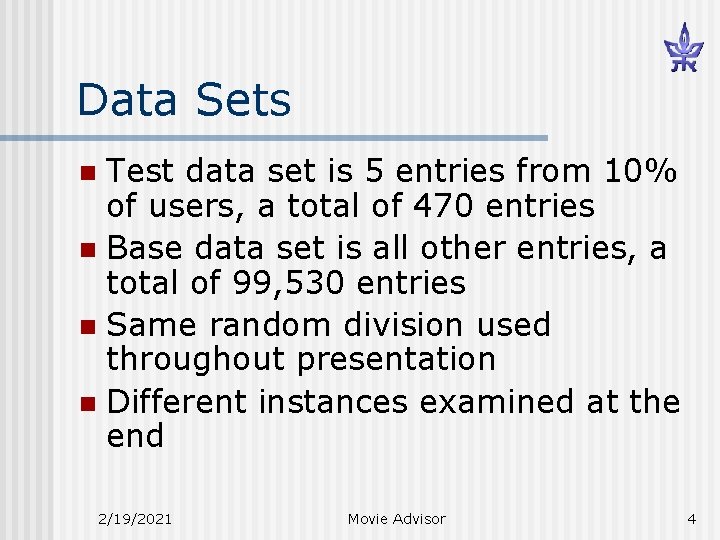
Data Sets Test data set is 5 entries from 10% of users, a total of 470 entries n Base data set is all other entries, a total of 99, 530 entries n Same random division used throughout presentation n Different instances examined at the end n 2/19/2021 Movie Advisor 4
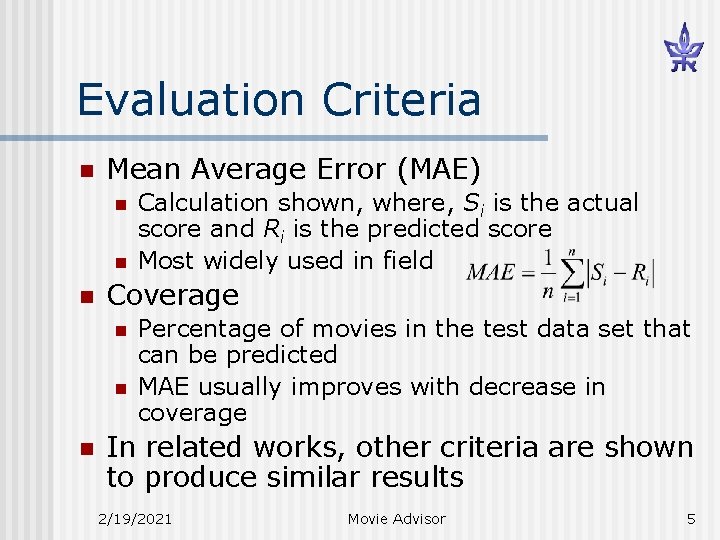
Evaluation Criteria n Mean Average Error (MAE) n n n Coverage n n n Calculation shown, where, Si is the actual score and Ri is the predicted score Most widely used in field Percentage of movies in the test data set that can be predicted MAE usually improves with decrease in coverage In related works, other criteria are shown to produce similar results 2/19/2021 Movie Advisor 5
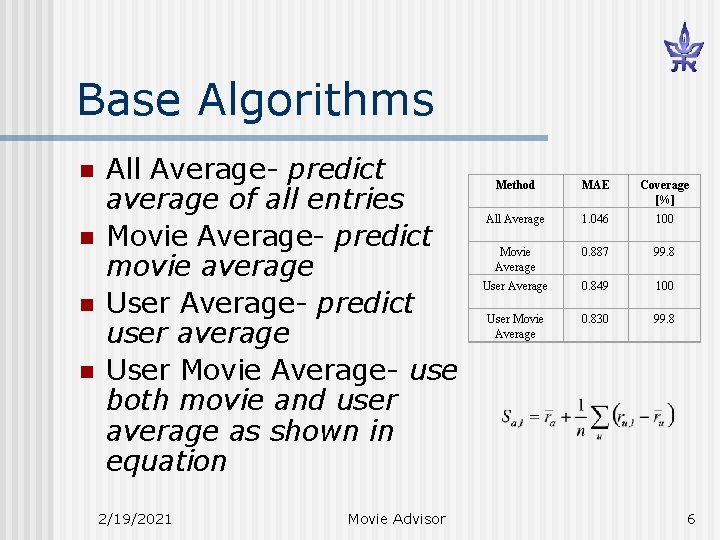
Base Algorithms n n All Average- predict average of all entries Movie Average- predict movie average User Average- predict user average User Movie Average- use both movie and user average as shown in equation 2/19/2021 Movie Advisor Method MAE Coverage [%] All Average 1. 046 100 Movie Average 0. 887 99. 8 User Average 0. 849 100 User Movie Average 0. 830 99. 8 6
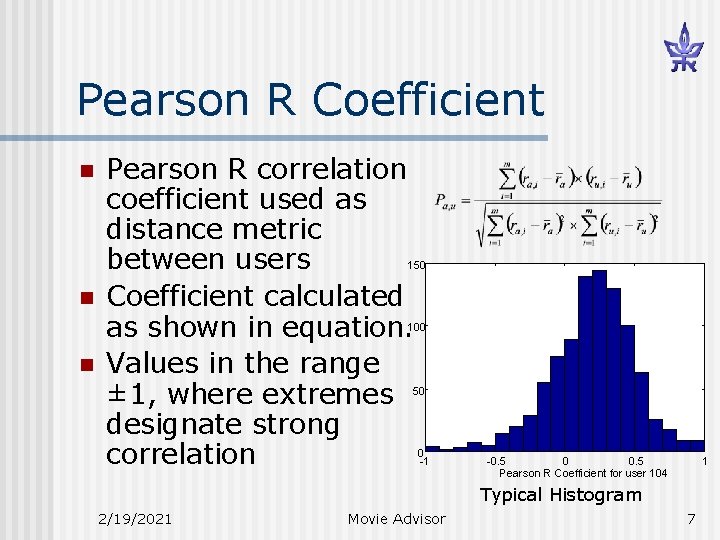
Pearson R Coefficient n Pearson R correlation coefficient used as distance metric between users Coefficient calculated as shown in equation. Values in the range ± 1, where extremes designate strong correlation 150 n 100 n 50 0 -1 -0. 5 0 0. 5 Pearson R Coefficient for user 104 1 Typical Histogram 2/19/2021 Movie Advisor 7
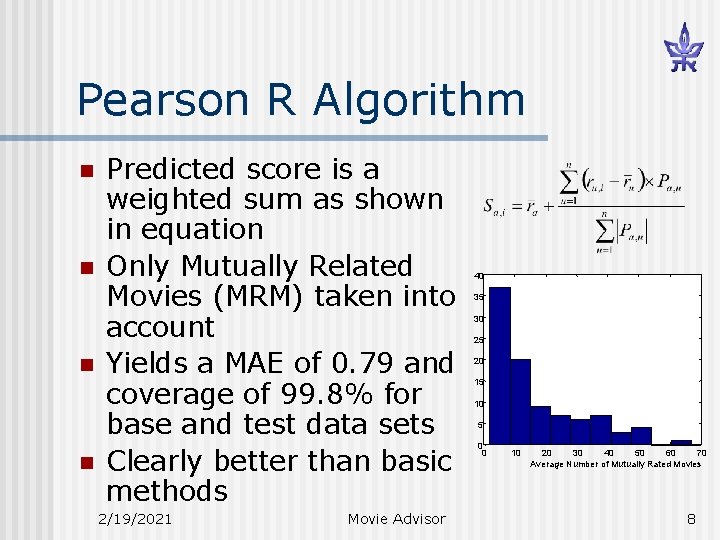
Pearson R Algorithm n n Predicted score is a weighted sum as shown in equation Only Mutually Related Movies (MRM) taken into account Yields a MAE of 0. 79 and coverage of 99. 8% for base and test data sets Clearly better than basic methods 2/19/2021 Movie Advisor 40 35 30 25 20 15 10 5 0 0 10 20 30 40 50 60 70 Average Number of Mutually Rated Movies 8
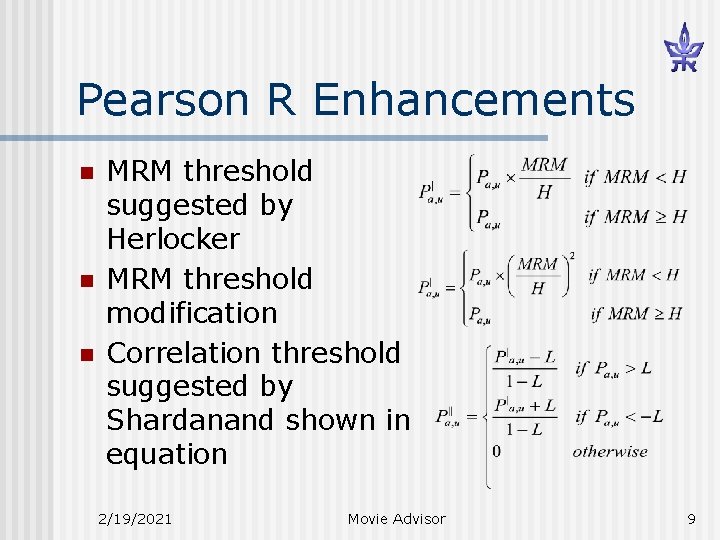
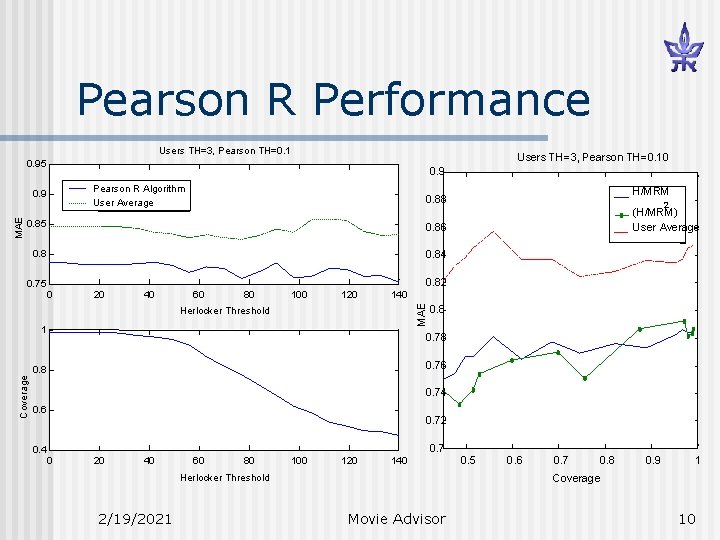
Pearson R Enhancements n n n MRM threshold suggested by Herlocker MRM threshold modification Correlation threshold suggested by Shardanand shown in equation 2/19/2021 Movie Advisor 9
Pearson R Performance Users TH=3, Pearson TH=0. 10 0. 95 0. 9 Pearson R Algorithm User Average 0. 85 0. 86 0. 84 0. 75 2 (H/MRM) User Average 0. 82 0 20 40 60 80 100 120 140 Herlocker Threshold 1 0. 8 0. 76 0. 8 Coverage H/MRM 0. 88 MAE 0. 9 0. 74 0. 6 0. 4 0. 72 0. 7 0 20 40 60 80 100 120 140 Herlocker Threshold 2/19/2021 0. 5 0. 6 0. 7 0. 8 0. 9 1 Coverage Movie Advisor 10
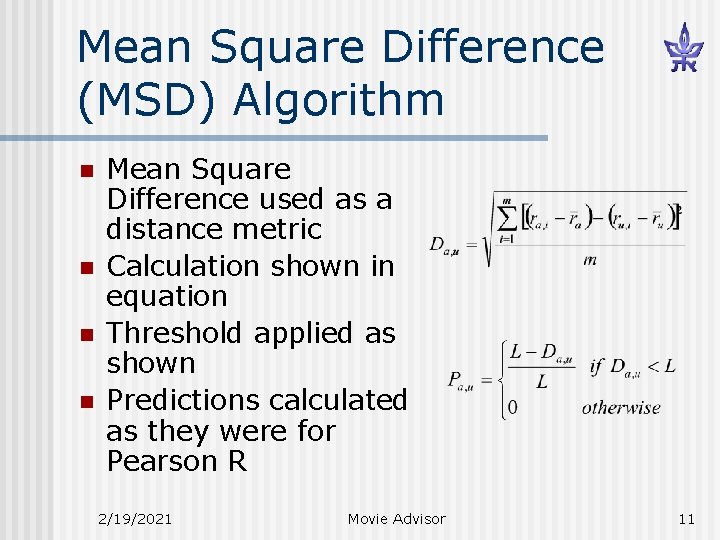
Mean Square Difference (MSD) Algorithm n n Mean Square Difference used as a distance metric Calculation shown in equation Threshold applied as shown Predictions calculated as they were for Pearson R 2/19/2021 Movie Advisor 11
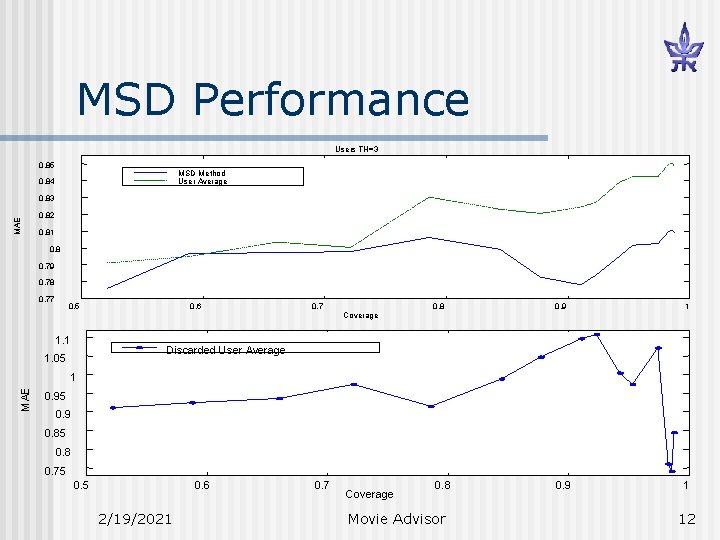
MSD Performance Users TH=3 0. 85 MSD Method User Average 0. 84 MAE 0. 83 0. 82 0. 81 0. 8 0. 79 0. 78 0. 77 0. 5 0. 6 0. 7 0. 8 0. 9 1 Coverage 1. 1 Discarded User Average 1. 05 MAE 1 0. 95 0. 9 0. 85 0. 8 0. 75 0. 6 2/19/2021 0. 7 Coverage Movie Advisor 12
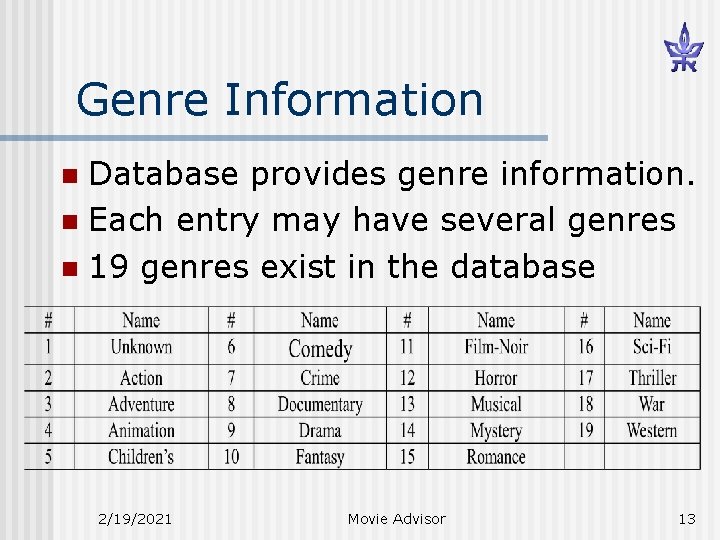
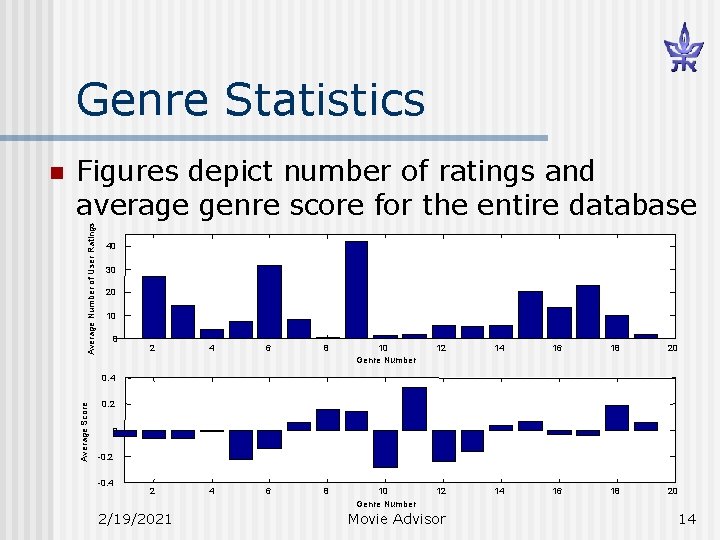
Genre Information Database provides genre information. n Each entry may have several genres n 19 genres exist in the database n 2/19/2021 Movie Advisor 13
Genre Statistics Average Number of User Ratings Figures depict number of ratings and average genre score for the entire database 40 30 20 10 0 2 4 6 8 10 Genre Number 12 14 16 18 20 0. 4 Average Score n 0. 2 0 -0. 2 -0. 4 2/19/2021 Movie Advisor 14
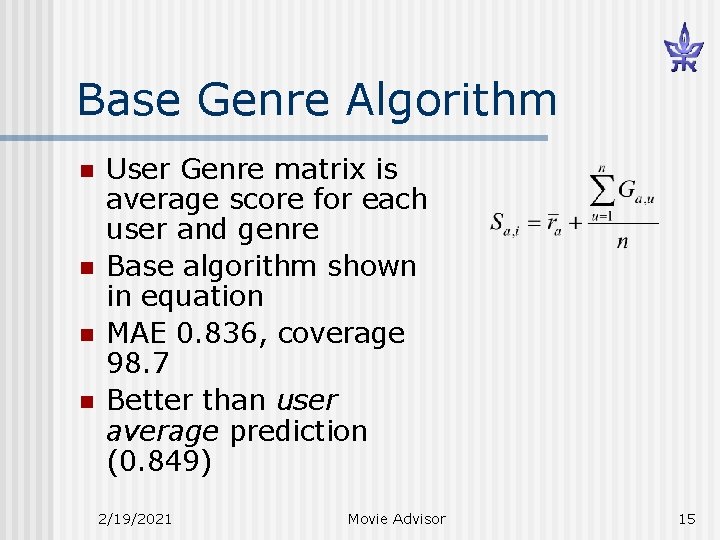
Base Genre Algorithm n n User Genre matrix is average score for each user and genre Base algorithm shown in equation MAE 0. 836, coverage 98. 7 Better than user average prediction (0. 849) 2/19/2021 Movie Advisor 15
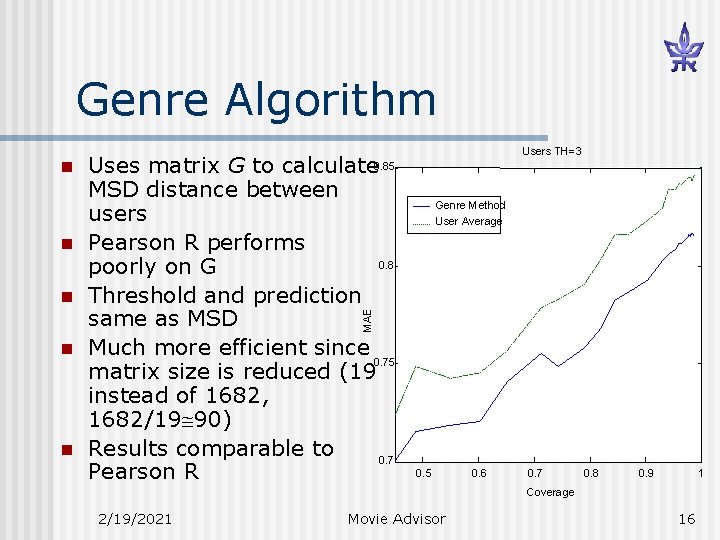
Genre Algorithm n n Genre Method User Average MAE n Uses matrix G to calculate 0. 85 MSD distance between users Pearson R performs 0. 8 poorly on G Threshold and prediction same as MSD Much more efficient since 0. 75 matrix size is reduced (19 instead of 1682, 1682/19 90) Results comparable to 0. 7 Pearson R Users TH=3 n n 0. 5 0. 6 0. 7 0. 8 0. 9 1 Coverage 2/19/2021 Movie Advisor 16
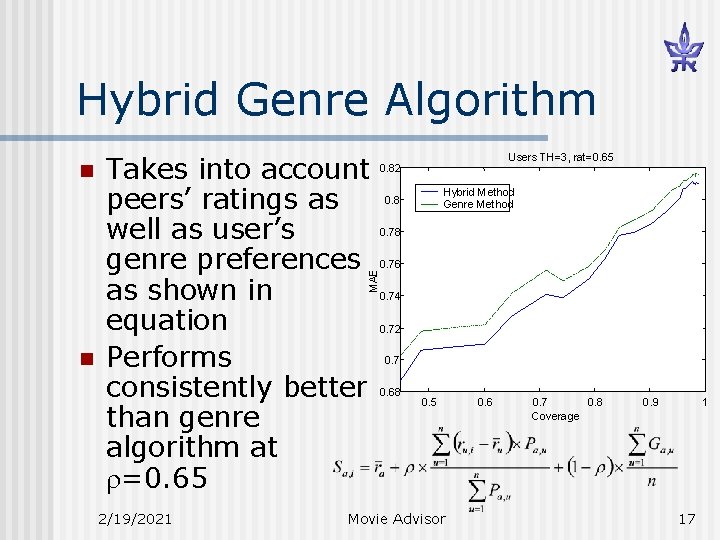
Hybrid Genre Algorithm Takes into account peers’ ratings as well as user’s genre preferences as shown in equation Performs consistently better than genre algorithm at =0. 65 MAE n n 2/19/2021 Users TH=3, rat=0. 65 0. 82 Hybrid Method Genre Method 0. 8 0. 76 0. 74 0. 72 0. 7 0. 68 0. 5 Movie Advisor 0. 6 0. 7 0. 8 Coverage 0. 9 1 17
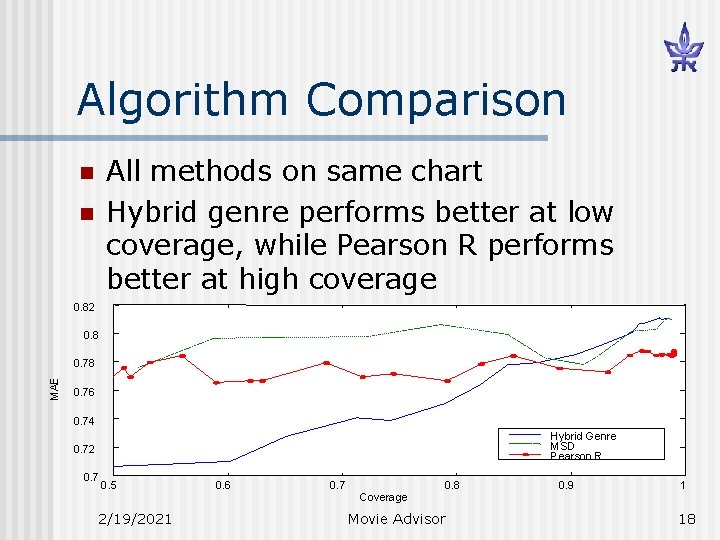
Algorithm Comparison All methods on same chart Hybrid genre performs better at low coverage, while Pearson R performs better at high coverage n n 0. 82 0. 8 MAE 0. 78 0. 76 0. 74 Hybrid Genre MSD Pearson R 0. 72 0. 7 0. 5 2/19/2021 0. 6 0. 7 Coverage 0. 8 Movie Advisor 0. 9 1 18
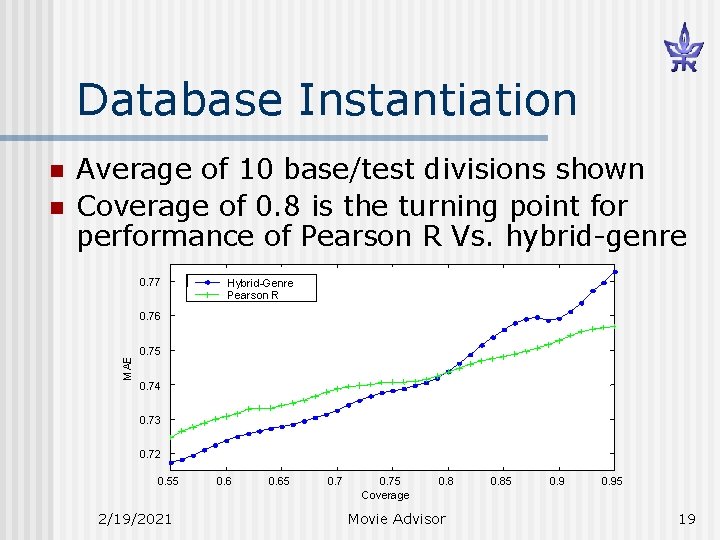
Database Instantiation n Average of 10 base/test divisions shown Coverage of 0. 8 is the turning point for performance of Pearson R Vs. hybrid-genre 0. 77 Hybrid-Genre Pearson R 0. 76 MAE n 0. 75 0. 74 0. 73 0. 72 0. 55 2/19/2021 0. 65 0. 75 Coverage 0. 8 Movie Advisor 0. 85 0. 95 19
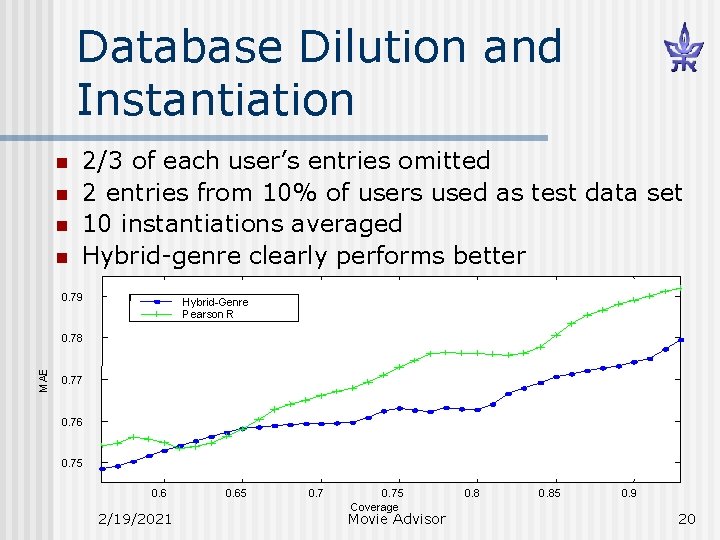
Database Dilution and Instantiation n n 2/3 of each user’s entries omitted 2 entries from 10% of users used as test data set 10 instantiations averaged Hybrid-genre clearly performs better 0. 79 Hybrid-Genre Pearson R MAE 0. 78 0. 77 0. 76 0. 75 0. 6 2/19/2021 0. 65 0. 75 Coverage Movie Advisor 0. 85 0. 9 20
Conclusions n n Database, base methods and existing methods presented analyzed Novel approach, hybrid-genre, explained and compared Hybrid-genre is more efficient, and performs better as sparseness is increased May prove more practical in real-world applications 2/19/2021 Movie Advisor 21