Movement of Rainbow Trout in Arkansas Tailwaters Daniel

Movement of Rainbow Trout in Arkansas Tailwaters Daniel D. Magoulick Arkansas Cooperative Fish and Wildlife Research Unit Department of Biological Sciences University of Arkansas - Fayetteville

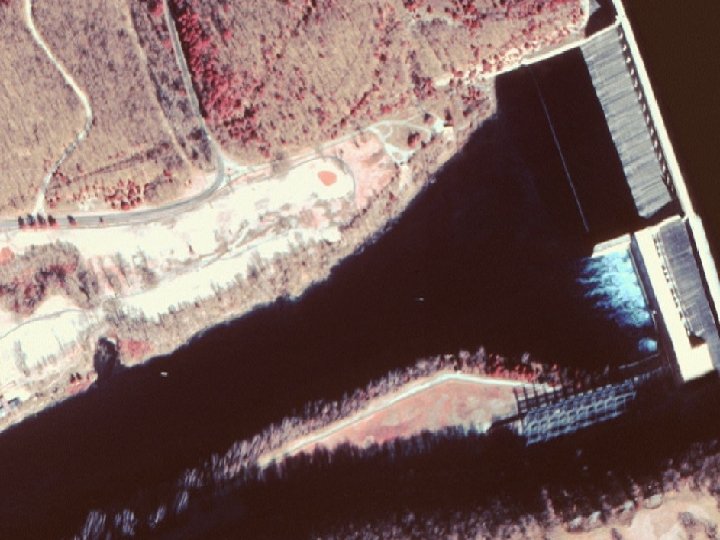
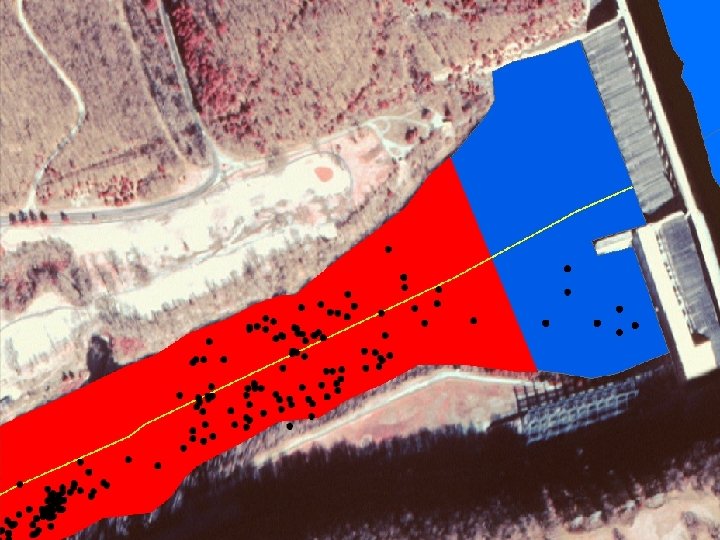
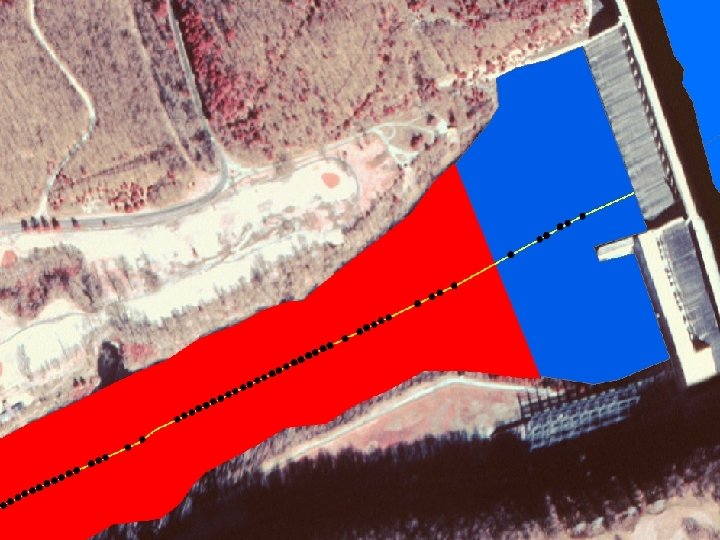
Questions About C & R Areas • Do resident trout stay within the C & R areas? • Do rainbow trout maintain home ranges? • How do movements compare to the CR lengths? Bull Shoals Dam & Tailwater http: //www. arkansas. com/photo-gallery/default. asp#Bull Shoals Lake and the White River
 Bull Shoals = 1400 Norfork = 1600 Rim Shoals")
Study Sites Stream Length (m) Bull Shoals = 1400 Norfork = 1600 Rim Shoals = 2600 Sylamore = 4200

Methods Two Approaches I. Radiotelemetry II. Otolith Microchemistry http: //www. marinebiodiversity. ca/otolith/english/daily. htm

Part I: Radiotelemetry I. III. IV. Data Collection GIS Analysis SAS Analysis SYSTAT Analysis PAIRED STUDY DESIGN 20 IN / 20 OUT in Fall 2005 *Boosted to 20 IN at Bull, Norfork & Rim in Spring 2006

Radiotelemetry Design • Capture • Tag • Weekly Locations & Fates Norfork Preliminary Study • Good Retention • Growth Rates/Condition from Population Estimates
 &")
Capture & Tagging 1. 2. 3. 4. Capture Sedate Weight (450 g +) & Length Picture & VI Tag
 Tag Insertion")
Capture & Tagging 5. 6. 7. 8. 9. Incision Antibiotic Injection (OTC) Tag Insertion Stitches & Ointment Revive and Release Finished

Tracking Summary • 230 Total Fish Tagged – 144 Tagged IN CR – 86 Tagged OUT CR • 124 (54%) Individuals Tagged had 15+ – 86/144 (60%) Tagged IN – 38/86 (44%)Tagged OUT • Average of 24 Relocations/Fish Used for Home Range Analysis *All further analysis includes only fish with 15+ locations
 • 22/38 Tagged")
Locations: In vs. Out • 60/86 Tagged In Stayed In (70%) • 22/38 Tagged Out Stayed Out (58%) • 42/124 Moved In-between (34%) – Fish Tagged OUT at Rim Were Found IN on Average 26% of the Time – Fish Tagged IN at Sylamore Were Found OUT on Average 53% of the Time SITE BULL NORFORK RIM SYLAMORE
 Moved > Length of")
Movement: Distance vs. CR • • • Overall: 24/124 (15%) Moved > Length of Respective CR Areas Bull: 4/32 (13%) Moved >1700 m Norfork: 9/31 (29%) Moved > 1800 m Rim: 4/35 (11%) Moved ( > 2600 m Sylamore: 7/26 (27%) Moved >4000 m *NOTE SCALE 10000 8000 9000 7000 MAX_RANGE 8000 6000 5000 4000 3000 7000 30000 6000 5000 20000 4000 3000 2000 10000 2000 1000 0 8000 6000 7000 9000 40000 IN OUT TAGGED BULL 0 1000 IN OUT 0 TAGGED IN OUT TAGGED NORFORK RIM 0 IN OUT TAGGED SYLAMORE

t n e sp e im ere t f h o n 95% etwee b
")
SYSTAT: Within Site ANOVA’s Median and range (in parentheses)
")
SYSTAT: AMONG Site ANOVA’s Median and range (in parentheses)

Discussion • At most sites fish tagged OUT were found IN more than vice -versa – At Sylamore, fish movement between areas was common • Most fish are moving less than the lengths of their respective CR areas – Sylamore had the largest home range estimates • Warm water may force fish to move
 tagged in the CR have remained there • Only 15% of")
Conclusions Majority (70%) tagged in the CR have remained there • Only 15% of all tagged fish (IN or OUT) had linear distance > the length of their CR areas • CR areas appear to have no effect on distances moved Most of the fish tagged IN are being protected from angler mortality, increasing their residence time, allowing them to grow larger
- Slides: 19