MOTION Honors Physics Scalars vs Vectors Scalars are

")


 Positive Velocity")
 Constant Velocity Fast, Rightward (+) Constant Velocity")
 Constant Velocity Fast, Leftward (-) Constant Velocity")


- Slides: 23
MOTION Honors Physics
Scalars vs. Vectors • Scalars are quantities that only have a magnitude (number value) Examples: • 5 meters, 4000 calories, 40 Joules • Vectors are quantities that have BOTH magnitude and direction. Examples: • 30 meters/second East, 5 miles South
Distance vs. Displacement • Distance is a scalar quantity and refers to how much distance an object traveled during its motion. • Displacement is a vector quaintly that refers to the object’s overall change in position.
A physics teacher walks 4 meters East, 2 meters South, 4 meters West, and finally 2 meters North. What is the distance and displacement of the physics teacher?
Use the diagram to determine the resulting displacement and the distance traveled by the skier during these three minutes.
Use the diagram to determine the resulting displacement and the distance traveled by coach pacing back and forth along the sidelines.
Speed vs. Velocity • Speed is a scalar quantity that refers to how fast an object is moving. • Does NOT keep track of direction • Velocity is a vector quantity that refers to the rate at which an object changes its position. • Keeps track of direction
Calculating Average Speed Average Velocity • • D V T
Average Speed vs. Instantaneous Speed • Instantaneous Speed – The speed at any given instant in time. • Average Speed – The average of all instantaneous speeds; found by distance/time
A physics teacher walks 4 meters East, 2 meters South, 4 meters West, and finally 2 meters North. This entire motion lasted for 24 seconds. What is the average speed and the average velocity?
Use the diagram to determine the average speed and the average velocity of the skier during these three minutes.
POSITION TIME GRAPHS
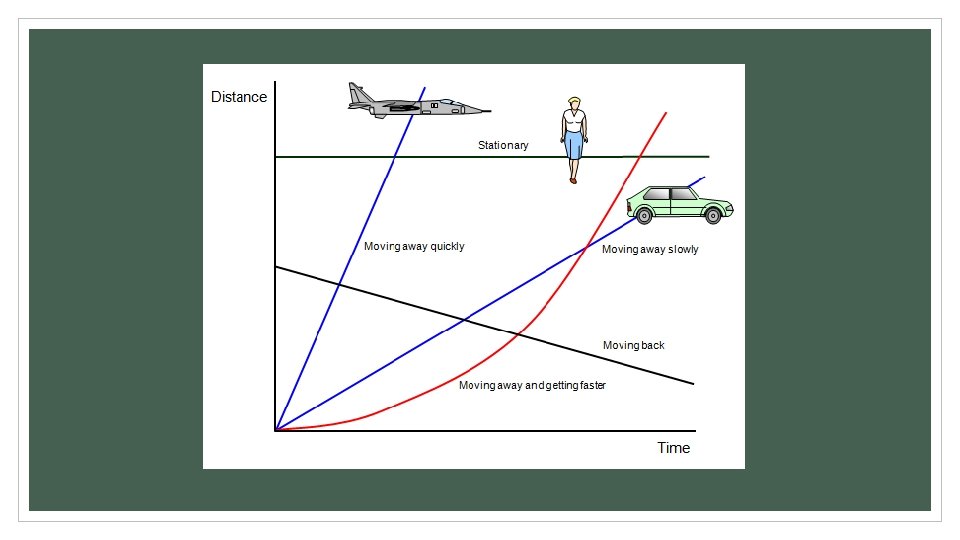
Position vs. Time Graphs • The slope of a graph showing distance plotted overtime gives the velocity • The steeper the line, the greater the velocity.
Constant Velocity This position vs. Time Graph represents a car moving with constant, rightward velocity of 10 m/s.
Changing Velocity This position vs. Time Graph represents a car moving with rightward, changing velocity and speeding up.
Constant Velocity Positive Velocity Changing Velocity (acceleration) Positive Velocity
Slow, Rightward (+) Constant Velocity Fast, Rightward (+) Constant Velocity
Slow, Leftward (-) Constant Velocity Fast, Leftward (-) Constant Velocity
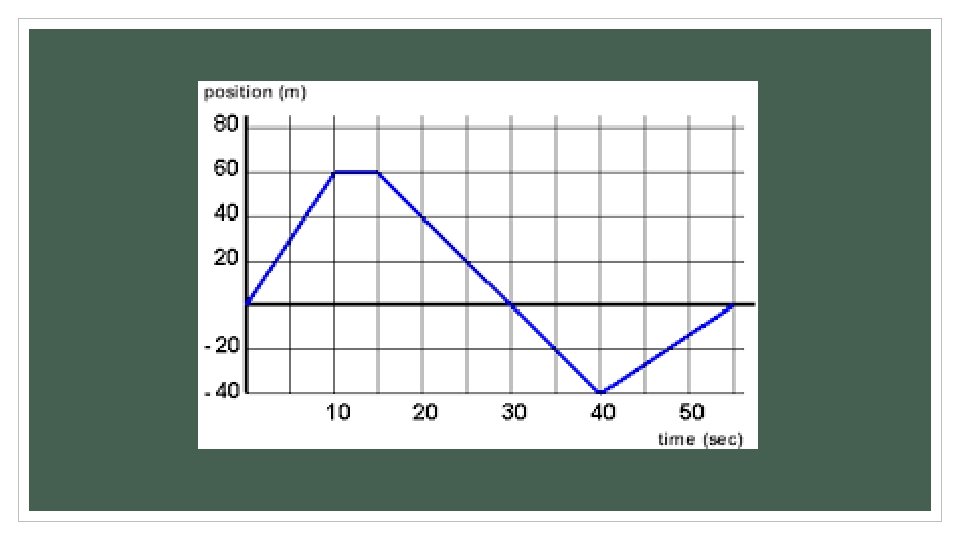
How to Calculate Speed Using a Position vs. Time Graph To determine speed from this graph, do the following: • Pick two points • Determine how much distance was covered between the two points • Determine how much time passed between the two points • Plug those numbers into the speed equation and solve
Ticker Tape Diagrams • The distance between dots on a ticker tape represents the object’s position change during that time interval. • A large distance between dots = the object was moving fast • A small distance between dots = the object was moving slow
Ticker Tape Diagrams • A changing distance between dots = a change in velocity (acceleration) • A constant distance between dots = a constant velocity