Motion Graphs Motion graphs are an important tool


 Distance (m) 0 0")
 120 90 60 30 0 0 10 20 Time (s)")

 slope means a faster speed.")


 40 30 20 10 0 0 1 2 3 Time")


- Slides: 17
Motion & Graphs • Motion graphs are an important tool used to show relationships between position, speed and time. • It’s an easy way to see how speed or position change over time
Distance vs. Time Graph • Shows an object’s position at a given time. • Time: on X-Axis • Distance: on Y-Axis
You Try It • Graph the following data Time (s) Distance (m) 0 0 10 50 20 100 30 150
150 Distance (m) 120 90 60 30 0 0 10 20 Time (s) 30
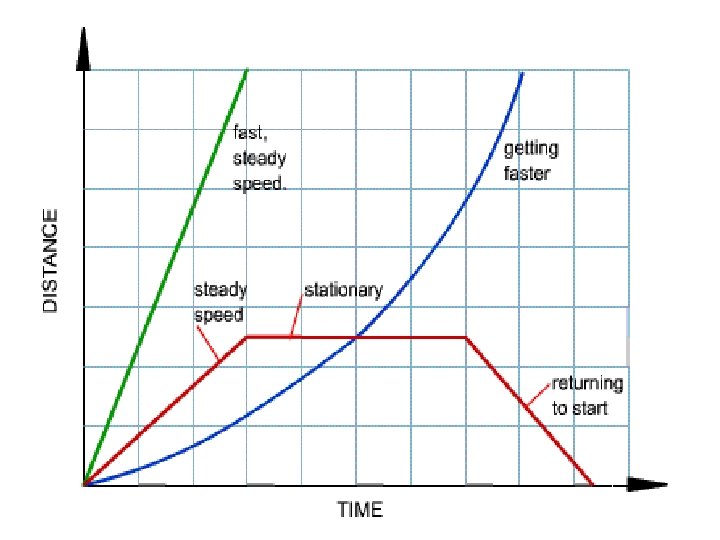
This graph shows constant speed. Whenever there is a straight line, the speed stays the same.
Slope • A bigger (steeper) slope means a faster speed.
Steeper Slope = Faster Speed
Steeper Slope = Faster Speed
Acceleration • A change in speed or direction – Speeding up – Slowing down – Turning
Constant Acceleration Time Distance 0 s 0 m 1 s 2 m 2 s 8 m 3 s 18 m 4 s 32 m 5 s 50 m
50 Distance (m) 40 30 20 10 0 0 1 2 3 Time (s) 4 5
This graph shows constant acceleration. This means that the object is always accelerating.
Predict: What does THIS GRAPH show?
• The straight line means its position is not changing
a. The person stopped for five seconds. b. The person ran back to the start in 2. 5 seconds. c. The person ran 5 meters in 5 seconds. a. The person stopped for five seconds. c. The person ran 5 meters in 5 seconds. b. The person ran back to the start in 2. 5 seconds.